
Abstract
SUMMARY: Different MR imaging patterns of cerebral fat embolism have been reported in the literature without a systematic review. Our goal was to describe the patterns, explore the relationship between disease course and the imaging patterns, and discuss the underlying mechanism. We reveal 5 distinctive MR imaging patterns: 1) scattered embolic ischemia occurring dominantly at the acute stage; 2) confluent symmetric cytotoxic edema located at the cerebral white matter, which mainly occurs at the subacute stage; 3) vasogenic edematous lesions also occurring at the subacute stage; 4) petechial hemorrhage, which persists from the acute to the chronic stage; and 5) chronic sequelae, occurring at late stage, including cerebral atrophy, demyelinating change, and sequelae of infarction or necrosis. Underlying mechanisms of these imaging patterns are further discussed. Recognition of the 5 evolving MR imaging patterns of cerebral fat embolism may result in adjustment of the appropriate management and improve the outcome.
ABBREVIATION:
- CFE
- cerebral fat embolism
Since its first emergence in Zenker in 1862,1 fat embolism syndrome has been known to be associated with displaced long bone fracture of the lower extremities and is characterized by respiratory disability, petechial skin rash, and neurologic symptoms, typically seen between 12 and 72 hours after the injury. The incidence of cerebral fat embolism (CFE) has been reported to be 0.9%–2.2%.2 Although CFE is usually self-limiting, it may be fatal. In comparison with the respiratory presentations, diagnosis of CFE in the brain may be more challenging because the symptoms are more variable (headache, confusion, seizure to coma). Moreover, the presentations of CFE can be further complicated by the frequent co-occurrence of brain contusion or hypoxic-ischemic injury caused by traumatic insults.
MR imaging of the brain by using T2-weighted, diffusion-weighted, gadolinium contrast-enhanced images, and susceptibility-weighted imaging has been applied to CFE and has improved the ability to make a diagnosis.3⇓–5 However, the image diagnosis of CFE remains a challenge because it has various presentations: Reversibility and distribution of the brain lesions in the different reported series and timing have been confusing.4⇓–6 The explanations for these diverse results include the small number of reported cases and MR imaging examinations performed at different stages of CFE. These segmented observations clearly limit the understanding of the whole disease entity.
In this systematic review, we aimed to describe and summarize the MR imaging patterns from the existing literature and explore the relationship between the disease time course and the image patterns. We hypothesized that CFE involves a dynamic process with time and may present with different dominant image patterns in each specific time window. The associated mechanisms are also discussed.
Materials and Methods
We included all articles written in English in the PubMed database up to April 30, 2012, by searching approximately 20 MeSH terms and keywords such as “fat emboli” or “embolism,” “MR image,” “diffusion-/susceptibility-weighted image,” and their derivatives. Reference lists of included articles were hand-searched for published reports missed by the electronic search. Articles published earlier than 1996 (no proper DWI image) or without satisfying image quality were later excluded. In addition, we searched the Far Eastern Memorial Hospital image database for additional CFE cases. Finally, all identified cases were summarized; images were reread by 2 neuroradiologists, assigned to patterns, and correlated with the timing in the disease course (Fig 1). The course was separated into 3 stages: acute (within 24 hours to 4 days after the fracture), subacute (5–14 days after the fracture), and late (>14 days after the fracture).

Quality of Reporting of Meta-analysis standards (QUOROM) flow diagram of articles included in this systematic review.
Results
There were 21 case reports identified from the literature search, which included 25 cases. Additionally, we identified 2 cases from the Far Eastern Memorial Hospital image database (all images provided in this article are from these 2 cases). There were, in total, 27 cases and 44 MR imaging examinations reviewed for this article. Among the 38 MR images with recorded timing of examinations, 13 were obtained in the acute stage; 11, in the subacute stage; and 14, in the late stage. The longest follow-up duration for a single case was 152 days. In Fig 2, both the number of cases of each imaging pattern and the proportion of cases with each pattern against time are illustrated. The analysis shows that the image patterns did evolve with time and could be separated into 3 major types. In addition, the type 2 pattern could be further divided into 3 subtypes. The patterns are summarized in the On-line Table and described below in detail.

Bar graph of case numbers and positive proportion of each pattern against time.
Type 1: Scattered Cytotoxic Edema
Type 1 is the most well-known pattern of CFE, which was first named the “starfield pattern” by Parizel et al in 2001.6 It is also the most common pattern in this review (61.5% of 44 MR examinations). The pattern is actually a nonspecific feature seen in all kinds of embolic events; in CFE, it tends to be reversible, with reversibility resulting in a better clinical outcome. The MR imaging findings are scattered spot lesions with restricted diffusion on DWI sequences. The signal of T2WI may be iso- or hyperintense. The lesions are distributed bilaterally in watershed zones and deep gray matter, such as the centrum semiovale, basal ganglia, and thalami (Fig 3). Of all the acute-stage MR imaging examinations, 84.6% were shown to have a type 1 pattern, while it is much less frequently seen in the subacute and late stages (18% and 0%) (Fig 2).
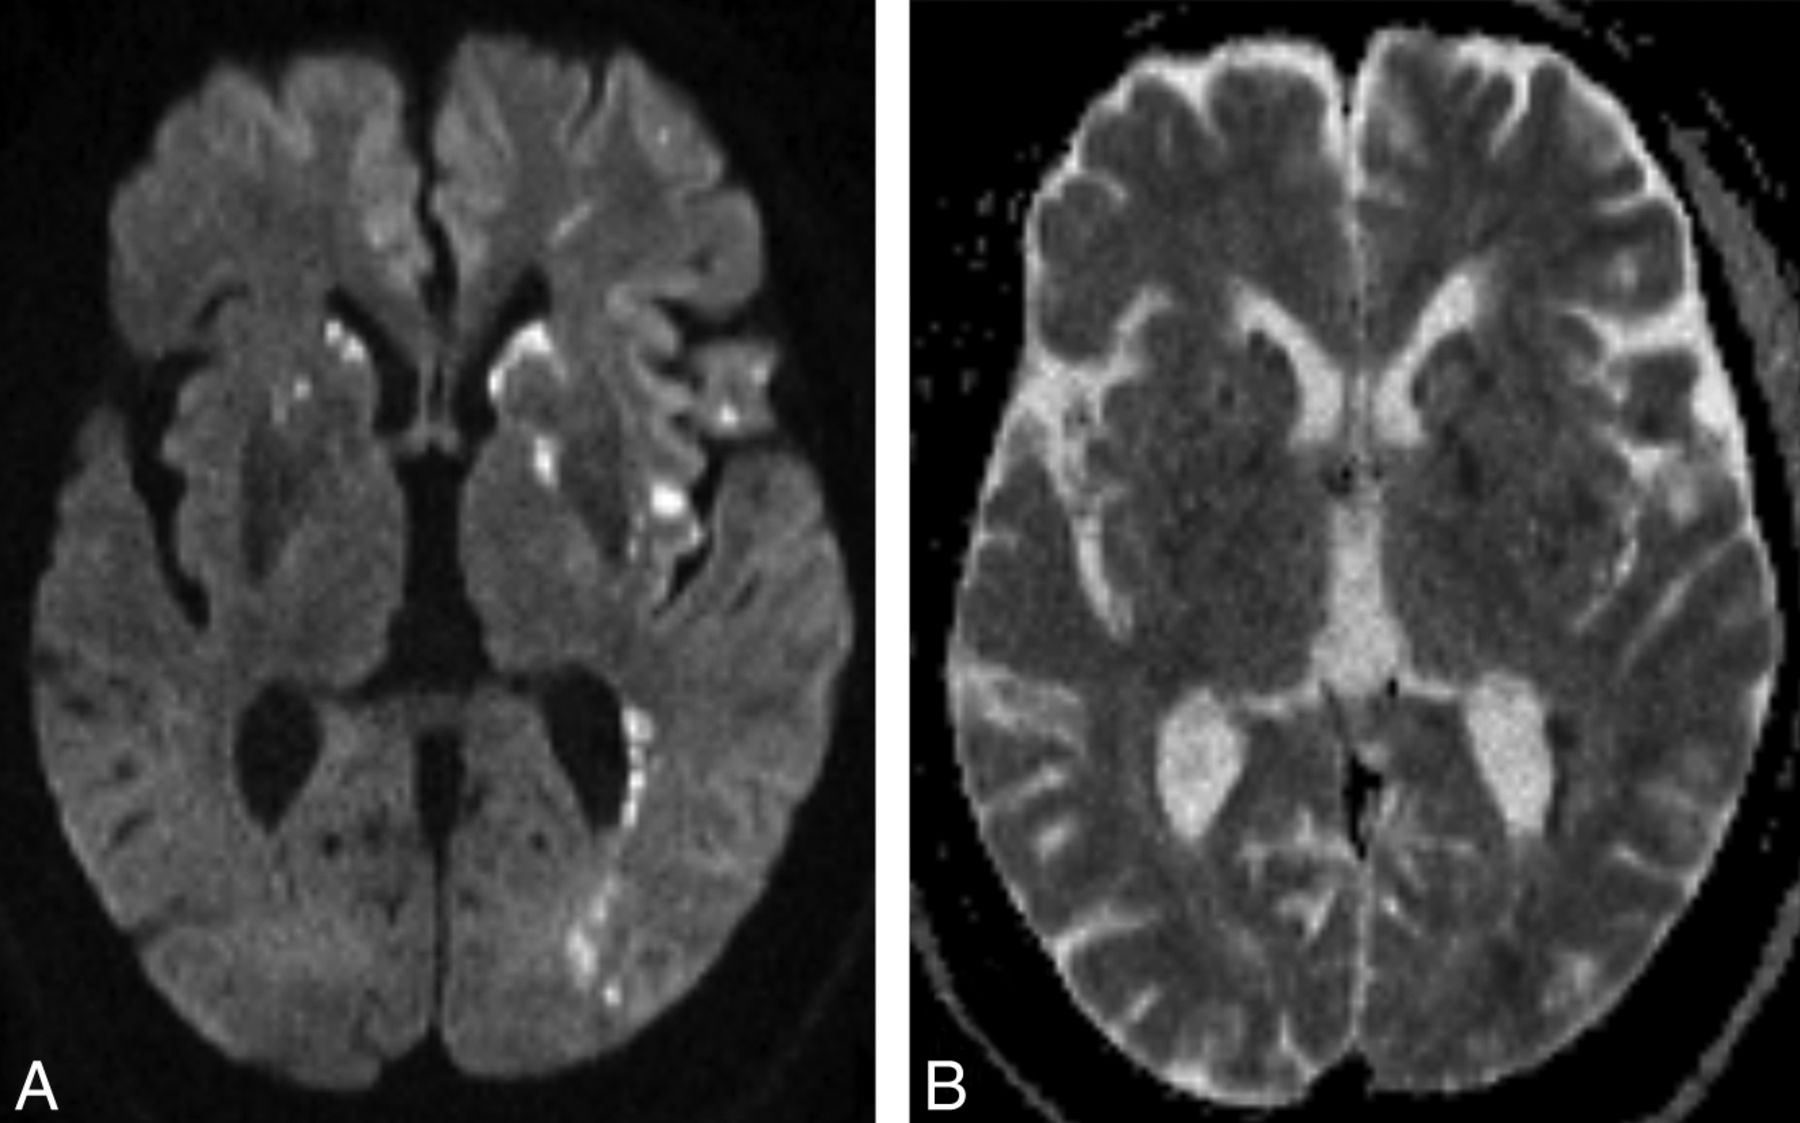
A 25-year-old man with a traumatic tibial bone fracture. Rapid consciousness decline was noted at postfracture day 1, and the brain MR imaging was performed at postfracture day 2. Axial DWI (A) and corresponding axial ADC image (B) demonstrate scattered spot diffusion-restricted lesions in the bilateral striatum, left posterior internal capsule, insula, operculum, and periventricular white matter (type 1 pattern).
Type 2A: Confluent Cytotoxic Edema in White Matter
Although the type 2A pattern is often ignored, it is also a common (57.7% of 44 MR imaging examinations) and characteristic finding of CFE. The MR imaging feature is confluent symmetric lesions with restricted diffusion on DWI in periventricular and subcortical white matter bilaterally. The cerebellar peduncles, corpus callosum, and posterior internal capsule may be involved (Fig 4A–F). On T2WI, lesions are usually faintly hyperintense or occasionally have no obvious signal change. In this review, the pattern was noted dominantly at the subacute stage with an 81.8% positive rate among all the reported subacute stage MR imaging examinations (Fig 2). Differential diagnoses included hypoglycemic encephalopathy, delayed posthypoxic leukoencephalopathy, and toxic leukoencephalopathy. Detailed history-taking and laboratory examinations may help to achieve a correct diagnosis.

Another 19-year-old man with a traumatic tibial bone fracture. Stupor was noted at postfracture day 1, and the brain MR imaging was delayed to postfracture day 7 due to unstable vital signs. Serial axial DWI (A–D) and axial ADC images (E and F) demonstrate confluent cytotoxic edematous lesions in periventricular and subcortical white matter of the frontal, parietal, and temporal lobes; corpus callosum; and cerebellar peduncle bilaterally, which are type 2A patterns (asterisks). Axial ADC (E), corresponding FLAIR (G), and contrast-enhanced T1WI (H) demonstrate dot-shaped vasogenic edema with faint enhancement, which is a type 2B pattern (arrows).
Type 2B: Vasogenic Edema Lesions That May Enhance
During the subacute stage, another commonly found MR imaging feature (64% of 11 MR examinations) in this review was type 2B, with hyperintense lesions on T2WI. The difference is that these lesions usually have a small dot or patch shape, and the signal on the DWI image shows increased diffusion instead. The lesions lie in both gray and white matter (Fig 4). In the 4 cases with contrast injection in this review, 3 demonstrated enhancement of the lesions (On-line Table).
Type 2C: Petechial Hemorrhage of White Matter
T2* sequences, such as gradient-echo images or SWI, are sensitive for detecting vascular structures, blood products, and changes in iron content. Previous reports have mentioned that it is common to detect tiny petechial hemorrhages of the perivascular space in CFE.3,7⇓–9 Suh et al3 mentioned that SWI is better at detecting hemorrhages of CFE than gradient-echo images. In this review, the type 2C pattern was noted in all stages (60%, 60%, and 88% in acute, subacute, and late stages, respectively; Fig 2). Petechiae were noticed as early as the first day of the long bone fracture and could last through the whole course without significant change (Fig 5). Differential diagnoses included diffuse axonal injury, which presents with petechial hemorrhage as well. However, diffuse axonal injury mainly occurs in the gray-white matter interface of the frontotemporal lobes and corpus callosum, while CFE petechial hemorrhage is located predominantly in the white matter and shares the same distribution as the confluent white matter cytotoxic edema pattern (type 2A). In our opinion, the high positive rate with early-onset and persistent, specific MR imaging characteristics indicating petechiae hemorrhage and unique distribution in white matter could make this pattern a pathognomonic feature of CFE.

Serial axial SWI images of the second case at postfracture week 3 (A–D) demonstrate numerous petechial hemorrhages in the subcortical and periventricular white matter, cerebellar hemisphere and peduncle, and posterior corpus callosum bilaterally. Corresponding images of the same level at postfracture week 5 (E) and 3 months (F) demonstrate no significant interval change (type 2C pattern).
Type 3: Chronic Sequelae
At the late stage, most of the above lesions were resolving while brain atrophy was beginning to be noted (Fig 6). Although the presence of chronic sequelae was not emphasized in the existing CFE literature, this feature suggests an incomplete lesion resolution rather than a true recovery. Besides, there is a group of other abnormal findings. Most are hyperintense on T2WI without restricted diffusion on DWI. Some are in a dot/nodule shape, and some have a large amorphous shape. These may represent sequelae of infarction, cavitation, scar formation, gliosis, or chronic demyelination. The type 3 findings may be the best correlation with the final clinical prognosis.

Axial FLAIR images of the second case at postfracture day 7 (A) and 3 months (B) demonstrate brain volume loss and demyelination change at the late stage of CFE (type 3 pattern).
Discussion
To date, CFE has been thought to result from an initial mechanical obstruction of arterial circulation by neutral fat, followed by a delayed extensive biochemical toxic injury from free fatty acids.
It is claimed that because long bone fracture occurs at the lower extremity, a large amount of disseminated bone marrow fat tissue may flow into the pulmonary circulation and, in the presence of right-to-left shunts, can later pass into the systemic circulation.10 However, most reported cases in this review failed to demonstrate this shunt; the presence of an alternative mechanism may be a better explanation. A study on orthopedic surgery with dogs has shown that fat vacuoles smaller than 5 μm still could directly pass through the pulmonary capillary bed.11 Subsequently, showers of microemboli flow into the brain sporadically, getting lodged in capillaries, which may result in ischemic injury and present as a “starfield” (type 1) pattern seen on DWI at an early stage. The size of the impacted intravascular fat vacuole was further identified as approximately 4–42 μm in another animal study.12
Nevertheless, because the fat vacuoles, mainly the triglyceride triolein, are in liquid form in the human body (freezing point of 40°C), they could deform, split into smaller globules, and recycle into the pulmonary circulation.13,14 Reperfusion of the brain then salvages the damaged tissue; this possibility may explain the transient imaging change and clinically better outcome than other embolic events.
Fat embolism in the lung is hydrolyzed to free fatty acids by the action of local pulmonary lipase-oleic acid as its major component.15 Oleic acid and the triglyceride triolein both are toxic to the lungs and brain, and the former is more toxic and may induce cerebral cytotoxic edema reported in the cat model of CFE experiments.16⇓–18 Microcystic change of the neutrophil matrix and swelling of neuronal and glial cells were prominent in electron microscopy.17 DWI can detect cytotoxic edema and reveal the corresponding evidence as confluent symmetric diffusion-restricted lesions, which usually occur in the subacute stage (type 2A pattern). Clinically, despite the fact that fat emboli are small, the lesions tend to be distributed in white matter rather than gray matter. Sevitt18 proposed that rich vascularity in the gray matter could have sufficient anastomotic potential to protect against the injury, and Kamenar and Burger19 suggested that white matter lesions are indirectly produced by the cortical emboli through venous sludging and white matter edema. However, myelin has a high lipid content and a slow turnover; all the myelinated tracts are particularly vulnerable to the accumulation of lipophilic substances and to lipid peroxidation. Therefore, cerebral white matter may be selectively vulnerable due to its lipophilic property.
The type 2A pattern is quite similar to images of delayed posthypoxic leukoencephalopathy, usually caused by carbon monoxide or heroin intoxication. Although the exact mechanism of this leukoencephalopathy is not clear, the hypothesis of “leukotoxin” inducing delayed leukoencephalopathy was proposed.20,21 Future research to explore potential relationships between “leukotoxin” and the mechanism underlying CFE image changes in the subacute stage is warranted.
In addition to cerebral cytotoxic edema, it seems that the toxicity of free fatty acids also causes vasogenic edema at an early phase of disease by opening the blood-brain barrier. In a cat study, as early as 30 minutes after oleic acid was injected into the internal carotid artery, electron microscopy revealed discontinuity of the cerebral capillary endothelium with a gap of approximately 1–3 μm. Small fat vacuoles, red blood cells, and plasma fluid were leaked into the perivascular interstitial space.17 This process could explain the type 2B and 2C MR imaging patterns, such as the appearance of hyperintensity on T2WI and ADC maps and numerous tiny low intensities seen on T2* images.
Although the damage seems to occur within minutes in animal studies,16,17 a time lag of neurologic symptoms after fracture is commonly seen in clinical settings—the passage between the pulmonary and systemic circulation (the filter effect) may play a key role in determining the lag. Furthermore, this filter effect could also be a major determinant of the extent and pattern of arterial mechanical obstruction. Without the existence of the “filter” (eg, in the presence of a patent foramen ovale), the onset of neurologic symptoms would have been much earlier and the lesions, larger; there could have been more territorial infarctions in cases of CFE as well.
Last, reversible image change was proposed in several previous reports,4 whereas complete recovery was seldom seen in clinical presentations. After reviewing these cases in detail, brain atrophy and demyelinating changes were the most common anomaly found in the late stage of disease (type 3 pattern). Normalization of signal, instead of reversible change, would be a better explanation of the MR imaging attenuation recovery. In fact, some residual lacunar infarction and necrosis were also noted. It seems likely that the brain volume loss may correlate with prognosis.
Conclusions
In this review, 5 distinct image patterns were identified through the 3 different stages of CFE; this finding suggests dynamic patterns of CFE with time. Scattered cytotoxic edema mainly occurred in the acute stage, while in the subacute stage, confluent cytotoxic edema or vasogenic edema or both were identified. In the late stage, chronic sequelae including brain atrophy or demyelination were recognized. Petechial hemorrhage in a confluent shape was seen in the examined images from all stages; this pattern in SWI may be a pathognomonic feature of CFE. Early recognition of the proper pattern may help determine appropriate management and improve the outcome.
Because all cases in this review were discovered because they were recognized and described as CFE, there is an inherent selection bias against previously unrecognized or atypical patterns. Further studies with CFE cases involving a series of imaging changes with time may be required to provide further support for the current findings. Correlation with clinical outcome is also needed.
Footnotes
Disclosures: Jozef Jarosz—UNRELATED: Consultancy: GE Healthcare, Payment for Lectures (including service on Speakers Bureaus): GE Healthcare, Bayer, Travel/Accommodations/Meeting Expenses Unrelated to Activities Listed: British Association of Stroke Physicians, Comments: travel expenses to a UK meeting 2012.
Indicates open access to non-subscribers at www.ajnr.org
References
- © 2014 by American Journal of Neuroradiology


Jump to section
Related Articles
Cited By...
- Cerebral fat emboli in a patient with paraplegia caused by bilateral femur fractures
- Sickle cell disease and fat embolism: a rare complication of vaso-occlusive crisis
- Catastrophic Cerebral Fat Embolism Syndrome Lacks Hyperacute MRI Findings
- Diverse manifestations of a sickle cell crisis
- Cerebral fat embolism: the value of susceptibility-weighted imaging
- Role of susceptibility-weighted imaging in demonstration of cerebral fat embolism