
Abstract
BACKGROUND AND PURPOSE: Established methods of assessing bone mineral density are associated with additional radiation exposure to the patient. In this study, we aimed to validate a method of assessing bone mineral density in routine multidetector row CT of the lumbar spine.
MATERIALS AND METHODS: In 38 patients, bone mineral density was assessed in quantitative CT as a standard of reference and in sagittal reformations derived from standard multidetector row CT studies without IV contrast. MDCT-to-quantitative CT conversion equations were calculated and then applied to baseline multidetector row scans of another 62 patients. After a mean follow-up of 15 ± 6 months, patients were re-assessed for incidental fractures and screw loosening after spondylodesis (n = 49).
RESULTS: We observed conversion equations bone mineral densityMDCT = 0.78 × Hounsfield unitMDCTmg/mL (correlation with bone mineral densityquantitative CT, R2 = 0.92, P < .001) for 120 kV(peak) tube voltage and bone mineral densityMDCT = 0.86 × Hounsfield unitMDCTmg/mL (R2 = 0.81, P < .001) for 140 kVp, respectively. Seven patients (11.3%) had existing osteoporotic vertebral fractures at baseline, while 8 patients (12.9%) showed incidental osteoporotic vertebral fractures. Screw loosening was detected in 28 patients (57.1% of patients with spondylodesis). Patients with existing vertebral fractures showed significantly lower bone mineral densityMDCT than patients without fractures (P < .01). At follow-up, patients with incidental fractures and screw loosening after spondylodesis, respectively, showed significantly lower baseline bone mineral densityMDCT (P < .001 each).
CONCLUSIONS: This longitudinal study demonstrated that converted bone mineral density values derived from routine lumbar spine multidetector row CT adequately differentiated patients with and without osteoporotic fractures and could predict incidental fractures and screw loosening after spondylodesis.
ABBREVIATIONS:
- BMD
- bone mineral density
- CV
- coefficient of variation
- qCT
- quantitative CT
- RMSE
- root-mean-square error
- HU
- Hounsfield unit
Osteoporosis is defined as a skeletal disorder characterized by compromised bone strength predisposing a person to an increased risk of fracture.1 Osteoporotic fractures are associated with increased mortality.2 Because osteoporosis is a disease of the elderly, prevalence of osteoporosis and thus financial costs induced by this disease are increasing with the aging population.3 Therefore, osteoporosis is classified as a public health problem.4
Bone strength consists of 2 main parameters, bone quality and bone mineral density (BMD). Bone quality refers to architecture, turnover, damage accumulation, and mineralization.1,5 Although BMD is only 1 component in bone strength, mineral density values have been adapted to define osteoporosis.5,6 There are several diagnostic techniques available for measuring BMD, such as dual-energy x-ray absorptiometry or quantitative CT (qCT).5,7⇓⇓⇓–11 All established methods are associated with additional radiation exposure to the patient (eg, up to 360 μSv in qCT)12 and additional expenses. Therefore, the purpose of this study was to establish a method to assess BMD in routine lumbar multidetector row CT data without additional radiation exposure and examination time.
Recent studies have not only demonstrated that BMD values of the lumbar spine derived from sagittal reformations of routine abdominal contrast-enhanced MDCT scans are able to differentiate postmenopausal women with osteoporotic vertebral fractures,13 they may also be able to predict incidental fractures.14 However, from a neuroradiologist's perspective, there are further questions unanswered. First, it would be beneficial to understand whether BMD assessed by this method can predict screw loosening after spondylodesis, because planning of the procedure depends on bone strength.15 Second, most of the lumbar spine MDCT scans in patients with spine disease are performed without prior application of IV contrast medium. Therefore, the method should be analyzed without the influence of IV contrast medium. Third, male patients should be included in the analysis of BMD values obtained from MDCT scans as well. With a special emphasis on these 3 aspects presented, the first aim of this study was to calculate equations to convert BMD values derived from routine lumbar spine MDCT scans to qCT-equivalent values. The second aim of this study was to analyze differences in patients with and without baseline fractures, by using converted BMDMDCT values and to determine whether these baseline values predict incidental fractures and screw loosening in patients with spondylodesis.
Materials and Methods
Patients
Patients were retrospectively identified in the PACS data base of our institution. Patients with pathologic bone changes like bone metastases and hematologic or metabolic bone disorders aside from osteoporosis were excluded from the study. Therefore, clinically available data and previous imaging studies were thoroughly analyzed.
For the development of MDCT-to-qCT conversion equations as outlined below, 38 consecutive patients (mean age, 74 ± 6.5 years; 25 women) were included, in whom both a standard lumbar MDCT without prior application of IV contrast medium and a qCT scan were performed within 90 days. Patients were categorized in 2 subgroups considering applied tube voltage: 120 kVp for standard lumbar spine studies (n = 24) and 140 kVp for postmyelography studies (n = 14), respectively. Imaging data of the subgroups were used separately to develop 2 MDCT-to-qCT conversion equations.
Next, 62 consecutive patients (mean age, 71 ± 5.8 years; 29 women) were identified in whom follow-up imaging was performed for the evaluation of incidental fractures and screw fit within 6 to 36 months. Forty-nine of those patients had spondylodesis at follow-up. The mean follow-up time was 15 ± 6 months.
The study was performed in accordance to the Declaration of Helsinki16 and our institutional guidelines on human research. The patients gave written consent for scientific evaluation of material at the time of admission.
Imaging and Imaging Analysis
Lumbar qCT examinations were performed with two 64-row MDCT scanners (either Sensation Cardiac 64 or Somatom Definition AS; Siemens Healthcare, Erlangen, Germany) following a standard protocol according to the manufacturer's instructions. Reference phantoms with a bonelike and a waterlike phase (Osteo Phantom; Siemens) were used for calibration. Tube voltage was 80 kVp; tube load, 140 mAs; and axial section thickness, 10 mm.
The implemented automated analysis software (syngo Osteo CT, Siemens) was used to select midvertebral sections of L1, L2, and L3 based on lateral topograms of the lumbar spine. Vertebrae with fractures were excluded from analysis, and other lumbar or thoracic vertebrae were selected instead.
Afterward, axial sections were positioned in the midvertebral sections while tilting the gantry before each vertebra scan to ensure that sections were parallel to the upper and lower endplate of each vertebra. A region of interest was automatically placed by the software in the trabecular region of each vertebra, and trabecular BMD values were measured (Fig 1). Experienced radiology technologists performed the qCT studies while being supervised by experienced radiologists. For this study, the plausibility of readings was re-evaluated by 1 author (B.J.S.).

A, Reformatted sagittal 15-mm section (increment, 5 mm) located in the vertebral midline obtained by MDCT. Circular ROIs half the vertebral height are placed in the ventral halves of the trabecular compartment of the vertebrae and show mean attenuation values of the trabecular bone (Hounsfield units). B, Sagittal topogram showing qCT section positioning in the very same vertebrae.
All noncalibrated lumbar spine studies were obtained with the same 64-row MDCT scanner (Brilliance 64; Philips Healthcare, Best, the Netherlands). Scanning parameters were 120 kVp tube voltage for standard lumbar spine studies and 140 kVp for postmyelography spine studies, respectively; the adapted tube load was averaged at 200 mAs and minimum collimation (0.6 mm). To ensure continuous imaging quality, the CT scanner was calibrated weekly by air calibration and on the basis of phantom scans (CT calibration phantom; Mindways Software, Austin, Texas). Sagittal reformations of the spine were reconstructed with a section thickness of 2 mm. For analysis of attenuation values (Hounsfield units [HU]) in MDCT scans (HUMDCT), the sagittal reformations were loaded into the institutional PACS (EasyVision R11.4.1, Philips Healthcare).
The built-in multiplanar reconstruction tool of the PACS software was used to create a sagittal 15-mm section (increment, 5 mm) located in the vertebral midline. Thereafter, by using the attenuation measurement tool of the PACS viewer, circular ROIs with a diameter of half the vertebral height in the ventral halves of the trabecular compartment of the vertebrae (Fig 1). In the 38 patients included in the calculation of the conversion equations, the same vertebral bodies as in the corresponding qCT scan analysis were measured. In the 62 patients in whom follow-up scans were performed, the vertebral bodies L1–L3 were analyzed. If vertebral fractures were diagnosed, other thoracic or lumbar bodies (maximum, T11–L5) were selected. The placement of all ROIs was performed by 1 author (B.J.S.). The time for region-of-interest placement and BMD calculation was <1 minute for 1 patient.
All follow-up scans were obtained with one of the previously mentioned 64-row MDCT scanners at our institution. Existing and incidental osteoporotic vertebral fractures from T12–L5 were diagnosed by 2 radiologists in consensus according to Genant et al17 in baseline and follow-up MDCT images, respectively. They were rated according to the following scale: grade 0, normal; grade 1, mildly deformed (approximately 20%–25% reduction in anterior, middle, and/or posterior height and a reduction of area of 10%–20%); grade 2, moderately deformed (approximately 25%–40% reduction in any height and a reduction in area of 20%–40%); and grade 3, severely deformed (approximately 40% reduction in any height and area). Screw loosening was diagnosed on the follow-up MDCT images by 2 radiologists in consensus reading.
Statistical Analysis
Mean BMDqCT and mean HUMDCT values were calculated for vertebrae scanned in qCT and MDCT, respectively. Two separate MDCT-to-qCT conversion equations were calculated for patients scanned with 120 kVp and 140 kVp tube voltage, respectively, by using a linear regression model. The calculated prediction errors were summarized as the root-mean-square error (RMSE, in milligrams per milliliter) and the RMSE coefficient of variation (CV, percentage).18 For further evaluation of the agreement between BMDqCT and converted BMDMDCT, a Bland-Altman plot was used.19
Patients included for follow-up analysis were split into different groups depending on their baseline fracture status, follow-up fracture status, and screw fit after spondylodesis. Mean attenuation values (HUMDCT) obtained from baseline examinations were converted to BMDMDCT values by applying the conversion equations for 120 kVp and 140 kVp, respectively.
General linear models were used to compare BMDMDCT values between patients with versus those without existing fractures, incidental fractures at follow-up, and new signs of screw loosening at follow-up, respectively. The independent variable was the patient group, while the dependent variable was BMDMDCT. Age, sex, follow-up time, and kilovolt(peak) were included as covariates in the models to obtain adjusted effects.
Receiver operator characteristic analyses were performed, and the areas under the receiver operating characteristic analysis curves were used to evaluate the overall diagnostic performance of the converted BMDMDCT values to differentiate patients with and without fractures at baseline and follow-up and patients with screw loosening versus patients with proper spondylodesis status. The Youden J statistic was used to identify the optimal cutoff values for differentiation of groups.20
Statistical analysis was performed with the Statistical Package for the Social Sciences (IBM, Armonk, New York) and was supervised by a statistician. All tests were performed by using a 2-sided .05 level of significance.
Reproducibility
Intrareader reproducibility was analyzed by redefining ROIs and remeasuring HUMDCT values in 11 patients at least 1 week later than the first reading, and it was specified by using the root-mean-square error. Interreader reproducibility was analyzed the same way between 2 authors (A.S.G. and B.J.S) in 14 patients.
Results
For calculation of the MDCT-to-BMD conversion equations, 106 vertebral bodies were selected in 38 patients. Two separate conversion equations were calculated on the basis of 24 patients for 120 kVp and 14 patients for 140 kVp, respectively.
In patients scanned with 120 kVp, linear regression analysis produced the equation BMDMDCT = 0.78 × HUMDCT(120 kVp) mg/mL (Fig 2), while the correlation coefficient was R2 = 0.92 (P < .001). In 140 kVp scans, the equation BMDMDCT = 0.86 × HUMDCT(140 kVp) mg/mL was calculated (Fig 2) with a correlation coefficient of R2 = 0.81 (P < .001). Calculation of prediction errors showed an overall RMSE of 13.5 mg/mL and an RMSE CV of 15.9%.

Linear regression of mean attenuation (Hounsfield units) and BMD of lumbar vertebrae obtained by MDCT and qCT, respectively (R2 = 0.92 in 120 kVp scans and R2 = 0.81 in 140 kVp scans, respectively).
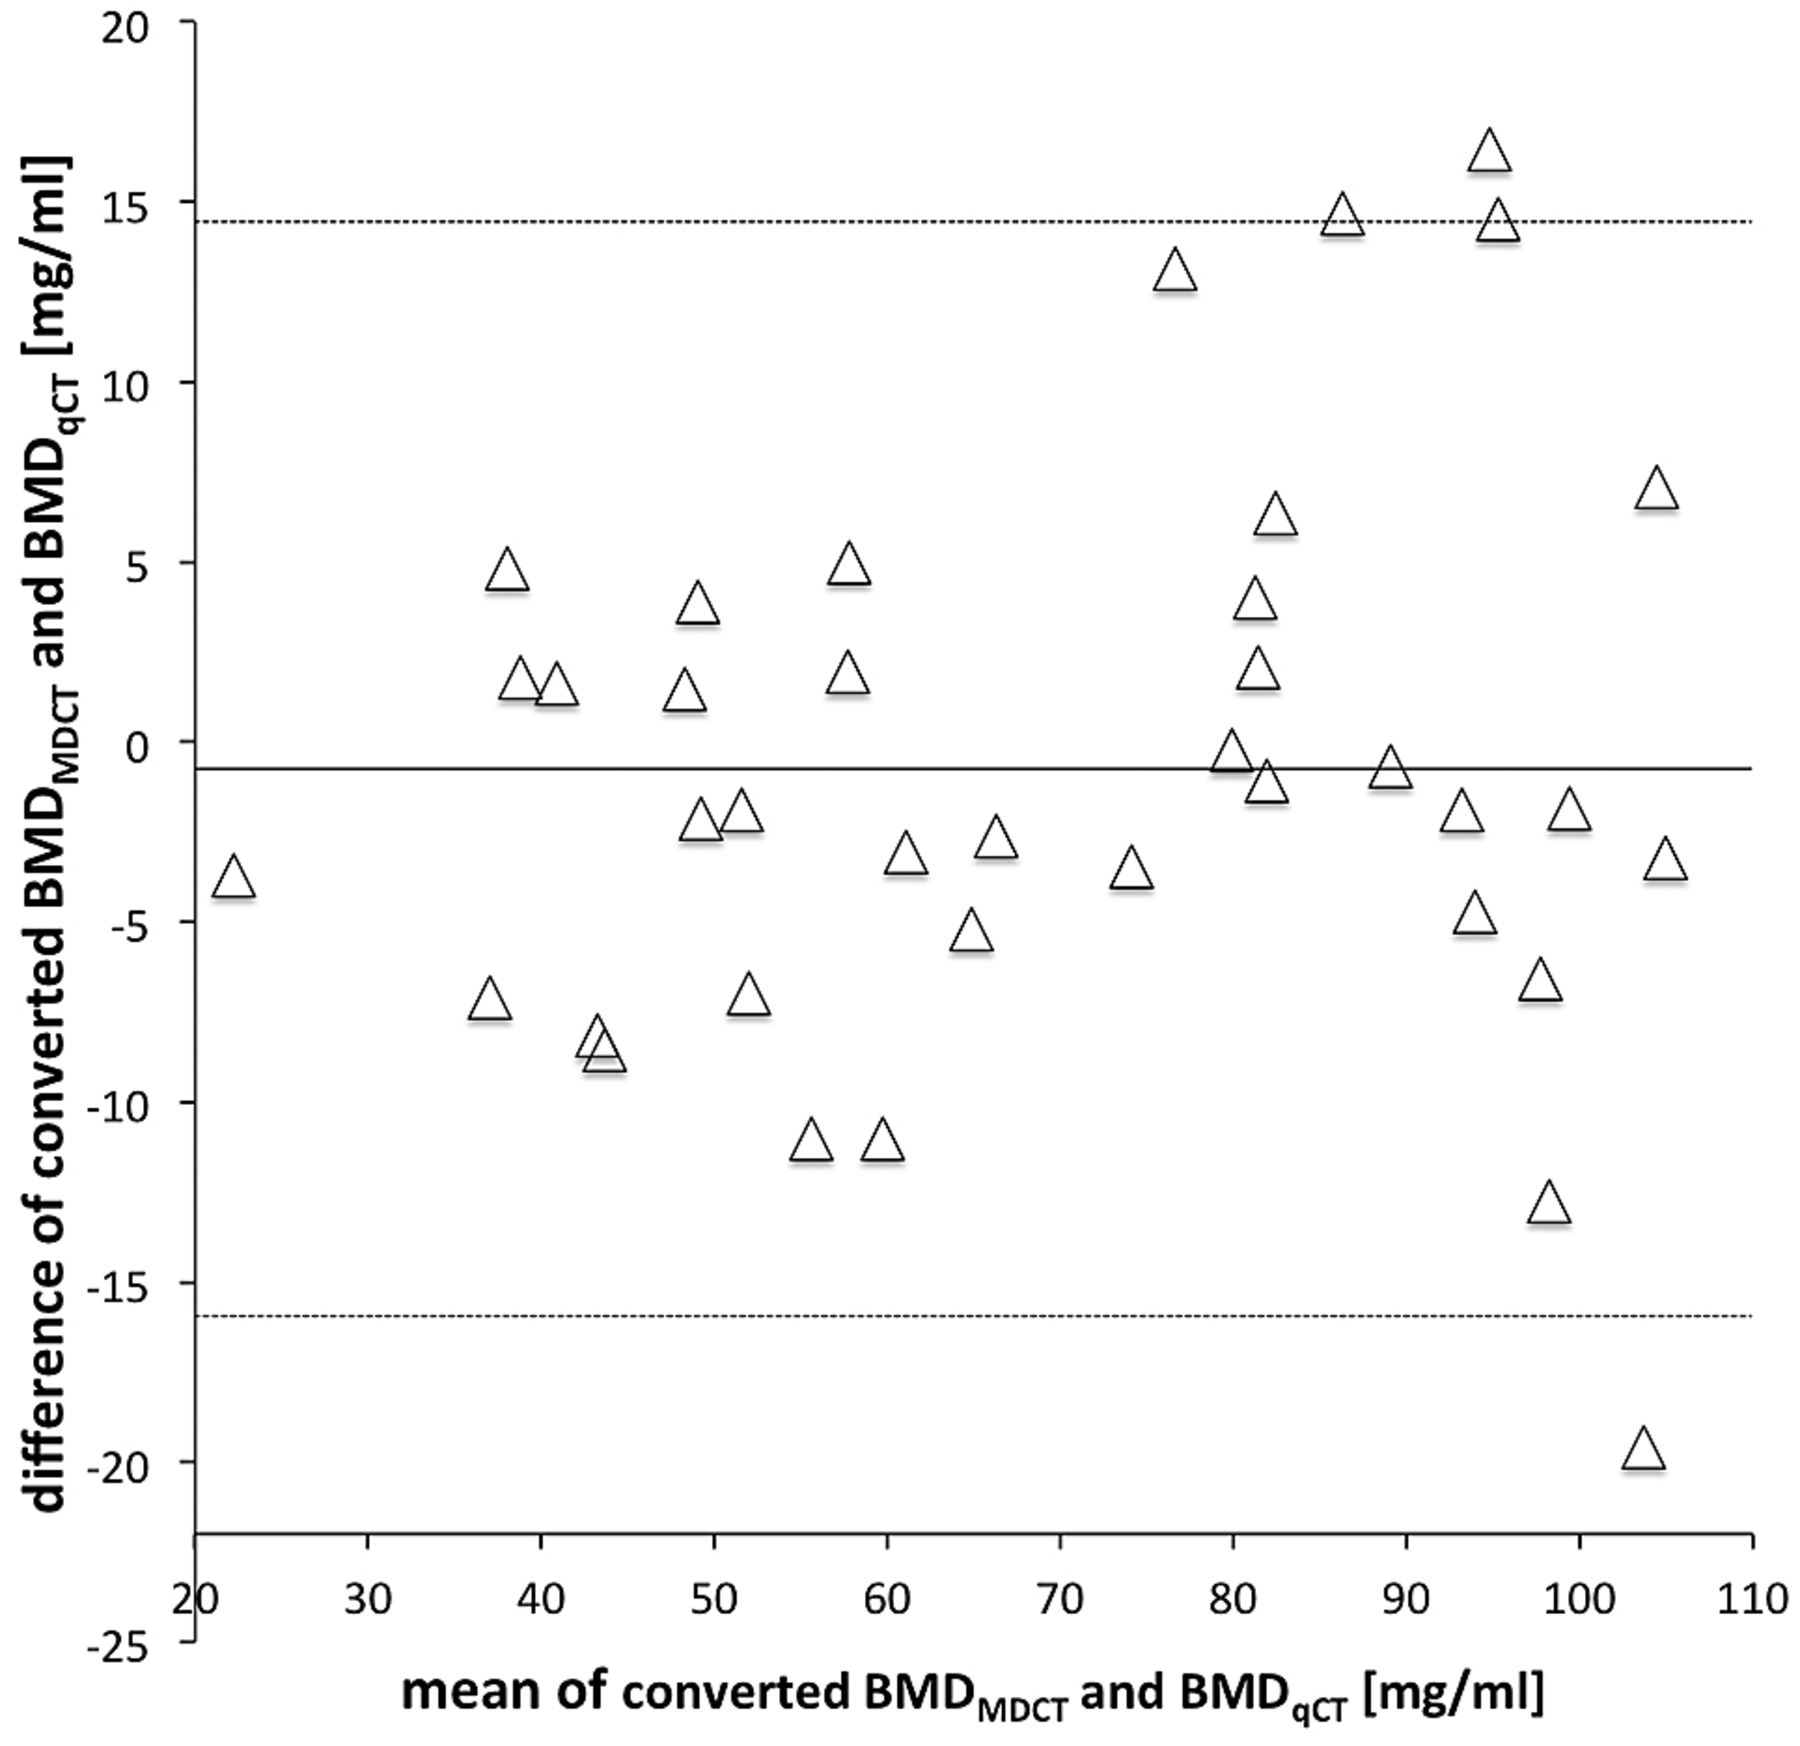
The Bland-Altman plot showed good agreement between BMD values obtained from qCT and MDCT (Fig 3).

Bland-Altman plot showing the means versus the difference of the converted BMD values and BMD values obtained by MDCT and qCT, respectively. The solid line indicates the mean BMD difference of MDCT and qCT (−0.75 mg/mL). The dotted lines indicate mean difference ± 1.96 × SD.
Intrareader reproducibility analysis showed an RMSE of 2.2 mg/mL and an RMSE CV of 2.5%, while interreader reproducibility analysis showed an RMSE of 2.0 mg/mL and an RMSE CV of 2.7%.
Among the 62 patients with follow-up scans, 7 had an osteoporotic fracture at baseline (11.3%), while in 8 patients, incidental osteoporotic fractures were found at follow-up (12.9%). Twenty-eight of 49 patients with spondylodesis showed signs of screw loosening on follow-up imaging (57.1%).
After adjustment for age, sex, follow-up time, and tube voltage, patients with osteoporotic fractures at baseline had significantly lower BMDMDCT values than patients without fractures (57.2 ± 11.2 versus 94.0 ± 29.5 mg/mL; P < .01; Fig 4). For differentiating these patients, an area under the ROC curve of 0.912 (P < .001) was computed in the receiver operating characteristic analysis. The Youden index showed an optimal cutoff at 68.9 mg/mL (sensitivity, 0.78; specificity, 1.00; J = 0.78; Table).

This plot shows mean ± SD converted BMDMDCT values for patients with/without baseline fractures, with/without incidental fractures at follow-up, and with/without screw loosening during follow-up. The asterisk indicates P < .01; the degree sign, P < .001.
Mean Hounsfield unit and BMDMDCT values of patients with/without osteoporotic fractures at baseline and follow-up and with/without screw looseninga
Patients who developed incidental fractures during follow-up showed significantly lower baseline BMDMDCT values than patients without incidental fractures (52.4 ± 10.5 versus 95.4 ± 28.4 mg/mL; P < .001; adjusted for age, sex, follow-up time, and tube voltage; Fig 4). In the receiver operating characteristic analysis of these groups, the area under the ROC curve was 0.972 (P < .001). Optimal cutoff for the prediction of incidental fractures was 66.8 mg/mL (sensitivity, 0.87; specificity, 1.00; J = 0.87; Table).
Patients with spondylodesis and signs of screw loosening at follow-up (Fig 5) had significantly lower BMDMDCT values than patients without screw loosening (77.3 ± 22.3 versus 110.1 ± 30.7 mg/mL; P < .001; adjusted for age, sex, follow-up time, and tube voltage; Fig 4). An area under the ROC curve value of 0.827 (P < .001) was computed in the receiver operating characteristic analysis to differentiate these groups. The Youden index showed an optimal cutoff at 92.0 mg/mL (sensitivity, 0.81; specificity, 0.79; J = 0.60; Table).

A 70-year-old female patient with chronic back pain due to instability in the L4/L5 segment. A, Vertebrae showing a mean converted BMDMDCT of 66.8 mg/mL, diagnosed as osteoporosis according to Felsenberg and Gowin.28 B, Follow-up MDCT of the same patient 9 months later showing signs of screw loosening after spondylodesis in L3 (arrow).
A significant (P < .05) influence of age and follow-up time on BMDMDCT values was found in general linear models for all analyses: A lower BMDMDCT was associated with higher age and shorter follow-up time. While we compared groups with versus without fractures at baseline and follow-up and with versus without screw loosening, there was no significant sex-related influence in linear models (P = .52 at baseline and P = .10 at follow-up, respectively; screw loosening, P = .94).
Discussion
In this study, we have shown that converted BMD values obtained from noncalibrated, lumbar spine MDCT studies (BMDMDCT) cannot only differentiate patients with and without existing osteoporotic fractures at baseline and incidental fractures during follow-up, but also may be used as prognostic markers for screw loosening in patients with spondylodesis. For clinical routine, we have calculated an easy-to-use MDCT-to-qCT conversion equation.
Existing methods for assessment of BMD such as dual-energy x-ray absorptiometry and qCT are well-established and, in most cases, provide reliable information.7,9,10 However, while acquiring data for this study, we have seen that qCT validity highly depends on the technician performing the analysis. In qCT, there is only basic morphologic information provided by the sagittal topogram; therefore, pathologies such as fractures or hemangiomas may not be detected. By contrast, studies have shown that detection of osteoporotic fractures is reliable in sagittal reformations of MDCT scans.21,22 Similar to previous studies, we were able to avoid incorrect measurements by using the sagittal reformations to perform BMD measurements.13,14
In previous studies, it has been demonstrated that routine contrast-enhanced and non-contrast-enhanced abdominal CT as well as cardiac CT scans may be used to determine BMD of the spine.13,14,23⇓⇓–26 We have developed 2 MDCT-to-qCT conversion equations for 120 kVp and 140 kVp tube voltage, respectively, which both show a high correlation coefficient and are comparable with previous studies.13,14
To our knowledge, there were 3 aspects that have been analyzed in this study for the first time: First, we were able to confirm converted BMD values obtained from MDCT scans as prognostic markers for screw loosening in patients with spondylodesis. Second, this study presented conversion equations for 2 different tube voltages, both based on standard lumbar scans without prior application of IV contrast medium. Third, men were included in this study, whereas similar studies were based only on postmenopausal women.13,14 From a neuroradiologist's perspective, these aspects are particularly noteworthy because all patients included in this study were primarily referred by the department of neurosurgery. Those patients routinely undergo MDCT without application of IV contrast medium before surgery. Because operation planning (eg, planning of spondylodesis material) depends on bone structure and condition,15 additional information provided by the method presented may be highly beneficial for patients.
Meredith et al27 recently described preoperative Hounsfield units to be lower in patients with adjacent segment fractures after spinal fusion than in controls without fractures. These findings agree with our results, because we found both original Hounsfield units as well as converted BMDMDCT values able to predict osteoporotic fractures.
In previous studies, Baum et al13,14 described the difficulties of estimating the influence of IV contrast medium on the reproducibility of the method as the major limitation. Because no IV contrast medium was applied to the patients in this study, this limitation is removed. All patients scanned with 140 kVp had received intrathecal contrast medium for myelography. General linear models have shown that there was no significant influence of the contrast medium on the prediction of fractures or screw loosening.
Of note, the presented BMDMDCT cutoff values corresponded well to the standard values described in the literature.28 The cutoff value for prediction of incidental fractures (66.8 mg/mL) was just within the range of BMD values considered as osteoporosis (<80 mg/mL). The cutoff value for the prediction of screw loosening (92.02 mg/mL) was in the lower range of osteopenia (120–80 mg/mL), which is consistent with the finding that in patients with healthy bone, screw loosening very rarely occurs.
The method presented is not associated with additional radiation exposure to patients. Therefore, additional information beneficial for patients may be gathered by using already available data obtained from the examinations performed in daily clinical routine.
As in previous studies,13,14 conversation equations are limited to the CT scanner and the scan protocols used. However, given an adequate comparison group, this method can be transferred to any clinical MDCT scanner. Recently, Budoff et al29 analyzed phantomless BMD measurements performed with 14 different scanner models. The quoted study reported calibration factors comparable with the conversion equation presented in this study to vary significantly across scanner models.
Compared with the short-term reproducibility of qCT (CV, 1.0%–1.5%7), this method had slightly higher intrareader and interreader reproducibility errors (CVs of 2.5% and 2.7%, respectively). However, the reproducibility error was lower than the BMD differences between the investigated groups. Thus, BMDMDCT measurements represent a reliable prognostic marker for incidental osteoporotic vertebral fractures and screw loosening after spondylodesis which, may help for surgical decision-making of whether to extend a spondylodesis or use cement fixation of the screws.
A significant correlation between follow-up time and BMD values obtained from MDCT scans has been found. Our hypothesis is that patients with lower BMD values are at a higher risk for spine diseases in general and therefore are more often examined by radiologists. It is congruent with qCT findings of other investigators that age has a significant influence on BMD values obtained from MDCT scans.30,31
Conclusions
This study presented a reproducible and valid method for obtaining converted BMD values from standard lumbar spine MDCT scans. This method may easily be integrated into clinical routine by using already available standard PACS tools. Converted BMD values cannot only differentiate patients with and without baseline fractures but also predict incidental fractures and screw loosening in patients with spondylodesis. These findings suggest that additional analysis of data obtained from noncalibrated MDCT scans may replace dedicated densitometry measurements in certain settings.
Footnotes
Disclosures: Peter B. Noël—RELATED: Grant: German Federal Ministry of Economics and Technology due to a resolution of the German Parliament (KF2016102AK2).* Jan S. Bauer—RELATED: Grant: German Federal Ministry of Economics and Technology due to a resolution of the German Parliament (KF2016102AK2).* *Money paid to the institution.
This work was supported by the German Federal Ministry of Economics and Technology due to a resolution of the German Parliament (KF2016102AK2).
Paper previously presented in part at: Annual Meeting of the Deutsche Gesellschaft für Neuroradiologie. October 11, 2013; Cologne, Germany.
Indicates open access to non-subscribers at www.ajnr.org
REFERENCES
- Received November 7, 2013.
- Accepted after revision December 26, 2013.
- © 2014 by American Journal of Neuroradiology


