
Abstract
BACKGROUND AND PURPOSE: The role of intracranial hemodynamics in the pathophysiology and risk stratification of brain AVMs remains poorly understood. The purpose of this study was to assess the influence of Spetzler-Martin grade, clinical history, and risk factors on vascular flow and tissue perfusion in cerebral AVMs.
MATERIALS AND METHODS: 4D flow and perfusion MR imaging was performed in 17 patients with AVMs. Peak velocity and blood flow were quantified in AVM feeding and contralateral arteries, draining veins, and the straight sinus. Regional perfusion ratios (CBF, CBV, and MTT) were calculated between affected and nonaffected hemispheres.
RESULTS: Regarding flow parameters, high-grade AVMs (Spetzler-Martin grade of >2) demonstrated significantly increased peak velocity and blood flow in the major feeding arteries (P < .001 and P = .004) and straight sinus (P = .003 and P = .012) and increased venous draining flow (P = .001). The Spetzler-Martin grade significantly correlated with cumulative feeding artery flow (r = 0.85, P < .001) and draining vein flow (r = 0.80, P < .001). Regarding perfusion parameters, perinidal CBF and CBV ratios were significantly lower (P < .001) compared with the remote ratios and correlated negatively with cumulative feeding artery flow (r = −0.60, P = .014 and r = −0.55, P = .026) and draining vein flow (r = −0.60, P = .013 and r = −0.56, P = .025). Multiple regression analysis revealed no significant association of AVM flow or perfusion parameters with clinical presentation (rupture and seizure history) and AVM risk factors.
CONCLUSIONS: Macrovascular flow was significantly associated with increasing Spetzler-Martin grade and correlated with perinidal microvascular perfusion in cerebral AVMs. Future longitudinal studies are needed to evaluate the potential of comprehensive cerebral flow and perfusion MR imaging for AVM risk stratification.
ABBREVIATIONS:
- c
- contralateral hemisphere
- H
- hemisphere excluding the nidus
- i
- ipsilateral hemisphere
- P
- perinidal
- PCA
- posterior cerebral artery
- R
- remote area
- SMG
- Spetzler-Martin grade
Cerebral arteriovenous malformations are associated with an increased risk of intracranial hemorrhage, accounting for 2%–4% of all hemorrhagic strokes annually.1 Previous studies have demonstrated the potential risk of hemorrhage following AVM embolization, presumably due to acute alterations in AVM or cerebral hemodynamics.2 However, the Spetzler-Martin grade (SMG), widely used for surgical risk stratification in cerebral AVMs, does not provide insight into local or global hemodynamics.3 Quantitative assessment of AVM feeding and draining flow, combined with whole-brain tissue perfusion, can potentially characterize both AVM macro- and microvascular pathophysiology. In addition, the relationships between quantitative AVM hemodynamic parameters and the SMG or clinical history (rupture/seizures) and other risk factors (eg, presence of flow-induced aneurysms or venous stenosis, deep AVM location, and single or deep venous drainage) remain unclear.
In this study, a comprehensive MR imaging and analysis protocol based on 4D flow and DSC perfusion MR imaging was applied for the characterization of 3D AVM macrovascular flow and microvascular brain tissue perfusion. 4D flow MR imaging can measure the 3-directional velocity field with full volumetric coverage of the vessels of interest.4,5 Previous studies have shown that 4D flow MR imaging is highly promising in the evaluation of intracranial hemodynamics in cerebral AVMs.6⇓–8 To gain additional information on the impact of AVMs on cerebral tissue perfusion, we used DSC PWI based on a fast spin-echo EPI acquisition during the first pass of contrast agent through the brain vasculature to quantify microvascular perfusion biomarkers.9,10 The AVM nidus has relatively low resistance and thus often causes high-flow transnidal shunts, which may result in hypoperfusion in the cerebral parenchyma immediately adjacent to AVMs. However, this so-called “steal effect” with diversion of blood from the adjacent tissue to the AVM nidus is still controversial, and it is unclear whether it should be considered a mechanism for the clinical presentation of cerebral AVMs.11
The purpose of this study was to quantitatively evaluate macrovascular flow in AVM arterial and venous networks and microvascular perfusion of the peripheral cerebral parenchyma. We investigated relationships between these quantitative hemodynamic parameters and SMG classification followed by correlation with various AVM symptomatic and anatomic risk factors.
Materials and Methods
Patient Population
We studied 17 patients with pretreatment AVMs (7 women; mean age, 39 ± 15 years) who were identified by institutional neuroradiologists/neurosurgeons and referred for MR imaging between May 2011 and March 2013. Demographics and clinical characteristics of the patients with AVMs are summarized in the Table. The SMG of all AVMs was evaluated on the basis of conventional DSA by experienced neuroradiologists, and ranged from 1 to 4 (1, n = 3; 2, n = 6; 3, n = 4; 4, n = 4). Quantitative analysis of macrovascular flow parameters (peak velocities and mean flow) and microvascular perfusion was performed in all patients with AVMs and was correlated with respect to SMG classification, clinical presentation (history of hemorrhagic events, seizures), and other AVM risk factors (deep AVM location, presence of flow-induced aneurysms or venous stenosis, and single or deep venous drainage). The study was approved by the local institutional review board and was conducted in accordance with Health Insurance Portability and Accountability Act guidelines.
Demographics and AVM features of the 17 patients with AVMs included in the study
MR Imaging
All MR imaging measurements were performed on 1.5T (Magnetom Avanto) and 3T (Magnetom Trio) MR imaging scanners (Siemens, Erlangen, Germany) equipped with standard 12-channel head coils. A single dose (4 mL/s, 0.1 mmol/kg bodyweight) of Gd-DTPA contrast agent (Magnevist; Bayer HealthCare Pharmaceuticals, Wayne, New Jersey) was administrated before DSC PWI (spin-echo EPI), followed by a 15-mL saline flush at a rate of 4 mL/s. Imaging parameters for DSC PWI were as follows: TR/TE = 1100/34 ms, FOV = 220 × 220 mm2, spatial resolution = 1.7 × 1.7 × 5.0 mm3, acquisition time = 2 minutes and 30 seconds. 4D flow imaging with 3D volumetric coverage of the AVM vasculature was applied, and data were acquired with prospective electrocardiogram synchronization. Typical sequence parameters for 4D flow MR imaging were the following: TR/TE = 5.2/2.8 ms, flip angle = 15°, velocity sensitivity = 100 cm/s, FOV = 220 × 160 mm2, temporal resolution = 42 ms, spatial resolution = 1.1 × 1.1 × 1.5 mm3, acquisition time = 15–20 minutes depending on the heart rate of the patient during the scan.
4D Flow Data Preprocessing and 3D Blood Flow Visualization
4D flow data were preprocessed by using a customized software programmed in Matlab (MathWorks, Natick, Massachusetts) to filter out background noise and correct for Maxwell terms, eddy current phase offset errors, and velocity aliasing.12 In addition, a 3D phase-contrast MR angiogram was created on the basis of the magnitude and phase difference images. Finally, the preprocessed data were imported into software for 3D blood flow visualization and quantification (EnSight; CEI, Apex, North Carolina). 3D vascular visualization was based on time-resolved 3D pathlines that depict the temporal evolution of blood flow over the cardiac cycle (On-line Videos). Pathlines were emitted from the entire intracranial vasculature provided by the 3D phase-contrast MR angiogram data (total virtual particles = 25,000). The color-coding of the time-integrated traces reflects the velocities of blood traveling along the pathlines during 1 cardiac cycle and illustrates the range and magnitude of blood flow velocities within the cardiac cycle (Fig 1A).
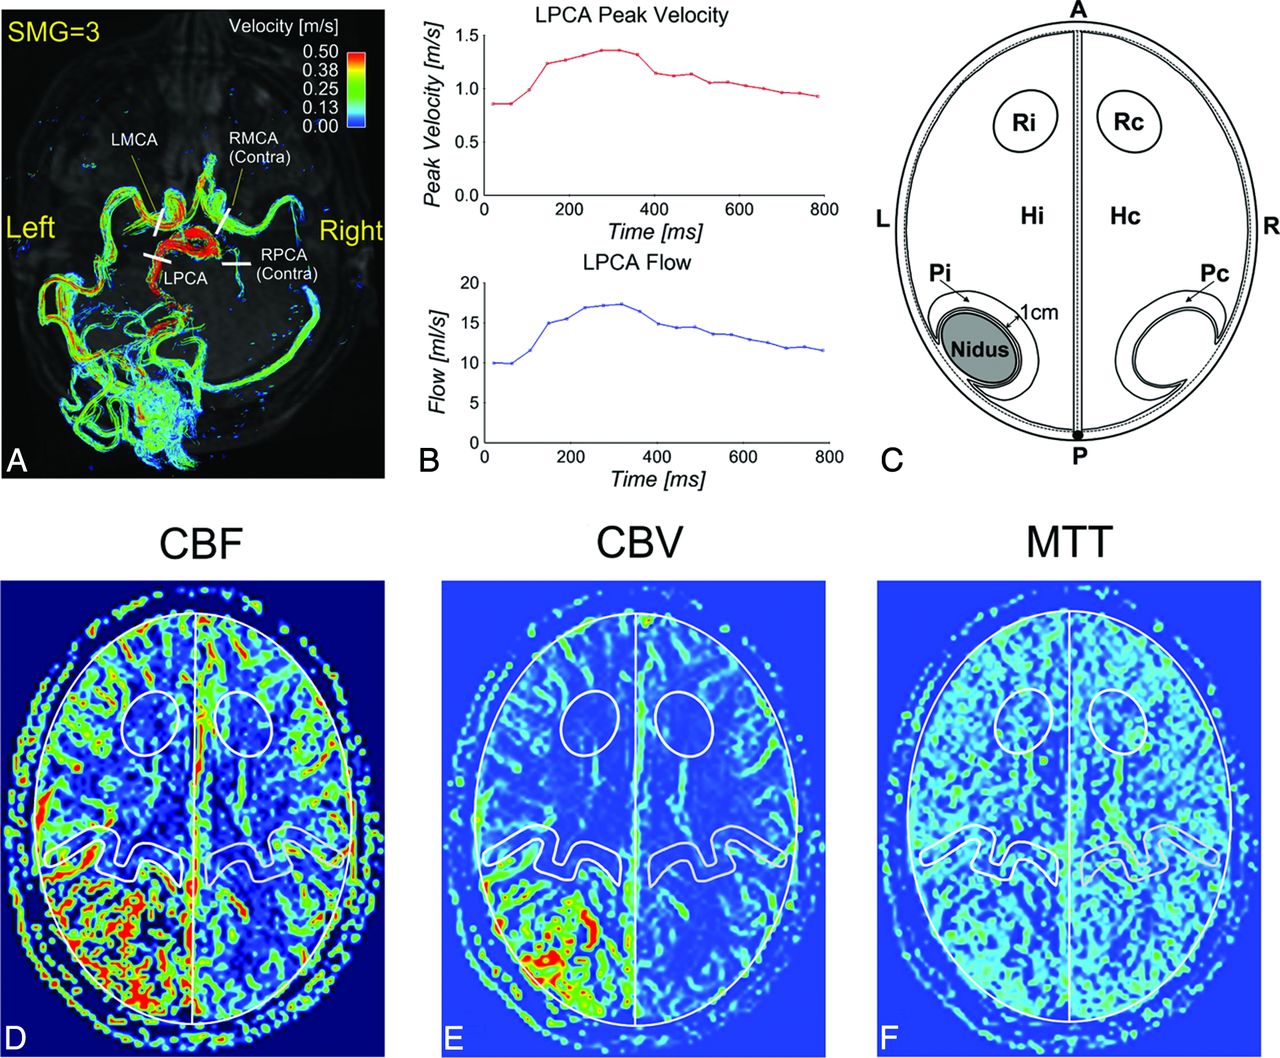
3D blood flow visualization in a left medial occipital AVM (AVM-17) with time-integrated pathlines (A) and quantification of the peak velocity and blood flow in the major feeding arteries (B, example for LPCA) and a perfusion model (C), including 3 pairs of ROIs (Pi/Pc, Hi/Hc, and Ri/Rc) used for perfusion analysis in CBF (D), CBV (E), and MTT (F) images (example for AVM-4). LMCA indicates left MCA; LPCA, left PCA; RMCA, right MCA; RPCA, right PCA; Contra, contralateral artery; Pc, Hc, and Rc, corresponding ROIs in the contralateral hemisphere.
Flow Quantification
For each AVM, 2D analysis planes were manually positioned perpendicularly in all identified feeding and contralateral arteries, draining veins, and the straight sinus by the same observer. The planes were placed consistently across all patients with AVMs (ie, M1 for MCA and P2 for posterior cerebral artery [PCA]) (Fig 1A, example for AVM-17). For each analysis plane, peak velocity (meter/second) and time-averaged blood flow (milliliter/second) over the cardiac cycle were quantified (Fig 1B, for the left PCA).
Tissue Perfusion Quantification
Perfusion maps (CBF, CBV, and MTT) were calculated on-line by using a method described previously, including automatic determination of the arterial input function and deconvolution with the concentration–time curve based on singular value decomposition.9,13 Similar to the model proposed by Guo et al,14 3 pairs of ROIs at the ipsilateral (i) and contralateral (c) hemispheres were defined as follows (Fig 1C): perinidal (P) area for the detection of potential AVM steal (Pi/Pc), hemisphere (H) excluding the nidus for global perfusion evaluation (Hi/Hc), and remote area (R) as an internal control (Ri/Rc). The ROIs were manually delineated by 2 independent observers on a selected CBF map including the largest AVM nidal dimension. ROIs were drawn ipsilateral to the AVM nidus without inclusion of visible vascular territories, and paired contralateral ROIs were automatically created (Fig 1D–F, example for AVM-4). Perinidal ROIs were defined consistently for all patients (ie, 1-cm perimeter adjacent to the nidus). The mean values of the ipsilateral-to-contralateral perfusion ratios from the 2 observations were used for subsequent perfusion analysis. ROI selection and calculation of the perfusion parameters were implemented by using an in-house program in Matlab.
Statistical Analysis
Flow parameters were compared between AVM feeding and contralateral arteries (2-tailed paired t test). Flow parameters in the major feeding arteries, draining veins, and straight sinus were compared between the low-grade (SMG-A: SMG = 1 and 2) and high-grade (SMG-B: SMG = 3 and 4) AVM groups (2-tailed t test). The intraclass correlation coefficient (0.00–0.20, poor; 0.21–0.40, fair; 0.41–0.60, moderate; 0.61–0.80, good; and 0.81–1.00, excellent) was used to evaluate the interobserver agreement for perfusion measurements, and perfusion ratios were compared in the 3 ROIs (2-tailed paired t test). In addition, correlation analysis was performed between the SMG and AVM hemodynamics (Spearman correlation), between the AVM nidal volume calculated by V = π/6 × a × b × c (a, b, c are 3D nidal diameters measured by experienced neuroradiologists on the basis of conventional DSA)15 and AVM hemodynamics (Pearson correlation), and between AVM flow parameters and perfusion ratios (Pearson correlation). Multiple regression analysis (stepwise) was performed to identify the potential association of AVM flow or perfusion parameters with clinical presentation and risk factors. All statistical analyses were performed by using the software package SPSS (IBM, Armonk, New York). P < .05 was considered statistically significant.
Results
4D flow and perfusion MR imaging were successfully acquired in all except for 1 patient (AVM-3) whose perfusion acquisition failed due to a technical error (no injection of contrast agent). Patient demographics including SMG and 33 identified feeding arteries are summarized in the Table. Patients with high-grade AVMs (SMG-B, n = 8) had more feeding arteries (at least 2) compared with patients with low-grade AVMs (SMG-A, n = 9). Of the 17 patients in this study, 7 had seizure history; 3, a previous intracranial hemorrhage; 8, a deep nidal location; 12, a flow-induced aneurysm; 3, a draining venous stenosis; 5, a single draining vein; and 11, a deep venous drainage. Note that 3 patients (AVM-3, AVM-5, and AVM-7) presented with overt hemorrhage, but they were clinically stable during the scans.
Visualization of AVM Flow and Perfusion
Figure 2 shows the 3D phase-contrast MR angiogram (top row) and 3D blood flow visualization (middle row) for 4 representative AVMs with varying SMGs ranging from 1 to 4. Arterial feeding (solid white arrows) and venous draining (open white arrows) patterns of all AVMs can be clearly appreciated. Perfusion images (Fig 2, bottom row) illustrate corresponding microvascular CBF in the brain capillary bed.

Phase-contrast MRA (PC-MRA), time-integrated 3D pathlines, and perfusion (CBF) for 4 patients with AVMs (SMG = 1–4). AVM arterial feeding (solid white arrows) and venous draining patterns (open white arrows) can be clearly appreciated in the PC-MRA and 4D flow pathlines. The draining veins of AVM-17 and AVM-14 are obscured by pathlines and are not shown. 4D flow pathlines also illustrate the distribution of blood flow velocities in the entire brain. Note the flow voids (thin white arrows) within the nidus for AVM-11, AVM-17, and AVM-14 due to high transnidal shunt flow. LPICA indicates left posterior inferior cerebellar artery; LACA, left anterior cerebral artery; DV, draining vein; RTS, right transverse sinus; StrS, straight sinus; SSS, superior sagittal sinus.
Quantitative Arterial and Venous Flow
Twenty AVM feeding and corresponding contralateral artery pairs could be identified. Both peak velocities (1.21 ± 0.39 m/s versus 0.62 ± 0.23 m/s, P < .001) and blood flow (9.06 ± 3.05 mL/s versus 2.99 ± 1.59 mL/s, P < .001) in the AVM feeding arteries were significantly higher compared with the contralateral arteries (Fig 3A, -E). Additionally, major feeding artery peak velocities (Fig 3B) and blood flow (Fig 3F) for the SMG-B group were significantly increased compared with the SMG-A group (1.57 ± 0.33 m/s versus 0.89 ± 0.26 m/s, P < .001, and 12.31 ± 2.60 mL/s versus 7.68 ± 2.99 mL/s, P = .004), indicating elevated feeding artery flow in high-grade AVMs. For draining veins, the high-grade AVM group demonstrated significantly higher blood flow (17.54 ± 8.47 mL/s versus 5.24 ± 1.57 mL/s, P = .001, Fig 3G). Differences in peak velocities (0.67 ± 0.27 m/s versus 0.30 ± 0.07 m/s, P = .003) and blood flow (6.34 ± 4.87 m/s versus 1.71 ± 0.37 m/s, P = .012) were also found in the straight sinus (Fig 3D, -H).

Distribution of peak velocities and blood flow in the AVM feeding (Feeders) and corresponding normal contralateral arteries (Contra) (A and E), as well as in the major feeding arteries (B and F), draining veins (C and G), and the straight sinus (D and H) for the low (SMG-A) and high (SMG-B) grade AVM groups. The feeding arteries had significantly higher peak velocity and blood flow compared with the normal contralateral arteries. The high-grade AVM group (SMG-B) had significantly higher peak velocity and blood flow in the major feeding arteries and the straight sinus and significantly higher blood flow in the draining veins compared with the low-grade group (SMG-A). The asterisk indicates significant difference with P < .05; NS, not significant.
Microvascular Perfusion Ratios
Interobserver agreement for the perfusion measurement was good to excellent (CBF: intraclass correlation coefficient = 0.78; CBV: intraclass correlation coefficient = 0.86; MTT: intraclass correlation coefficient = 0.76). A significantly lower perinidal CBF ratio was identified compared with the remote ratio (0.85 ± 0.12 versus 0.99 ± 0.07, P < .001) in agreement with the lower perinidal CBV ratio compared with the remote ratio (0.83 ± 0.13 versus 1.00 ± 0.08, P < .001), indicating the presence of perinidal hypoperfusion (AVM steal) (Fig 4A). However, perinidal and remote MTT ratios were not significantly different (0.98 ± 0.09 versus 1.03 ± 0.10, P = .110). In addition, no significant difference was observed between remote and hemispheric perfusion ratios (CBF: P = .231, CBV: P = .481, and MTT: P = .635). Perfusion ratios were also not significantly different between low- and high-grade AVM subgroups (Fig 4B–D).
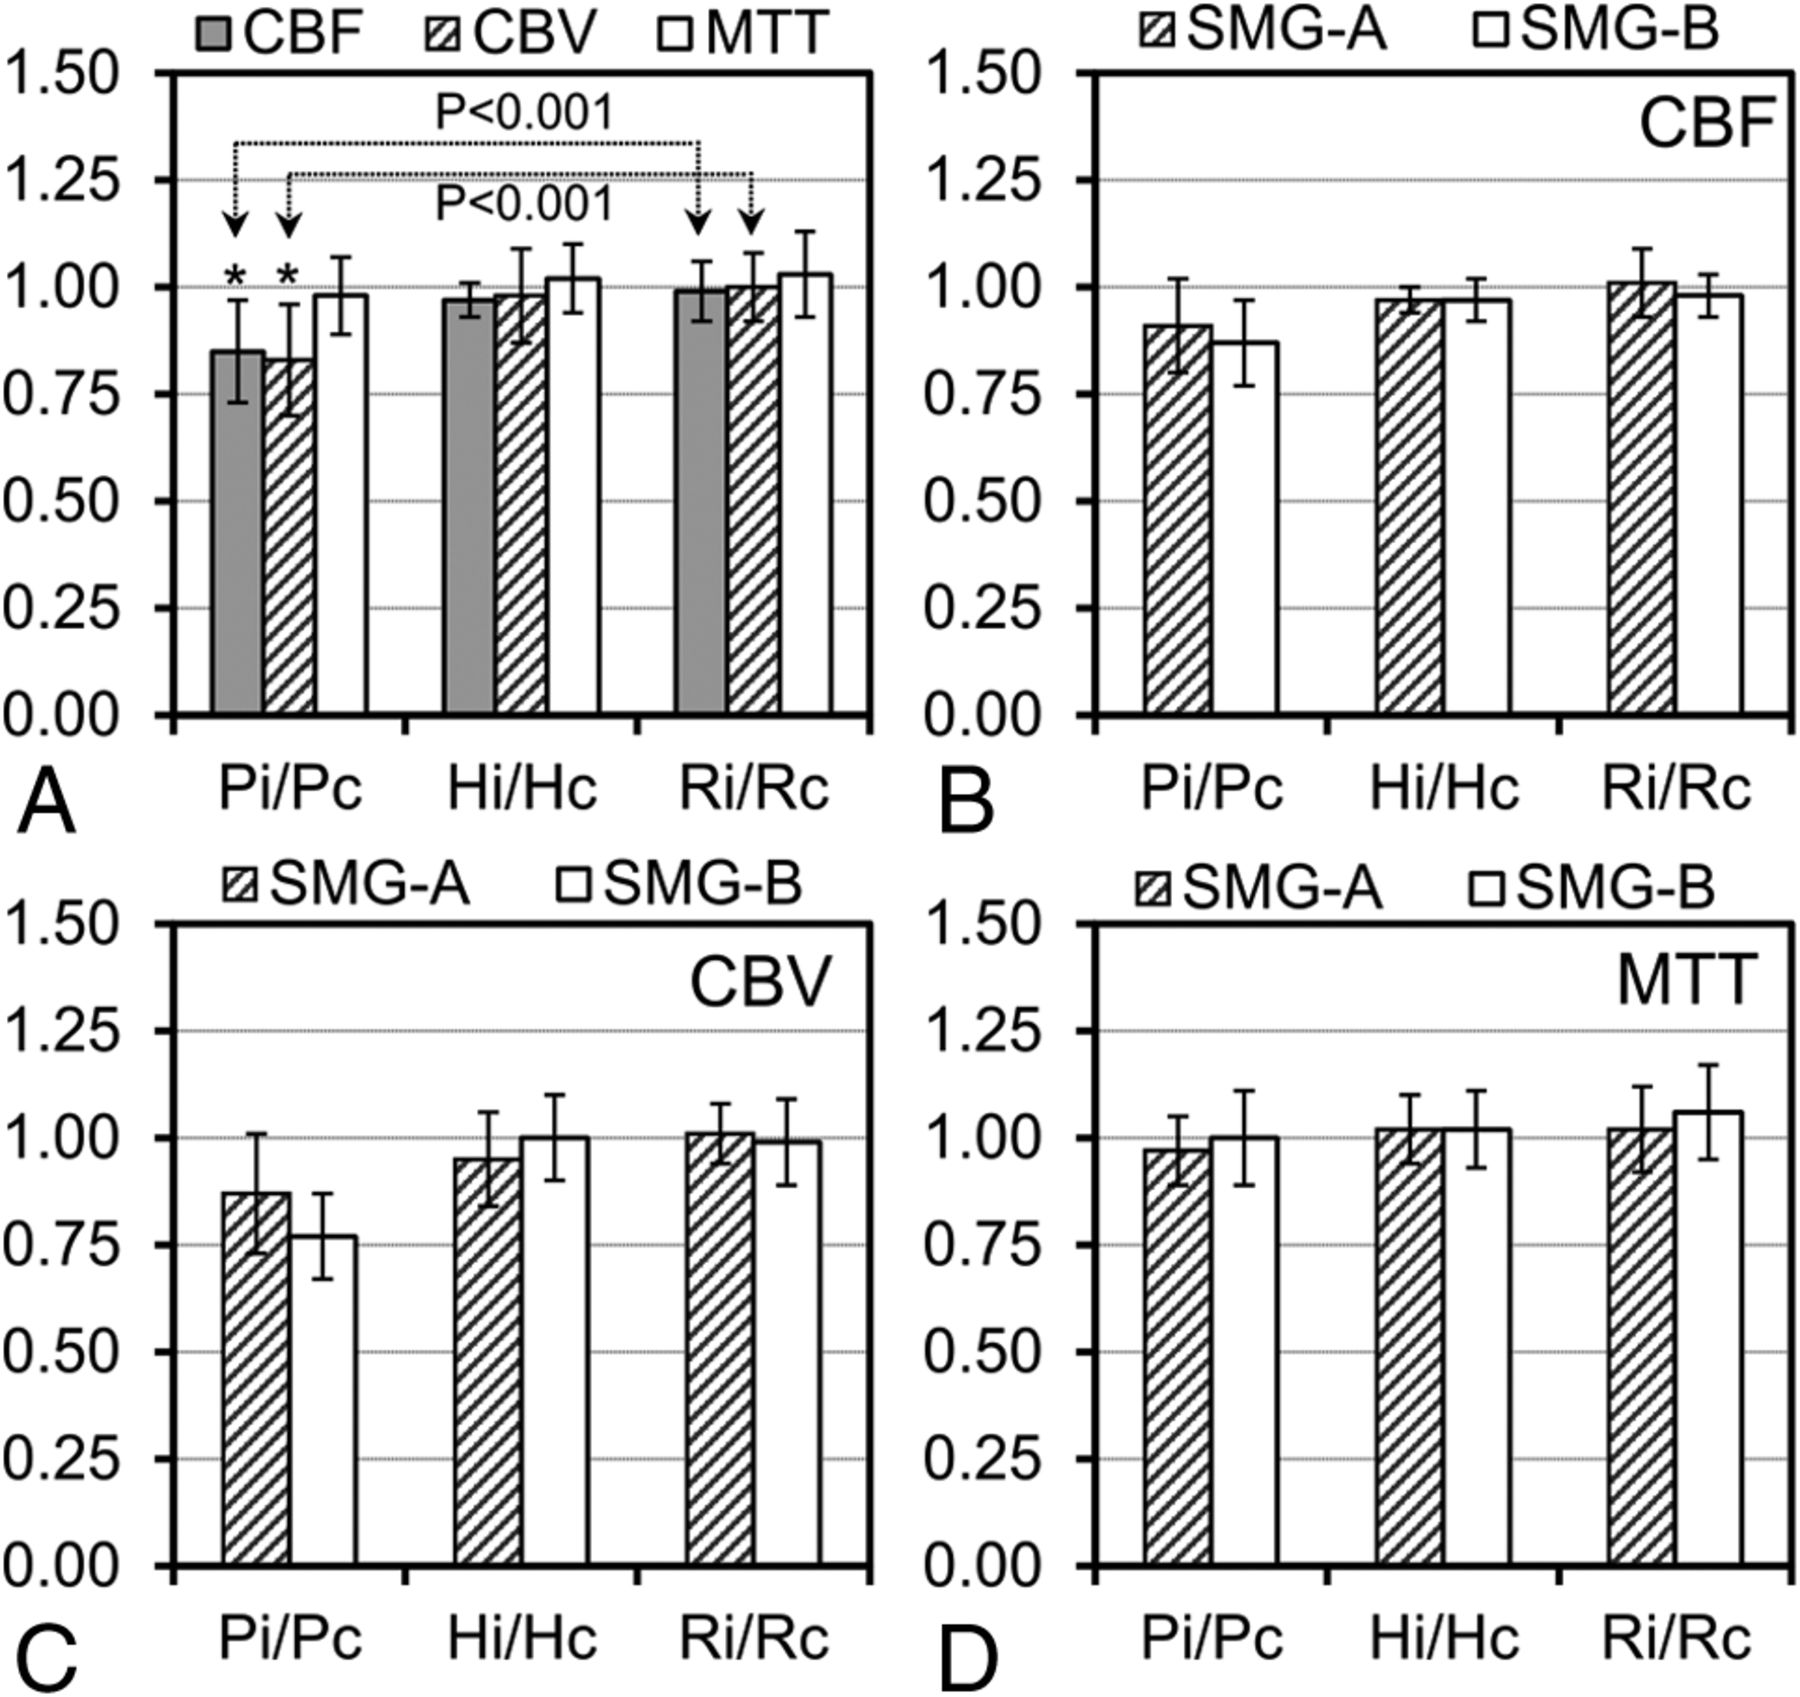
Ipsilateral-to-contralateral perfusion ratios (CBF, CBV, and MTT ratios) in the 3 pairs of ROIs (Pi/Pc, Hi/Hc, and Ri/Rc) for 16 AVMs (A) and perfusion ratios in the low (SMG-A, n = 9) and high (SMG-B, n = 7) grade AVM groups for CBF (B), CBV (C), and MTT (D). The asterisk indicates a significant difference between perinidal (Pi/Pc) and remote (Ri/Rc) perfusion ratios.
Relationships among SMG, Nidal Volume, Arterial and Venous Flow, and Perfusion Ratios
Strong and significant relationships were observed between SMG and maximum peak velocities in the feeding arteries (r = 0.78, P < .001), cumulative blood flow in all feeding arteries (r = 0.85, P < .001), and blood flow in the major draining vein (r = 0.80, P < .001) and in the straight sinus (r = 0.67, P = .003). Further analysis revealed significant relationships of AVM nidal volume with cumulative blood flow in all feeding arteries (r = 0.82, P < .001) and draining veins (r = 0.66, P = .004). Moreover, the perinidal CBF ratio correlated negatively with cumulative feeding artery flow (r = −0.60, P = .014) and draining vein flow (r = −0.60, P = .013). A similar negative correlation was observed between the perinidal CBV ratio and cumulative flow in the feeding arteries (r = −0.55, P = .026) and draining veins (r = −0.56, P = .025).
Relationship between AVM Hemodynamics and Risk Factors
Multiple regression analysis revealed no significant association of AVM vascular flow or perfusion parameters with clinical presentation (rupture and seizure history) and AVM risk factors (deep AVM location, presence of flow-induced aneurysms or venous stenosis, and single or deep venous drainage).
Discussion
The results of this study demonstrate the potential of 4D flow and DSC perfusion MR imaging for the comprehensive evaluation of macro- and microvascular hemodynamics in cerebral AVMs. 4D flow MR imaging provided 3D visualization of complex AVM arterial feeding and venous draining patterns and offered quantitative flow characterization of large intracranial AVM vessels. DSC PWI was used to characterize the relative differences in microvascular perfusion parameters. Our findings demonstrate the association of the SMG classification with flow parameters and also reveal significant relationships between macrovascular flow and perinidal tissue perfusion but indicate no significant association of AVM flow or perfusion parameters with symptomatic and anatomic risk factors.
Cerebral AVMs are highly heterogeneous and complex lesions that preclude standardized clinical protocols and uniform paradigms for risk stratification and treatment planning. Initial results from A Randomized trial of Unruptured Brain Arteriovenous malformations (ARUBA) have questioned the benefit-to-risk ratio of interventional therapy versus medical management in unruptured AVMs.16 Previous studies indicated that perinidal tissue perfusion and flow dynamics in the AVM feeding and draining systems play an important role in assessing the intra- and postoperative hemorrhagic risk.17,18 Hence, patient- and AVM-specific risk stratification with individualized AVM hemodynamic evaluation may be an increasingly important analysis required to demonstrate a benefit of embolization or surgical treatment in high-risk AVMs.
A growing number of AVM risk factors have been demonstrated to be associated with increased risk of future hemorrhage, such as prior intracranial hemorrhage,1,19 a single draining vein,19 flow-induced aneurysms,20 and deep location.1,21 However, the mechanisms of how these factors confer increased hemorrhagic risk remain unclear, with a paucity of data on the role of quantitative AVM hemodynamics. Illies et al22 reported that a previous intracranial hemorrhage was the only risk factor associated with a significant increase of the relative transit time. In our study, we observed no direct connection between AVM hemodynamic parameters and a history of intracranial hemorrhage based on a relatively small sample size. In addition, our findings revealed no significant association of AVM flow or perfusion parameters with seizure history and other anatomic risk factors.
An early 4D flow study by Chang et al7 identified significantly higher time-averaged flow and velocity in the ipsilateral arteries compared with normal contralateral vessels. Similar to their findings, our results demonstrate significantly higher peak velocity and blood flow in the feeding arteries compared with normal contralateral arteries. In addition, our results demonstrate that the SMG directly correlates with arterial flow parameters: The major feeding arteries in high-grade AVMs had significantly higher peak velocities and blood flow in comparison with low-grade AVMs. In addition to SMG, correlations were also identified between AVM nidal volume and cumulative arterial/venous blood flow, indicating that nidal size in the SMG grading system is presumably the dominating factor responsible for different AVM hemodynamics.
A subset of the patients enrolled in this study (AVM 1–14) have been included in a previously reported pilot 4D flow MR imaging study.6 The present study included additional recruited patients, refined flow-quantification analysis, and a combination with DSC perfusion MR imaging that was not described in the previous study. In the previous study, a direct relationship between SMG and increased blood flow velocities was found only for draining veins by visual grading of time-integrated pathlines on a 3-point scale (0: <0.25 m/s, 1: <0.5 m/s, 2: >0.5 m/s).6 Reanalysis of these data by using regional flow quantification as used in this study demonstrated the following arterial feeding and venous draining peak velocities in 3 SMG groups: SMG = 1 (0.68 ± 0.29 m/s; 0.32 ± 0.13 m/s), SMG = 2 (0.79 ± 0.23 m/s; 0.38 ± 0.16 m/s), and SMG > 3 (0.97 ± 0.54 m/s; 0.50 ± 0.24 m/s). In comparison, the previously used visual velocity grading resulted in SMG = 1 (1.7 ± 0.6; 0.6 ± 0.6), SMG = 2 (1.4 ± 0.5; 0.8 ± 0.8), and SMG > 3 (1.6 ± 0.5; 1.2 ± 0.6). These results indicate that visual grading analysis agreed with quantitative measures for venous velocities but resulted in lower arterial velocities in group SMG = 2 compared with group SMG = 1. In contrast, quantitative analysis showed consistently increased arterial velocities with increasing SMG. The discrepancy may be caused by a different magnitude of velocities in the arterial (0.88 ± 0.44 m/s) and venous (0.43 ± 0.21 m/s) systems. The previously used visual grading method may thus not have allowed accurate arterial velocity measurement for arterial velocities of >0.5 m/s.
Fast arterial-to-venous blood flow velocities in cerebral AVMs present a great challenge for the quantification of arteriovenous shunting with conventional imaging techniques. It is problematic to quantify arteriovenous shunting simply on the basis of absolute arterial or venous blood flow velocities without consideration of the complex and heterogeneous nidal vascular network. DSA, time-resolved contrast-enhanced MRA, and arterial spin-labeled MR imaging have been shown to provide improved quantification of arteriovenous shunting measured with venous arrival time or arterial-to-venous transit time.15,23,24
A previous DSC PWI study demonstrated AVM steal based on significantly higher Hi/Hc ratios of CBF and CBV in 19 patients with AVMs in comparison with healthy subjects.14 Fiehler et al25 reported decreased perfusion ratios between affected and nonaffected hemispheres in the MCA and PCA territories accounting for AVM steal. In our study, there were significantly lower perinidal CBF and CBV ratios compared with the remote ratios indicating presence of perinidal hypoperfusion (“AVM steal”). Our perfusion imaging findings were not affected if the 2 ruptured AVMs (AVM-5 and AVM-7) were excluded from the analysis. Flow voids were observed within a high-flow AVM nidus (Fig 2, thin white arrows) due to spin-echo PWI. The signal voids may be alleviated by increasing section thickness and shortening the TR.
A major limitation of this study is the small number of patients with AVMs (n = 17), which underlines the relatively rare pathology of cerebral AVMs. Nevertheless, to our knowledge, this is the largest cohort to date for quantitative evaluation of flow parameters in both AVM arterial and venous systems as well as microvascular brain tissue perfusion. Future studies with larger patient cohorts and healthy control groups are warranted to increase the statistical power and further clarify the relevance of macrovascular flow and microvascular tissue perfusion in cerebral AVMs.
Another limitation related to 4D flow MR imaging is its inability to capture the wide range of velocities in cerebral AVMs (ie, fast feeding artery flow versus slow venous flow). Dual velocity encoding is promising to improve the velocity-to-noise ratio for vascular flow quantification.26 In addition, small vessels (eg, feeding arteries and draining veins with diameters of <3 mm) were difficult to visualize and quantify with the current 4D flow technique due to limited spatial resolution, which may be improved by advanced imaging accelerating techniques to increase spatial resolution while keeping total scan times at acceptable levels.27 Moreover, the AVMs included in this study had a different number of feeding and draining vessels, which may bias the statistical results for the peak velocities and blood flow.
The perfusion method used in this study has been successfully applied in the evaluation of brain tumor,10 but it was only validated against the reference standard (PET) for gradient-echo PWI.28 In addition, a wide variability in contralateral white matter CBF values was reported in the presence of vascular pathology.29 Thus, we were cautious to use the values in our study as quantitative perfusion measurement in cerebral AVMs without further validation. Instead, the relative perfusion ratios between the affected and nonaffected hemispheres were calculated to characterize the potential perfusion disturbance. Moreover, although a single section with the largest nidal dimension was considered to represent the most significant hemodynamics in cerebral AVMs,14 3D assessment of brain tissue perfusion would provide better characterization of microvascular hemodynamic disturbance in cerebral AVMs.22
Conclusions
4D flow and DSC perfusion MR imaging enabled quantitative hemodynamic assessment of cerebral AVMs in both AVM arterial feeding and venous drainage systems as well as the capillary microperfusion of peripheral brain tissue. Our results demonstrate the association of SMG with AVM arterial and venous flow as well as significant relationships between macrovascular flow and changes in cerebral perfusion parameters. Future studies in larger patient cohorts including longitudinal follow-up are needed to evaluate the potential of comprehensive MR imaging for the assessment of both cerebral flow and perfusion for improved AVM risk stratification.
Footnotes
Disclosures: Can Wu—RELATED: Grant: American Heart Association,* Comments: American Heart Association Predoctoral Fellowship 14PRE18370014. Bernard R. Bendok—RELATED: Grant: MicroVention (research grant).* James Carr—UNRELATED: Consultancy: Guerbet; Grants/Grants Pending: Bayer,* Astellas,* Siemens*; Payment for Lectures (including service on Speakers Bureaus): Siemens. *Money paid to the institution.
This work was supported by an American Heart Association Predoctoral Fellowship 14PRE18370014, National Institutes of Health–T32-EB005170, National Institutes of Health–R01-HL088437, and Radiological Society of North America Research Seed Grant/Toshiba America Systems RSD1207.
Indicates open access to non-subscribers at www.ajnr.org
References
- Received August 5, 2014.
- Accepted after revision December 11, 2014.
- © 2015 by American Journal of Neuroradiology


Jump to section
Related Articles
Cited By...
- Hemodynamic Analysis of Cerebral AVMs with 3D Phase-Contrast MR Imaging
- How Flow Reduction Influences the Intracranial Aneurysm Occlusion: A Prospective 4D Phase-Contrast MRI Study
- In-room assessment of intravascular velocity from time-resolved rotational angiography in patients with arteriovenous malformation: a pilot study
- In Vivo Assessment of the Impact of Regional Intracranial Atherosclerotic Lesions on Brain Arterial 3D Hemodynamics
- Age-Related Changes of Normal Cerebral and Cardiac Blood Flow in Children and Adults Aged 7 Months to 61 Years