
Abstract
BACKGROUND AND PURPOSE: In postmortem studies, subclinical optic nerve demyelination is very common in patients with MS but radiologic demonstration is difficult and mainly based on STIR T2WI. Our aim was to evaluate 3D double inversion recovery MR imaging for the detection of subclinical demyelinating lesions within optic nerve segments.
MATERIALS AND METHODS: The signal intensities in 4 different optic nerve segments (ie, retrobulbar, canalicular, prechiasmatic, and chiasm) were evaluated on 3D double inversion recovery MR imaging in 95 patients with MS without visual symptoms within the past 3 years and in 50 patients without optic nerve pathology. We compared the signal intensities with those of the adjacent lateral rectus muscle. The evaluation was performed by a student group and an expert neuroradiologist. Statistical evaluation (the Cohen κ test) was performed.
RESULTS: On the 3D double inversion recovery sequence, optic nerve segments in the comparison group were all hypointense, and an isointense nerve sheath surrounded the retrobulbar nerve segment. At least 1 optic nerve segment was isointense or hyperintense in 68 patients (72%) in the group with MS on the basis of the results of the expert neuroradiologist. Student raters were able to correctly identify optic nerve hypersignal in 97%.
CONCLUSIONS: A hypersignal in at least 1 optic nerve segment on the 3D double inversion recovery sequence compared with hyposignal in optic nerve segments in the comparison group was very common in visually asymptomatic patients with MS. The signal-intensity rating of optic nerve segments could also be performed by inexperienced student readers.
ABBREVIATION:
- DIR
- double inversion recovery
MR imaging contributes to not only the diagnosis and differential diagnosis of MS but also the monitoring and follow-up of patients.1 T1-weighted postcontrast, T2-weighted, proton-density, FLAIR, and double inversion recovery (DIR) images are recommended to detect acute and chronic demyelinating lesions in typical locations.1⇓⇓⇓⇓⇓⇓⇓–9
Acute optic neuritis is an inflammatory demyelination of the optic nerve causing acute visual loss.10⇓⇓–13 After recovery, patients are often visually asymptomatic, but careful visual testing by visually evoked potentials, optical coherence tomography, and visual disability evaluation may reveal persistent slight visual deficits.14⇓⇓–17 These deficits are also observed in patients without any history of previous acute optic neuritis due to a suspected subclinical disease known as subclinical optic nerve demyelination.14⇓⇓–17
Acute optic neuritis is easily diagnosed on MR imaging by focal nerve swelling and segmental T2-weighted hyperintensity, especially on STIR images or on fat-suppressed T2-weighted images and by segmental gadolinium enhancement on T1-weighted fat-suppressed images.10,18⇓⇓⇓–22 The enhancement is present for a mean of 30 days after the onset of visual symptoms.21,23⇓⇓⇓⇓⇓⇓⇓–31
Subclinical optic nerve demyelination, however, is not easily visible on MR imaging. Routine T2-weighted images without fat suppression and contrast-enhanced T1-weighted FSE images do not show any signal abnormality in the affected optic nerve. Fat-suppressed T2-weighted FSE images, especially STIR T2-weighted images, may detect a signal-intensity abnormality in subclinical optic nerve demyelination.23,32,33 The highly diagnostic value of fat-suppressed FLAIR images and fat-suppressed 3D DIR images in the detection of any pathologic signal intensity in the optic nerve has been evaluated in acute optic nerve demyelination.10,34,35 In a few patients with subclinical optic nerve demyelination, signal-intensity abnormalities have been reported on 3D FLAIR.34 However, there are few data about the use of the 3D DIR sequence in the evaluation of subclinical optic nerve demyelination.36
In our department, patients with MS are routinely and regularly monitored for disease progression by a standard protocol with 3D FLAIR, 3D DIR, T2-weighted FSE, and 3D T1-weighted postcontrast images. 3D DIR is added to our standard protocol for improved detection of juxtacortical, cortical, and infratentorial demyelinating lesions.1⇓⇓⇓⇓⇓⇓⇓–9 On the basis of postmortem and clinical studies having already shown a high percentage of subclinical optic nerve demyelination with ongoing axonal loss in patients with MS,37⇓⇓⇓–41 we wanted to test 2 hypotheses: first, that it is possible to detect signal-intensity changes in optic nerve segments on the 3D DIR sequence without the additional application of a STIR T2-weighted sequence over the orbits in patients with MS without a history of clinically obvious visual loss and without a history of acute optic neuritis during the previous 3 years; and second, that the signal-intensity changes on 3D DIR are so obvious that even inexperienced readers can detect them. This second hypothesis is important because in our department, MR imaging examinations of patients with MS are evaluated not only by trained neuroradiologists but also general radiologists. Therefore, it is desirable that the lack of neuroradiologic experience be compensated by the application of an easily readable MR image, and the 3D DIR sequence is routinely acquired in our department for the follow-up of patients with MS.
For comparison, the signal intensities of normal healthy optic nerve segments in patients evaluated by the identical 3D DIR sequence for different diseases (ie, epileptic seizures and posttraumatic sequelae) were analyzed as well.
Materials and Methods
From November 2012 to September 2016, cerebral 3D DIR images were obtained on a 3T MR imaging unit, Achieva (Philips Healthcare, Best, the Netherlands), in both a comparison group and the group of patients with MS.
The comparison group consisted of 50 patients (30 females, 20 males; mean age, 42.5 years; range, 13–78 years) evaluated for epileptic seizures or posttraumatic sequelae after head trauma without any known optic nerve pathology.
The group of patients with MS comprised 95 patients (68 females and 27 males; mean age, 44.5 years; range, 16–77 years) without clinically obvious visual loss and without any history of previous optic neuritis during the past 3 years. The diagnosis of MS had been present in these patients for a mean of 8.9 years (range, 4.2–26.7 years). Clinical data were obtained with our hospital information system.
In all patients, the 3D DIR sequence was acquired in the sagittal plane. The parameters of this sequence are presented in Table 1. Coronal reconstructions with 2-mm section thickness and 2-mm increments were performed parallel to the long axis of the brain stem covering the orbits and the whole brain.
Imaging parameters of the 3D DIR sequence
The optic nerve is divided into 4 segments (ie, the retrobulbar segment within the orbit, the canalicular segment as the nerve passes through the bony optic canal, the prechiasmatic segment within the suprasellar cistern, and the chiasm). Both prechiasmatic segments join at the optic chiasm.23,42 The term optic system comprises all optic nerve segments.
The evaluation of the signal intensity of the optic nerve segments in both the comparison group and the group of patients with MS was by visual inspection. First, a bilateral analysis of the signal intensity of the 4 optic nerve segments on 3D DIR was performed in the asymptomatic comparison group. Second, the signal intensity of the 4 optic nerve segments on 3D DIR in the group of patients with MS was evaluated.
The signal intensity was separately evaluated for the left and the right optic nerves and for the optic nerve sheath. In the comparison group, 100 retrobulbar, 100 canalicular, and 100 prechiasmatic nerve segments and 50 chiasms were evaluated. In the group of patients with MS, 190 retrobulbar, 190 intracanalicular, and 190 prechiasmatic nerve segments and 95 chiasms were analyzed. The signal intensity of the optic nerve segments and of the optic nerve sheath was rated as hypointense, isointense, or hyperintense compared with the signal intensity of the directly adjacent lateral rectus muscle, thus allowing an easy comparison.
The signal intensity was jointly evaluated by a group of 2 students (T.S. and E.S.) inexperienced in the evaluation of MR images and by an expert neuroradiologist with 23 years of experience (S.S.-S.). The 2 students had been previously instructed and trained by the expert neuroradiologist by jointly performing correct signal-intensity ratings in 15 randomly chosen MR imaging examinations not included in this study.
The level of the interobserver agreement for the detection of signal abnormalities, considering the different nerve segments, was determined on the basis of the Cohen κ test, and the results are shown in Tables 2 and 3. The κ values were interpreted as follows10: A κ value of zero indicated poor agreement; a κ value of 0.01–0.20, minor agreement; a κ value of 0.21–0.40, fair agreement; a κ value of 0.41–0.60, moderate agreement; a κ value of 0.61–0.80, good agreement; and a κ value of 0.81–1, excellent agreement. Comparisons of κ values were performed to determine whether the agreements were different for the evaluation of optic nerve signal abnormality.
κ values and their confidence intervals for 3D DIR, based on nerve segments in the group of patients with MS
κ values and their confidence intervals for 3D DIR, in the group of patients with MS in all 665 nerve segments combined
This retrospective study with the number Basec 2016–01396 was approved by the institutional review board Kantonale Ethikkommision Zürich on September 26, 2016, without additional informed consent. This article did not receive any grant support and has not been presented at any meetings.
Results
Interobserver Agreement
The agreement was excellent in the assessment of the signal intensity of the optic nerve segments on 3D DIR for the comparison group. No interobserver difference was seen. All nerve segments in the comparison group were deemed hypointense for all subjects by the expert reader and the student group.
In the patients with MS group, on 3D DIR, the signal intensity in 6 retrobulbar (3%) and 12 prechiasmatic segments (6%) and 1 chiasm (0.5%) was rated differently by the student group and the expert reader. The final rating of the signal intensity on 3D DIR was defined according to the rating of the expert neuroradiologist. A correct rating of the signal intensity of the different nerve segments on 3D DIR was performed in 97% of all 665 nerve segments by the student reader group.
The level of the interobserver agreement for the detection of signal abnormalities considering the different nerve segments was determined on the basis of the Cohen κ test (Tables 2 and 3).
Statistical evaluation yielded an excellent interobserver agreement in the comparison group and in the group of patients with MS, for all κ values were >0.8 (Tables 2 and 3). The 95% confidence interval with a value of 0.901–0.961 for all nerve segments together proved the very good interobserver agreement.
Signal Intensity in Different Optic Nerve Segments in the Comparison Group
In the comparison group, 100 retrobulbar, 100 canalicular, 100 prechiasmatic, and 50 chiasmatic nerve segments were hypointense on 3D DIR (Fig 1). No isointense or hyperintense nerve signal was observed. The optic nerve sheath was seen as an isointense rim surrounding the hypointense retrobulbar optic nerve (Fig 1A). Small hyperintense artifacts were present at the air-bone interface in 57% of the examinations, both in the comparison group (Fig 2) and in the patients with MS group.
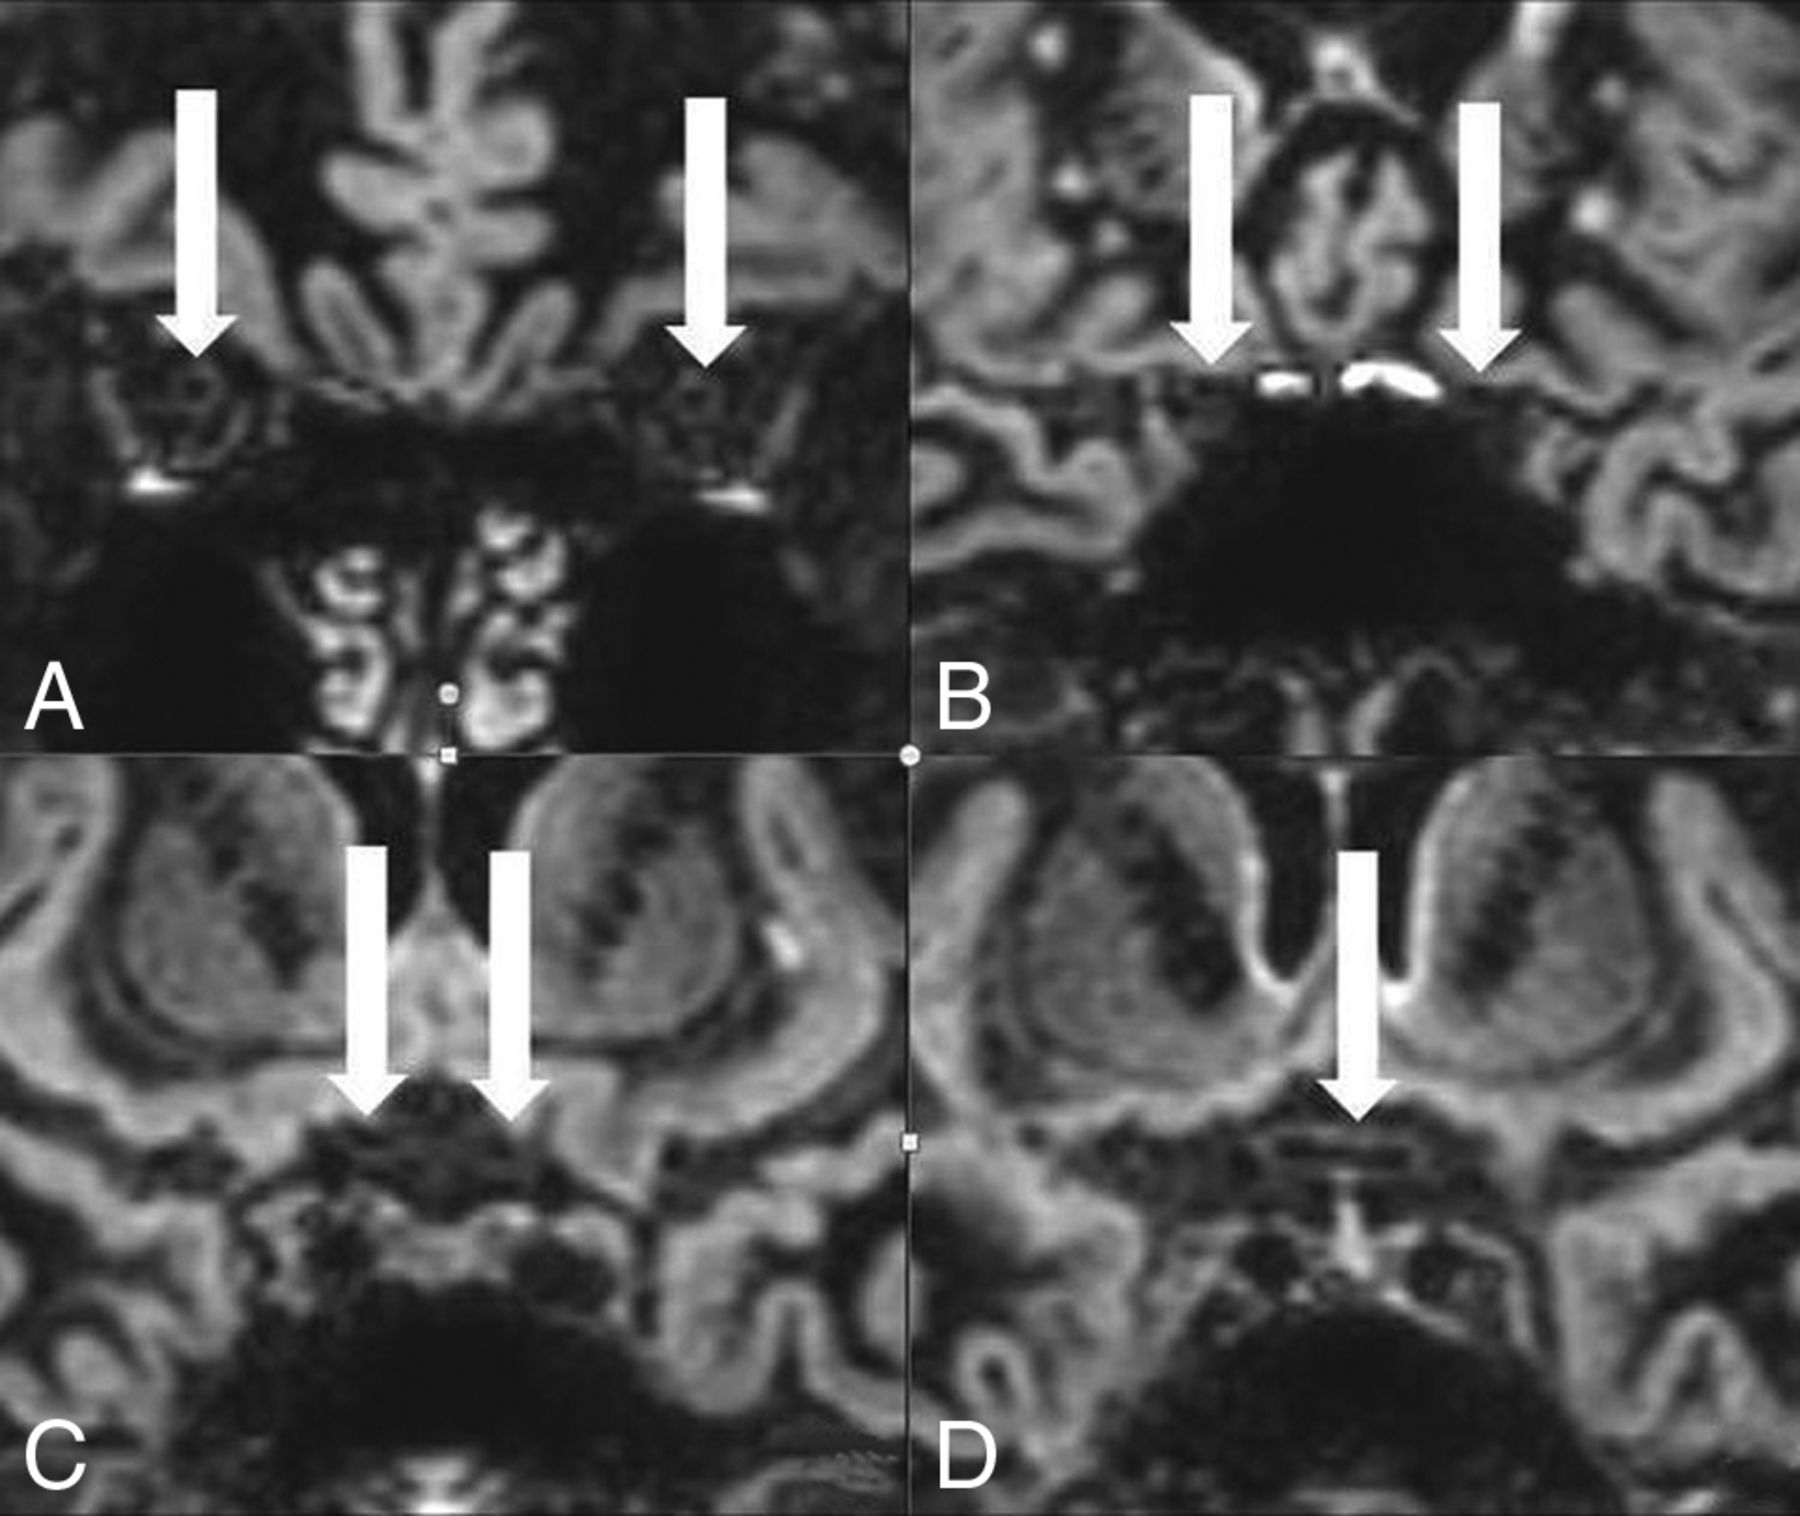
On 3D DIR, bilaterally normal hypointense retrobulbar (A), canalicular (B), and prechiasmatic (C) optic nerve segments and a normal hypointense chiasm (D). The normal nerve segments are marked with white arrows. The normal hypointense retrobulbar optic nerve is surrounded by an isointense nerve sheath on 3D DIR (A).

Hyperintense susceptibility artifacts (white arrowheads) at the air-bone interface next to the canalicular nerve segments (A) and next to the prechiasmatic nerve segments (B). Optic nerve segments are marked with white arrows.
Signal Intensity in Different Optic Nerve Segments in the Patients with MS Group
The results of the signal-intensity rating of the different nerve segments are depicted in Table 4.
Signal intensity of optic nerve segments evaluated on 3D DIR in patients with MS
On 3D DIR, 27 (28%) of the patients with MS presented with a hypointense optic system without any pathologic signal-intensity increase. However, 68 (72%) of the patients with MS presented with an isointense or hyperintense optic nerve signal in at least 1 optic nerve segment on 3D DIR (Fig 3).

On 3D DIR, bilateral normal hypointense retrobulbar nerve segments (A) are compared with bilateral pathologic hyperintense retrobulbar nerve segments (B), with a unilateral pathologic hyperintense retrobulbar nerve segment on the left side (C) and a unilateral pathologic hyperintense canalicular nerve segment on the right side (D) in 3 different asymptomatic patients with MS. The hyperintense optic nerve segments are marked with white arrows. The normal hypointense optic nerve segments are marked with white arrowheads.
Discussion
The optic system comprises 4 different optic nerve segments, namely the retrobulbar, canalicular, and prechiasmatic segments and the chiasm.23,42 An analysis of the signal intensity of the different optic nerve segments in a comparison group without any known optic nerve pathology showed that these 4 optic nerve segments presented with hypointensity on 3D DIR compared with the signal intensity of the directly adjacent lateral rectus muscle. This finding allowed us to define optic nerve segments in patients in the comparison group as hypointense on 3D DIR. A meningeal sheath that presented as an isointense circular rim around the hypointense optic nerve on 3D DIR surrounded the retrobulbar optic nerve segment.42
The signal-intensity rating of the different optic nerve segments could be easily performed by visual inspection by both inexperienced readers and expert readers, leading to very good interoberserver reliability in our study. The inexperienced student readers were able to perform a correct rating of the signal intensity of the different nerve segments on 3D DIR in 97% of all nerve segments based on a κ value of >0.8 in the Cohen κ interobserver agreement test. Therefore, the 3D DIR sequence allows recognizing signal intensity changes in optic nerve segments even if the reader is not an experienced neuroradiologist. Differences in the signal-intensity rating between the student group and the expert reader could be explained by 2 possibilities: First, hyperintense susceptibility artifacts at the skull base common on 3D DIR were present in 57% of all examinations (in both the comparison group and the group of patients with MS) in various intensities and obscured the correct identification of 12 prechiasmatic nerve segments and 1 chiasm for the student readers and prevented accurate signal-intensity analysis of these nerve segments on 3D DIR for the unexperienced readers.10 No artifacts were observed along the retrobulbar and the canalicular nerve segments on 3D DIR.
Second, a prominent isointense optic nerve sheath masked the central hypointense optic nerve segment on 3D DIR and was therefore confused with increased signal intensity of the retrobulbar optic nerve itself in 6 retrobulbar nerve segments, leading to an incorrect pathologic signal-intensity rating in the student reader group.
Acute optic neuritis is easily diagnosed by contrast enhancement on T1-weighted fat-suppressed images and T2-weighted hyperintensity on fat-suppressed T2-weighted FSE images and FLAIR images10,24⇓–26,30–31,34,35 or by hypersignal on 3D DIR,10 for the 3D DIR sequence suppresses fat, white matter, and fluid and gives optimal contrast between a pathologic hyperintense lesion and the surrounding suppressed background.10
The diagnosis of subclinical optic nerve demyelination, however, is challenging on MR imaging. Contrast enhancement of the optic nerve segments on T1-weighted MR images is absent. Slight optic nerve atrophy is possible.37 It has been reported that a signal intensity increase of optic nerve segments in subclinical demyelination can be demonstrated on T2-weighted FSE sequences with fat suppression and on STIR T2-weighted images, and there are also rare reports of optic nerve hypersignal on FLAIR sequences.23,32,34
In a very recent study of 25 patients with MS, an optic nerve hypersignal was found on 3D DIR in 38.5% of optic nerves without a history of previous optic neuritis.36 Our systematic investigation of the reliability of the 3D DIR sequence in the detection of subclinical optic nerve demyelination in a large group of patients with MS without clinically obvious visual symptoms and without any previous history of optic nerve neuritis within the last 3 years showed an even higher percentage of pathologic hypersignal in optic nerves in 78% of patients. Only 28% of all patients in the MS group did not present with an increased signal intensity in the optic system on 3D DIR. Therefore, a high value of the 3D DIR sequence in the diagnosis of subclinical optic nerve demyelination can be suspected according to the results of our study. Moreover, the 3D DIR sequence has the great advantage of being easily read even by inexperienced readers who are not routinely assessing neuroradiologic examinations. Thus, in patients with MS, a hypersignal in an optic nerve segment on 3D DIR that is different from a hypointense optic nerve signal in the comparison group should be considered pathologic.
The presence of a 3D DIR hypersignal in 78% of visually asymptomatic patients with MS in our study also correlates very well with the results of postmortem and clinical studies that have already shown the high percentage of subclinical optic nerve demyelination with ongoing axonal loss in patients with MS.25,36,38⇓⇓–41 The high percentage of optic nerve hypersignal on DIR in the retrobulbar nerve segments in 43% and in the canalicular nerve segments in 32% of the patients with MS but with only rare hypersignal in the prechiasmatic segment and the chiasm in 6.5% of patients with MS correlates with the distribution of acute demyelinating lesions in optic nerves.26,30 In postmortem studies, however, chronic demyelinating lesions are very common, not only in retrobulbar and canalicular but also in intracranial nerve segments.30,38,39 Evidently, the evaluation of demyelination in intracranial nerve segments on MR imaging seems to be difficult with the MR images currently available. This subclinical optic nerve demyelination occurs with or without previous clinical episodes of acute optic neuritis.36,38⇓⇓–41,43⇓–45 The ongoing axonal loss correlates with functional disability and quality of life in these patients.14⇓⇓–17,36,46⇓–48
However, we cannot be sure whether our patients with MS who were visually asymptomatic had subtle visual deficits that would have been obvious only by special visual testing (visual-evoked potentials, optical coherence tomography, visual disability evaluation36), for our patients had not been specifically examined before the MR imaging examination. Additionally, a possible episode of acute optic neuritis in the years before the 3 years included in our study design could have been possible. Thus, subtle visual deficits may have gone undetected in our study, and further studies combining radiologic findings of DIR hypersignal within optic nerve segments and clinical correlation based on specific visual testing with visual evoked potentials and optical coherence tomography and visual disability testing36 are mandatory.
There are several limitations to this study. First, the main one is that optic nerve signal intensity was not assessed with a standard sequence, specifically the STIR T2WI sequence of the orbits. As a result, the sensitivity and specificity of the 3D DIR sequence could not be evaluated.
Second, we have assumed that a signal-intensity increase in different optic nerve segments, based on hypersignal of optic nerve segments on 3D DIR compared with the signal intensity of the lateral rectus muscle, was always pathologic because of the hyposignal of optic nerve segments in 50 patients in the comparison group. This assumption may be wrong.
Third, the hypersignal of different optic nerve segments on 3D DIR in patients with MS was always related to possible subclinical optic nerve demyelination, even though it also could have been caused by other concomitant disease processes such as, for example, ischemic optic neuropathy.
Fourth, it has been assumed that subclinical optic nerve demyelination always leads to hypersignal of optic nerve segments on 3D DIR. However, we did not know whether subclinical nerve demyelination could also go undetected on 3D DIR.
Fifth, a correlation between hypersignal of optic nerve segments on 3D DIR and histologic findings and specific visual testing as mentioned above had not been performed.
Sixth, the patients in the comparison group evaluated for epileptic seizures or posttraumatic sequelae might also have had subclinical optic nerve damage and thus did not really represent a reliable control group.
Conclusions
Compared with hypointense optic nerve segments in patients without MS, in 72% of clinically asymptomatic patients with MS, 3D DIR showed hypersignal in at least 1 optic nerve segment. We have speculated about whether the hypersignal of the different optic nerve segments on 3D DIR in the group of patients with MS was related to subclinical optic nerve demyelination. The signal intensity of the different optic nerve segments could easily and reliably be determined on 3D DIR by both inexperienced and expert readers; therefore, evaluation of subclinical optic nerve pathology in patients with MS can also be performed without an experienced neuroradiologist.
Acknowledgments
Statistical tests were performed by Nicole Tracy Graf, Graf Biostatistics, Winterthur, Switzerland.
Footnotes
Thomas Sartoretti and Elisabeth Sartoretti contributed equally to this article.
Disclosures: Simon Rauch—UNRELATED: Employment: Kantonsspital Winterthur Hospital.
Institutional review board approval was obtained by the ethics commission of Kanton Zürich on September 26, 2016; Basec No. 2016–01396.
References
- Received February 16, 2017.
- Accepted after revision April 12, 2017.
- © 2017 by American Journal of Neuroradiology


Jump to section
Related Articles
Cited By...
- Optic Nerve Lesion Length at the Acute Phase of Optic Neuritis Is Predictive of Retinal Neuronal Loss
- Detection of Optic Neuritis on Routine Brain MRI without and with the Assistance of an Image Postprocessing Algorithm
- Dedicated 3D-T2-STIR-ZOOMit Imaging Improves Demyelinating Lesion Detection in the Anterior Visual Pathways of Patients with Multiple Sclerosis
- Optical coherence tomography for detection of asymptomatic optic nerve lesions in clinically isolated syndrome
- Evaluating the Utility of a Postprocessing Algorithm for MRI Evaluation of Optic Neuritis