
Abstract
BACKGROUND: Accurate diagnosis of tumefactive demyelinating lesions is clinically important to avoid unnecessary invasive biopsy or inappropriate treatment.
PURPOSE: We aimed to evaluate conventional and advanced MR imaging findings of tumefactive demyelinating lesions and determine the diagnostic performance of MR imaging for differentiating tumefactive demyelinating lesions from primary brain tumor.
DATA SOURCES: A systematic search of Ovid MEDLINE and EMBASE up to December 6, 2017, was conducted.
STUDY SELECTION: Original articles describing MR imaging findings in patients with tumefactive demyelinating lesions were selected.
DATA ANALYSIS: The pooled incidences of conventional MR imaging findings of tumefactive demyelinating lesions were obtained with the DerSimonian and Liard random-effects model. The pooled sensitivity and specificity of MR imaging for differentiating tumefactive demyelinating lesions from primary brain tumor were obtained using the bivariate random-effects model.
DATA SYNTHESIS: Nineteen eligible studies with 476 patients with tumefactive demyelinating lesions were included. The pooled incidence of open ring or incomplete rim enhancement was 35% (95% CI, 24%–47%), which was significantly higher than the incidence of closed ring or complete rim enhancement (18% [95% CI, 11%–29%]; P = .0281). The pooled incidences of T2 hypointense rim, absent or mild mass effect, and absent or mild perilesional edema were 48%, 67%, and 57%, respectively. On advanced MR imaging, tumefactive demyelinating lesions showed a high apparent diffusion coefficient, peripheral restricted diffusion, and low cerebral blood volume. The pooled sensitivity and specificity of MR imaging for differentiating tumefactive demyelinating lesions from primary brain tumor were 89% (95% CI, 82%–93%) and 94% (95% CI, 89%–97%), respectively.
LIMITATIONS: Seventeen of 19 studies were retrospective studies.
CONCLUSIONS: Conventional MR imaging findings may help differentiate tumefactive demyelinating lesions from primary brain tumor, though further study is needed to determine the added value of advanced MR imaging.
ABBREVIATIONS:
- DSC
- dynamic susceptibility-weighted contrast-enhanced imaging
- PCNSL
- primary central nervous system lymphoma
- TDL
- tumefactive demyelinating lesion
Tumefactive demyelinating lesions (TDLs) are large (usually >2 cm) demyelinating brain lesions that mimic primary brain tumors, including primary central nervous system lymphoma (PCNSL) and high-grade glioma.1⇓–3 Accurate diagnosis of TDL is clinically important to avoid unnecessary invasive biopsy or inappropriate treatment.
Several characteristic conventional MR imaging findings and advanced MR imaging techniques have been introduced for the diagnosis of TDLs.4⇓⇓⇓⇓⇓⇓⇓⇓⇓⇓⇓⇓⇓⇓⇓⇓⇓–22 Conventional MR imaging findings,23 including open ring or incomplete rim enhancement, a T2 hypointense rim, absent or mild mass effect, and absent or mild perilesional edema, demonstrate variable frequencies. In addition, 1 review article classified TDLs into 4 different subtypes based on the most prominent conventional MR imaging characteristics as follows: megacystic, Balò-like, infiltrative, and ringlike.24 Several studies have reported the use of advanced MR imaging techniques, including diffusion-weighted imaging, dynamic susceptibility-weighted contrast-enhanced imaging (DSC), MR spectroscopy, and diffusion tensor imaging.5,8,10,12,14,15,18,19
To our knowledge, the MR imaging findings of TDLs and their diagnostic performance for differentiating TDLs from primary brain tumors have not yet been systematically reviewed. Therefore, we aimed to evaluate conventional and advanced MR imaging findings of TDLs and to determine the diagnostic performance of MR imaging for differentiating TDL from primary brain tumor.
Materials and Methods
Search Methods and Study Selection
A systematic search of the literature in MEDLINE and EMBASE was performed to identify published original articles describing MR imaging findings in patients with TDL. The search term combined synonyms of “TDL” and “MR imaging” as follows: ((tumefactive demyelinating lesion*) OR (TDL) OR (atypical demyelination lesion) OR (Balò sclerosis)) AND ((MR imaging) OR (MR imaging) OR (MR imaging)). The data base was searched for literature published on or before April 21, 2018. The literature search was limited to English-language publications. The bibliographies of articles were explored to identify additional relevant articles.
Data Extraction
Conventional MR imaging findings and advanced MR imaging findings in patients with TDL and the diagnostic performance of MR imaging for differentiating TDL from primary brain tumor were extracted from the eligible articles. A TDL was defined as a large (usually >2 cm) demyelinating brain lesion mimicking a primary brain tumor.25,26 The conventional MR imaging findings of TDLs were recorded as the following: 1) an open ring or incomplete rim enhancement, 2) a closed ring or complete rim enhancement, 3) a T2 hypointense rim, 4) an absent or mild mass effect, and 5) absent or mild perilesional edema. Advanced MR imaging findings from the techniques of DWI, DSC, and MR spectroscopy were also recorded. Two-by-2 tables (true-positive, false-positive, false-negative, true-negative) for the determination of the diagnostic performance of MR imaging for differentiating TDLs from primary brain tumors were also constructed.
The following information was recorded from the selected studies: 1) the institution, the patient recruitment period, a retrospective or prospective design, consecutive or nonconsecutive patient enrollment, the reference standard, and the follow-up period; 2) the number of patients with TDLs, mean age, age range, and male-to-female ratio; 3) the magnetic field strength of the scanner, scanner manufacturer, scanner model, number of head coil channels, slice thickness, and advanced MR imaging techniques used, including DWI, DSC, and MR spectroscopy; and 4) the number of MR imaging readers, reader experience, and blindness to the reference standard.
Quality assessment was performed using the Quality Assessment of Diagnostic Accuracy Studies-2 (QUADAS-2) criteria.27 The study selection, data extraction, and quality assessment were performed by 2 reviewers (C.H.S., H.S.K.) and were independently reviewed by a third reviewer (S.J.K.), in accordance with the Preferred Reporting Items for Systematic Reviews and Meta-Analyses guidelines.28
Statistical Methods
The pooled incidences for conventional MR imaging findings of TDL were obtained with the inverse variance method for calculating weights and the DerSimonian and Liard random-effects model.29⇓–31 The difference between the incidences of open ring or incomplete rim enhancement versus closed ring or complete rim enhancement was evaluated using mixed-effects model meta-regression. Heterogeneity was evaluated using the inconsistency index (I2) test of Higgins et al,32 with values of >50% indicating substantial heterogeneity. Publication bias was visually assessed using a funnel plot, and the statistical significance was assessed using the Egger test.33 Meta-regression was performed to explain the effects of heterogeneity across the studies. We considered the following covariates: 1) the number of patients with TDL (<15 [median value of the included studies] versus ≥15); 2) age (younger than 34.5 years [median value of the included studies] versus 34.5 years and older); 3) male-to-female ratio (<0.76 [median value of the included studies] versus ≥0.76); 4) reference standard (histopathology only versus others); 5) magnetic field of the scanner (1.5T versus 3T); and 6) slice thickness (<5 mm versus ≥5 mm).
The pooled sensitivity and specificity and their 95% confidence interval were obtained using the bivariate random-effects model.29⇓–31 A hierarchic summary receiver operating characteristic curve with 95% confidence and prediction regions was obtained. Publication bias was assessed by the Deeks funnel plot, and the statistical significance was assessed by the Deeks asymmetry test.34
All statistical analyses were performed by 1 reviewer (C.H.S., with 5 years of experience in performing systematic reviews and meta-analysis) using the “metafor” and “mada” packages in R, Version 3.4.1 (http://www.r-project.org/) and the “metandi” and “MIDAS” modules in STATA 15.0 (StataCorp, College Station, Texas).
Results
Eligible Studies and Characteristics
The search identified 195 articles. After removing 21 duplicated articles, we performed screening of the 174 remaining titles and abstracts. From these, a further 147 articles were excluded (Fig 1). Full-text reviews of the remaining 27 potentially eligible articles were performed, and a further 8 studies were excluded for the following reasons: no mention of the MR imaging findings of TDL (n = 4), partially overlapping patient cohorts (n = 3), and case series (n = 1). Finally, 19 eligible studies covering 476 patients with TDLs were included in the analyses.4⇓⇓⇓⇓⇓⇓⇓⇓⇓⇓⇓⇓⇓⇓⇓⇓⇓–22
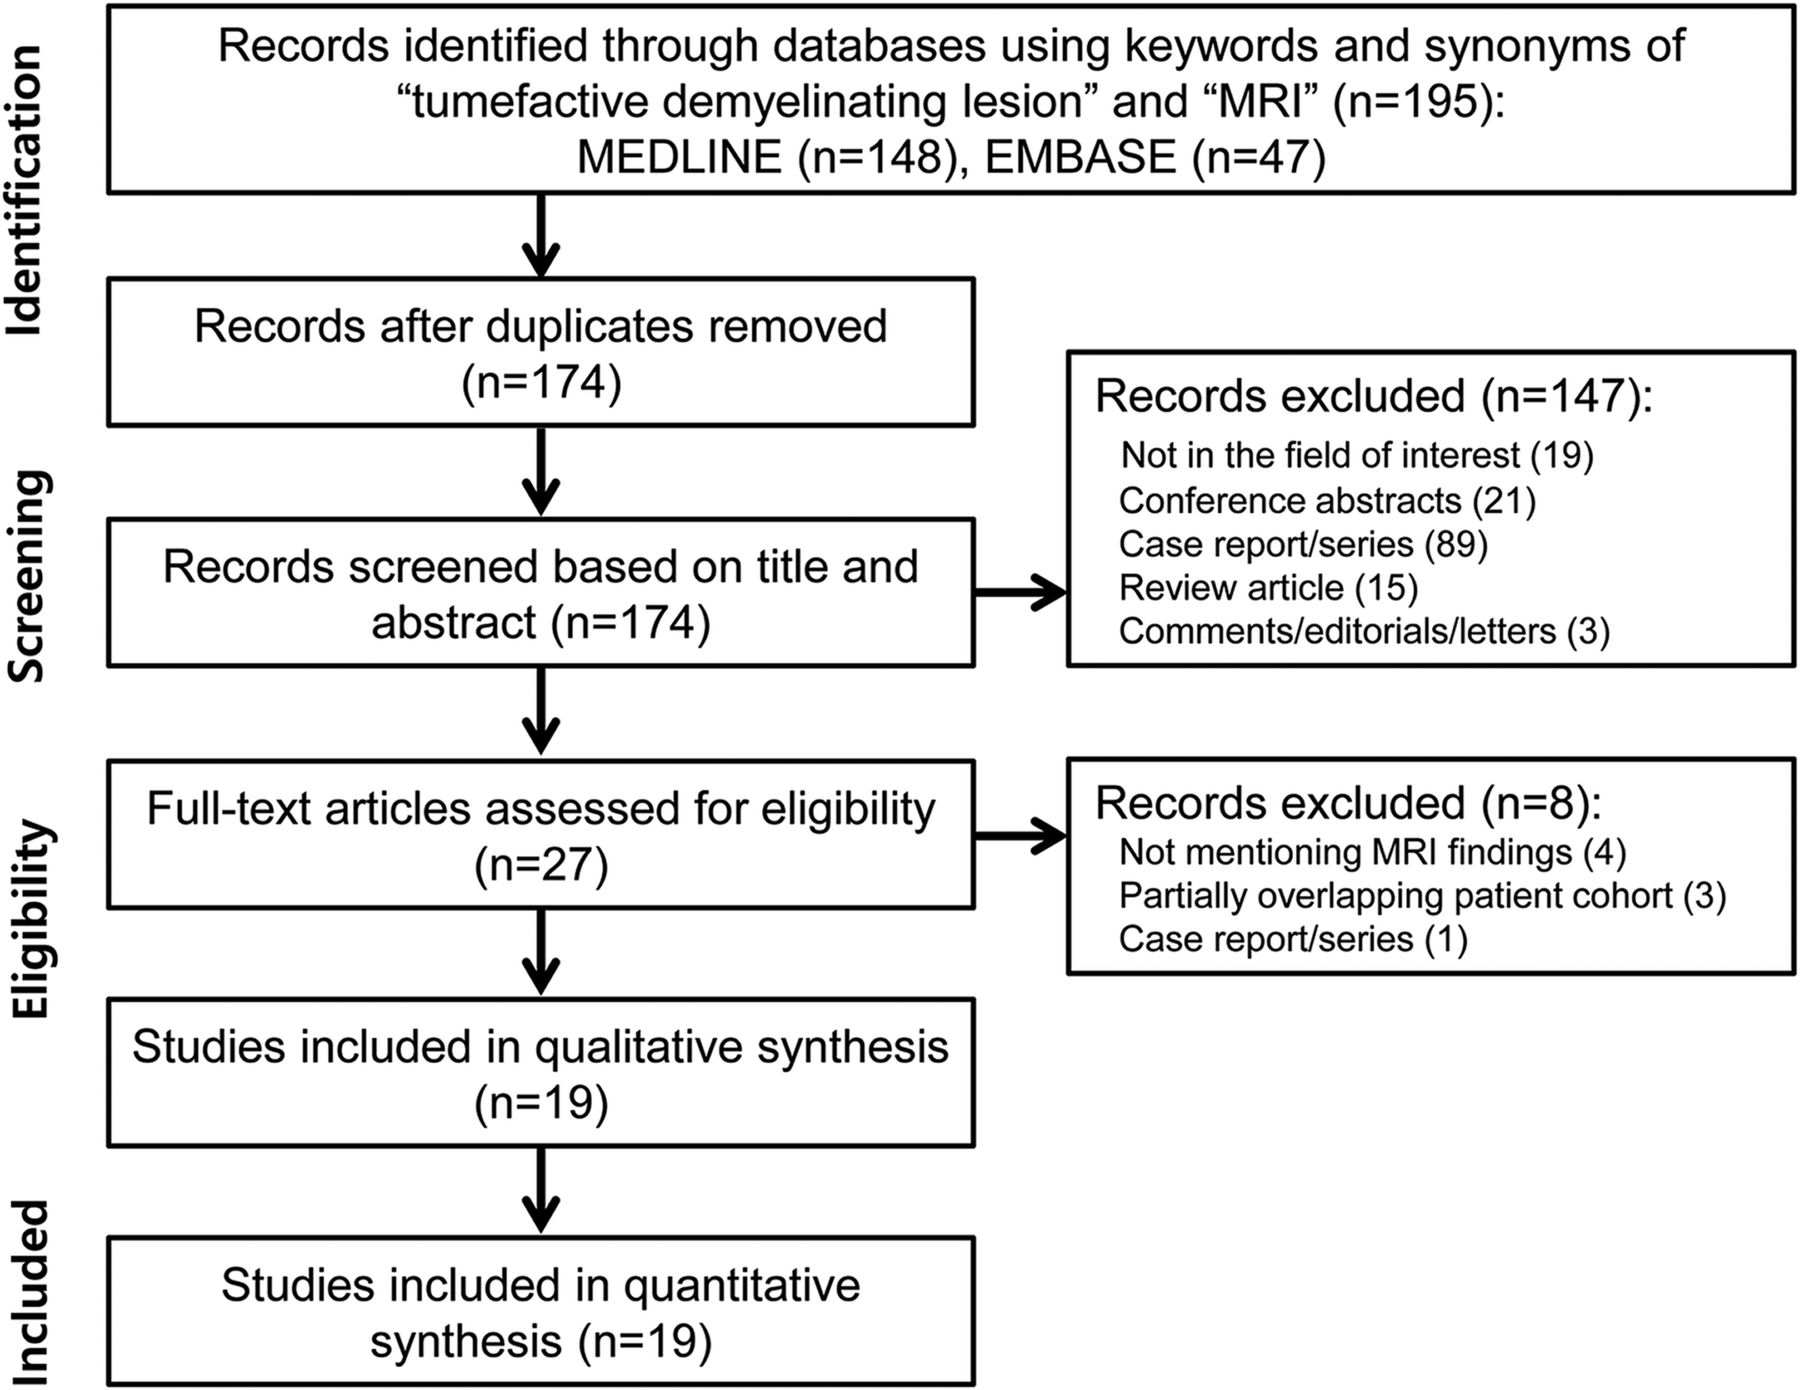
Flow diagram for the literature-selection process.
The Table lists the characteristics of the eligible studies published between 2001 and 2017. The mean age ranged from 10.4 to 42 years. One study was prospective in design,22 17 studies were retrospective,4⇓⇓⇓⇓⇓–10,12⇓⇓⇓⇓⇓⇓⇓⇓–21 and 1 study did not mention the design.11 The clinical follow-up ranged from 9.6 months to 5 years.
Characteristics of the eligible studies
Quality Assessment
The quality of the 19 included studies was moderate, with >4 of the 7 domains being satisfied (On-line Fig 1). With regard to patient selection, 17 studies were considered to have an unclear risk of bias due to nonconsecutive enrollment.4,5,8⇓⇓⇓⇓⇓⇓⇓⇓⇓⇓⇓⇓⇓–22 With regard to the reference standard, 5 studies were considered to have a high risk of bias because they only used clinical diagnosis for the reference standard.4,7,10,15,16 In the flow and timing domain, 5 studies had an unclear risk of bias because the follow-up interval was not reported,6,7,12,14,21 and 13 studies had a high risk because different reference standards were used in the study.4⇓–6,8,11,12,14,16,18⇓⇓⇓–22
Incidence of Conventional MR Imaging Findings in Patients with TDL: Meta-Analysis
First, we evaluated the pooled incidences of conventional MR imaging findings in patients with TDL (Fig 2). The pooled incidence of open ring or incomplete rim enhancement was 35% (95% CI, 24%–47%), and the pooled incidence of closed ring or complete rim enhancement was 18% (95% CI, 11%–29%), with the incidence of open ring or incomplete rim enhancement being significantly higher than that of closed ring or complete rim enhancement (P = .028). The pooled incidence of a T2 hypointense rim was 48% (95% CI, 36%–60%), the pooled incidence of an absent or mild mass effect was 67% (95% CI, 48%–83%), and the pooled incidence of absent or mild perilesional edema was 57% (95% CI, 36%–76%).

Forest plots to show the pooled incidences of conventional MR imaging findings in patients with TDL: open ring or incomplete rim enhancement (A), closed ring or complete rim enhancement (B), T2 hypointense rim (C), absent or mild mass effect (D), and absent or mild perilesional edema (E). Numbers are estimates with 95% confidence intervals in parentheses.
There was no publication bias with respect to open ring or incomplete rim enhancement (P = .81), though publication bias was noted with respect to closed ring or complete rim enhancement (P < .001). Heterogeneity was observed for all conventional MR imaging findings (I2 = 63%–80%). To explore the effects of heterogeneity, we conducted a meta-regression for open ring or incomplete rim enhancement. None of the variables, including the number of patients with TDL (P = .43), age (P = .26), male-to-female ratio (P = .24), reference standard (P = .51), magnetic field strength of the scanner (P = .45), and slice thickness (P = .07), showed a statistically significant relationship.
Advanced MR Imaging Findings in Patients with TDL
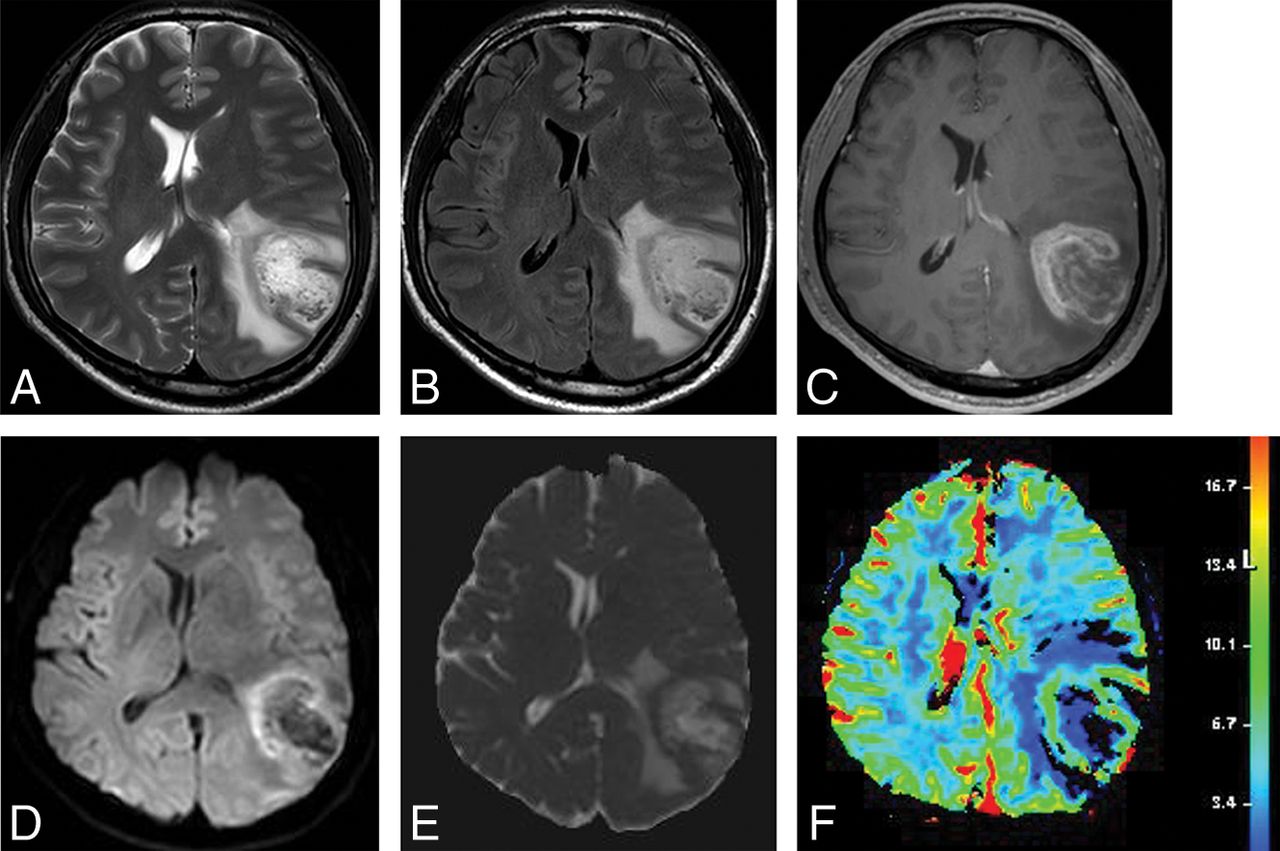
On DWI, 2 studies demonstrated a significantly higher apparent diffusion coefficient for TDL than for PCNSL12,14 and high-grade glioma.14 Three studies also reported peripheral, restricted diffusion in TDLs.8,15,19,21 One study reported that TDLs showed higher intralesional hyperintensities on fractional anisotropy maps but lower perilesional fractional anisotropy values in the rim than high-grade gliomas.21 On perfusion imaging, 1 study demonstrated that TDLs showed a significantly lower relative cerebral blood volume than intracranial neoplasms,5 and 2 studies showed decreased CBV in TDLs on MR8,19 or CT perfusion.8 In addition, 1 study reported the presence of an intact vein traversing the TDL on DSC.5 For MR spectroscopy, several studies reported increased choline8,10,15,19 and decreased N-acetylaspartate,8,10,18,19 the presence of a lactate peak,8,15,18 and the presence of a glutamate/glutamine peak.15,18 The representative case studied by conventional and advanced MR imaging is shown in Fig 3.

Images obtained in a 44-year-old man with biopsy-proved TDL. T2-weighted (A) and FLAIR (B) images show a well-defined high-signal-intensity lesion in the left cerebral hemisphere with mild perilesional edema. C, Contrast-enhanced T1-weighted image shows open ring enhancement. DWI (D) and the corresponding ADC map (E) reveal high ADC within the lesion and peripheral restricted diffusion. F, DSC demonstrates low cerebral blood volume.
Individual Diagnostic Performance of MR Imaging for the Diagnosis of TDLs
The diagnostic performance of conventional MR imaging for the diagnosis of TDLs was reported in 3 studies.6,9,14 By means of open ring or incomplete rim enhancement for the diagnosis of TDLs, the individual sensitivity showed substantial variation (27%–71%), though the specificity was consistently high (98%–100%).9,14 In addition, 1 study using conventional MR imaging and CT criteria (less attenuation than cortical and basal ganglia gray matter) showed a sensitivity of 87% and specificity of 100% for distinguishing TDLs from gliomas or PCNSLs.9 Another study showed that conventional MR imaging had a sensitivity of 81% and specificity of 57% for the differentiation of TDLs from high-grade gliomas.6
The diagnostic performance of an advanced MR imaging technique for the diagnosis of TDL was noted in 4 studies.9,12,14,21 In a comparison of TDLs with PCNSLs, 1 study demonstrated that the high ADCminimum value with a threshold of 556 × 10−6 mm2/s was the best indicator for differentiating TDLs from atypical PCNSLs (a sensitivity of 81% and specificity of 89%).12 In comparisons of TDLs with high-grade gliomas, 1 study using combined DTI and DSC perfusion showed a sensitivity of 71% and specificity of 93%,6 while another study using DTI showed a sensitivity of 92% and specificity of 88%.21 Two studies revealed that the combination of conventional MR imaging and advanced MR imaging improved the diagnostic performance.6,14
Diagnostic Performance of MR Imaging for the Diagnosis of TDLs: Meta-Analysis
Five original articles evaluated the overall diagnostic performance of MR imaging for differentiating a TDL from primary brain tumor.6,9,12,14,21 The individual sensitivities and specificities were 67%–91% and 79%–100%. The pooled sensitivity was 89% (95% CI, 82%–93%), and the pooled specificity was 94% (95% CI, 89%–97%; Fig 4). The area under the hierarchic summary receiver operating characteristic curve was 0.93 (95% CI, 0.90–0.95; On-line Fig 2). There was no heterogeneity in the sensitivity (I2 = 0.0%) or specificity (I2 = 45.72%). The Deeks funnel plot demonstrated that the likelihood of publication bias was low (P = .48, On-line Fig 3).
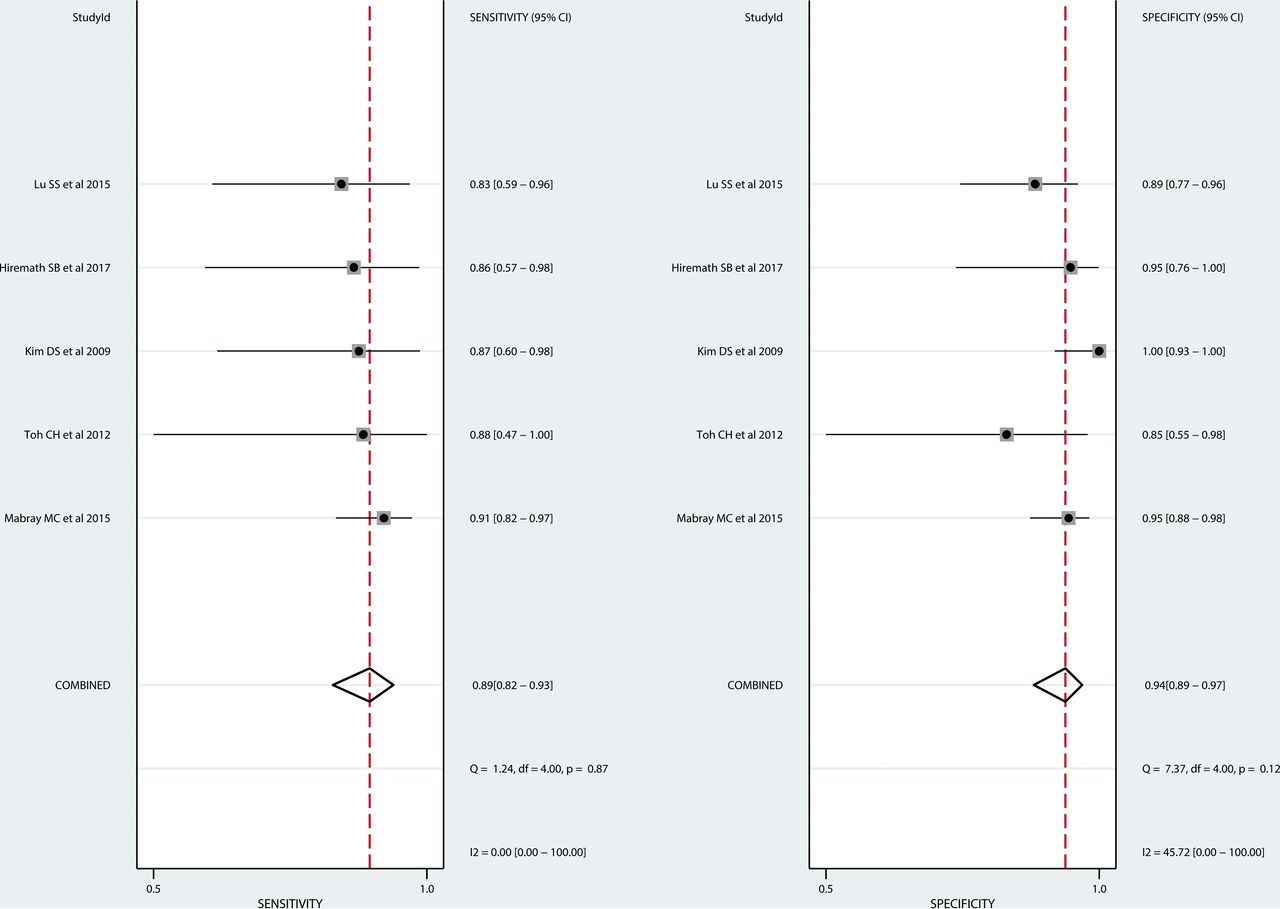
Coupled forest plots of the sensitivity and specificity of MR Imaging for the diagnosis of a TDL. Numbers are estimates with 95% confidence intervals in parentheses.
Discussion
The current study reports the conventional MR imaging findings for TDLs, covering 19 studies with 476 patients. The pooled incidence of open ring or incomplete rim enhancement was 35% (95% CI, 24%–47%). In addition, the pooled incidences of a T2 hypointense rim, absent or mild mass effect, and absent or mild perilesional edema were 48% (95% CI, 25%–68%), 67% (95% CI, 42%–87%), and 57% (95% CI, 27%–82%), respectively. The overall diagnostic performance of MR imaging for differentiating TDL from primary brain tumor demonstrated a pooled sensitivity of 89% (95% CI, 82%–93%) and a pooled specificity of 94% (95% CI, 89%–97%). Open ring or incomplete rim enhancement showed a high specificity (98%–100%). Therefore, conventional MR imaging findings can be of help in the accurate diagnosis of TDL. In addition, our work could prove useful to the literature and may prompt the conduct of prospective case collections or consortial work.
In routine clinical practice, the differentiation of TDL from primary brain tumor is difficult. Open ring or incomplete rim enhancement as a conventional MR imaging finding was described as highly specific (94%) for atypical brain demyelination in 32 illustrated cases identified on a MEDLINE search.35 The present study demonstrated a pooled incidence of open ring or incomplete rim enhancement of 35% (95% CI, 24%–47%); however, a high specificity (98%–100%) was noted. In addition, the pooled incidence of open ring or incomplete rim enhancement was significantly higher than the incidence of closed ring or complete rim enhancement (18% [95% CI, 11%–29%]). The enhancing area of the ring is regarded as representing the leading edge of demyelination and therefore favors the white matter side of the lesion.36 Open ring or incomplete rim enhancement may be useful for differentiating a TDL from primary brain tumor.
The differentiation of a TDL from a PCNSL can sometimes be challenging, clinically, radiologically, and even pathologically. A few studies have tried to differentiate TDLs from PCNSLs using advanced MR imaging techniques. Two studies demonstrated a significantly higher ADCminimum in TDL than in PCNSL,12,14 with 1 study demonstrating that ADCminimum with a threshold of 556 × 10−6 mm2/s was the best indicator for differentiating TDL from atypical PCNSL (a sensitivity of 81% and specificity of 89%).12 Histologically, TDLs may demonstrate peripheral active breakdown of myelin and a dense inflammatory infiltrate consisting of activated macrophages.37 Another study showed a lower choline/NAA ratio in TDLs than in PCNSLs, with a threshold for differentiation of 1.73 (a sensitivity of 89% and specificity of 76%).38 In addition, noncontrast CT hypoattenuation of MR imaging–enhanced regions was observed in 93% of TDL cases, but only 4% of primary brain tumors.9 One study revealed that the combination of conventional MR imaging and advanced MR imaging improved the diagnostic performance for differentiating TDL from PCNSLs or high-grade gliomas.14 ADC values, MR spectroscopy, and noncontrast CT may help in diagnosing TDLs; however, further study is required to determine the added value of advanced MR imaging techniques in the differentiation of TDLs from PCNSLs.
A previous article reported that most patients with TDLs showed an excellent response to corticosteroid treatment, with a substantial decrease in lesion size or disappearance on follow-up imaging.25 One of the studies included in the present meta-analysis reported that all patients with TDLs received corticosteroid treatment after surgical biopsy and showed no evidence of recurrence or radiologic aggravation during the 4.2 years of the follow-up.9 Other studies revealed that 35%–62% of patients with TDLs had a monophasic course and were diagnosed with a clinically isolated syndrome.4,8 A correlation between MR imaging findings and treatment response in patients with TDL has not yet been established, and further study on this may be needed.
This study has several limitations. First, 17 of the 19 studies were retrospective observational studies with a small sample size, and there were only 5 studies differentiating a TDL from primary brain tumor. However, the included studies represented the full extent of the currently available evidence. Our study may prompt prospective studies or consortial work. Second, heterogeneity was noted for conventional MR imaging findings. We therefore performed meta-regression to explore the effects of heterogeneity but found no covariates. Conventional MR imaging findings are inherently subjective, and the small samples due to the rarity of TDLs may affect the heterogeneity. Third, it is unclear how many of the included patients were positive for aquaporin 4 antibodies or myelin oliogodendrocyte glycoprotein antibodies and whether this influences MR imaging findings in TDLs. To overcome these limitations, we performed our systematic review and meta-analysis using recent robust methodology, including hierarchic logistic regression modeling,29⇓–31 and reported our findings according to the following guidelines: Preferred Reporting Items for Systematic Reviews and Meta-Analyses,28 the Handbook for Diagnostic Test Accuracy Reviews published by the Cochrane Collaboration,39 and the Agency for Health Care Research and Quality.40
Conclusions
Conventional MR imaging findings may help in the accurate diagnosis of TDLs. However, further study is required to determine the added value of advanced MR imaging techniques in the differentiation of a TDL from primary brain tumor.
Footnotes
This study was supported by a grant from the National R&D Program for Cancer Control, Ministry of Health and Welfare, Republic of Korea (1720030).
Indicates open access to non-subscribers at www.ajnr.org
References
- Received March 10, 2018.
- Accepted after revision May 9, 2018.
- © 2018 by American Journal of Neuroradiology


Jump to section
Related Articles
Cited By...
- Tumefactive demyelinating lesions: A literature review of recent findings
- Differential Diagnosis of Tumor-like Brain Lesions
- Tumefactive Primary Central Nervous System Vasculitis: Imaging Findings of a Rare and Underrecognized Neuroinflammatory Disease
- Paraneoplastic recurrent tumefactive demyelination in a 62-year-old man with metastatic seminoma