
Abstract
Background and Purpose Fractional tumor burden better correlates with histologic tumor volume fraction in treated glioblastoma than other perfusion metrics such as relative CBV. We defined fractional tumor burden classes with low and high blood volume to distinguish tumor from treatment effect and to determine whether fractional tumor burden can inform treatment-related decision-making.
Materials and Methods Forty-seven patients with high-grade gliomas (primarily glioblastoma) with recurrent contrast-enhancing lesions on DSC-MR imaging were retrospectively evaluated after surgical sampling. Histopathologic examination defined treatment effect versus tumor. Normalized relative CBV thresholds of 1.0 and 1.75 were used to define low, intermediate, and high fractional tumor burden classes in each histopathologically defined group. Performance was assessed with an area under the receiver operating characteristic curve. Consensus agreement among physician raters reporting hypothetic changes in treatment-related decisions based on fractional tumor burden was compared with actual real-time treatment decisions.
Results Mean lower fractional tumor burden, high fractional tumor burden, and relative CBV of the contrast-enhancing volume were significantly different between treatment effect and tumor (P = .002, P < .001, and P < .001), with tumor having significantly higher fractional tumor burden and relative CBV and lower fractional tumor burden. No significance was found with intermediate fractional tumor burden. Performance of the area under the receiver operating characteristic curve was the following: high fractional tumor burden, 0.85; low fractional tumor burden, 0.7; and relative CBV, 0.81. In comparing treatment decisions, there were disagreements in 7% of tumor and 44% of treatment effect cases; in the latter, all disagreements were in cases with scattered atypical cells.
Conclusions High fractional tumor burden and low fractional tumor burden define fractions of the contrast-enhancing lesion volume with high and low blood volume, respectively, and can differentiate treatment effect from tumor in recurrent glioblastomas. Fractional tumor burden maps can also help to inform clinical decision-making.
ABBREVIATIONS
- FTB
- fractional tumor burden
- HGG
- high-grade glioma
- ICC
- intraclass correlation coefficient
- rCBV
- relative cerebral blood volume
- TE
- treatment effect
An important challenge in the care of patients with high-grade gliomas (HGGs) following conventional therapy with maximal safe surgical resection and chemoradiation is the differentiation of tumor and treatment effect (TE). The current practice standard, Response Assessment in Neuro-Oncology criteria, to determine the response to therapy of a tumor is largely based on the assessment of T2/FLAIR signal extent and the size of T1 gadolinium enhancement on MR imaging across time.1 An increase in T2/FLAIR signal and contrast enhancement following treatment does not, however, always indicate tumor progression. Thus, perfusion imaging markers such as relative cerebral blood volume (rCBV) have been thoroughly investigated and used to differentiate tumor from TE.2-4 More recent studies have demonstrated that another perfusion-derived metric, fractional tumor burden (FTB), which is defined as the volume fraction of tumor voxels above a specified rCBV threshold, has similar potential.2,3,5
Despite their promise, MR imaging perfusion–derived metrics have yet to be widely adopted. Reasons for this include interoperator subjectivity in producing rCBV values (often based on “hot spot” ROI analysis), lack of clinically validated parameters to differentiate tumor and TE, and lack of standardization of imaging-acquisition techniques and postprocessing software across different sites.6 Specifically, the hot spot ROI methodology is largely based on manually placing an ROI in an area of tumor with the highest rCBV on a single image.7-9 This method, however, underrepresents the entire volume and heterogeneity of the tumor. Assessment of whole-tumor perfusion, for example, with FTB mitigates this issue by providing per-voxel measurements rather than computing 1 value to represent the entire contrast-enhancing lesion. Even with this technique, however, an rCBV threshold defining tumor versus TE is needed. A previous study evaluating stereotactic biopsy specimens of recurrent glioblastoma demonstrated that rCBV of ≤1.0 distinguished tumor from TE with 100% accuracy.2 Another study found similar findings, with a threshold of 1.13 yielding 82% sensitivity and 90% specificity.3
Apart from using rCBV to differentiate TE from tumor, higher rCBV thresholds have been used to identify more aggressive tumors. One of the earliest glioma studies using a single rCBV threshold found that tumors with an rCBV of >1.75 portended a worse prognosis.8 Another study found that rCBV of ≥1.8 (despite rCBV being estimated by the negative enhancement integral on T2WI) best distinguished tumor burden when it was >20% of the entire tumor.10 Discrepancies in previously reported rCBV thresholds,2,3,8,10 therefore, are not always due to lack of standardized methodologies but may be related to the specific question being asked.
In this study, we evaluated the utility of quantitative FTB of the entire contrast-enhancing lesion volume in patients with suspected recurrent HGGs. We hypothesize that the use of 2 rCBV values (1.0, which has been found to effectively differentiate TE from tumor, and 1.75, which has been shown to indicate aggressive tumor) to define low and high fractional tumor burden, respectively, would be effective in distinguishing recurrent tumor from TE. We also assessed whether qualitative interpretation of FTB among 5 physicians agrees with the histopathologic diagnosis and whether FTB can be used to inform treatment-related decision-making.
Materials and Methods
Patients
This retrospective study was approved by our institutional review board. We evaluated adults with suspected HGG recurrence after previous surgical resection followed by standard chemoradiation between January 2007 to June 2018. Inclusion criteria were the following: 18 years of age or older with HGG initially treated with conventional therapy, enlarging or new contrast-enhancing mass on follow-up DSC-MR imaging, surgical resection or biopsy of the mass, and availability of tissue specimens for histopathologic examination. All patients who had a resection had >90% or gross total resection as determined qualitatively by the amount of residual contrast enhancement on immediate postsurgical T1WI. Exclusion criteria included non-contrast-enhancing tumor on MR imaging, marked susceptibility related to blood or surgical material on raw precontrast DSC images, low-grade gliomas, and any oligodendroglioma. Oligodendrogliomas were excluded because elevated intratumoral rCBV has been shown to relate to fine capillaries and is not necessarily indicative of aggressive tumor.11 Patients on bevacizumab at the time of an operation for suspected recurrence were not excluded because the presence of an enlarging contrast-enhancing mass while on bevacizumab suggests a refractory response to antiangiogenic therapy.12 After screening and assessment of eligibility, 47 patients were included (On-line Fig 1). Clinical demographics, histopathologic and molecular information, and treatment history were obtained through the electronic medical record.

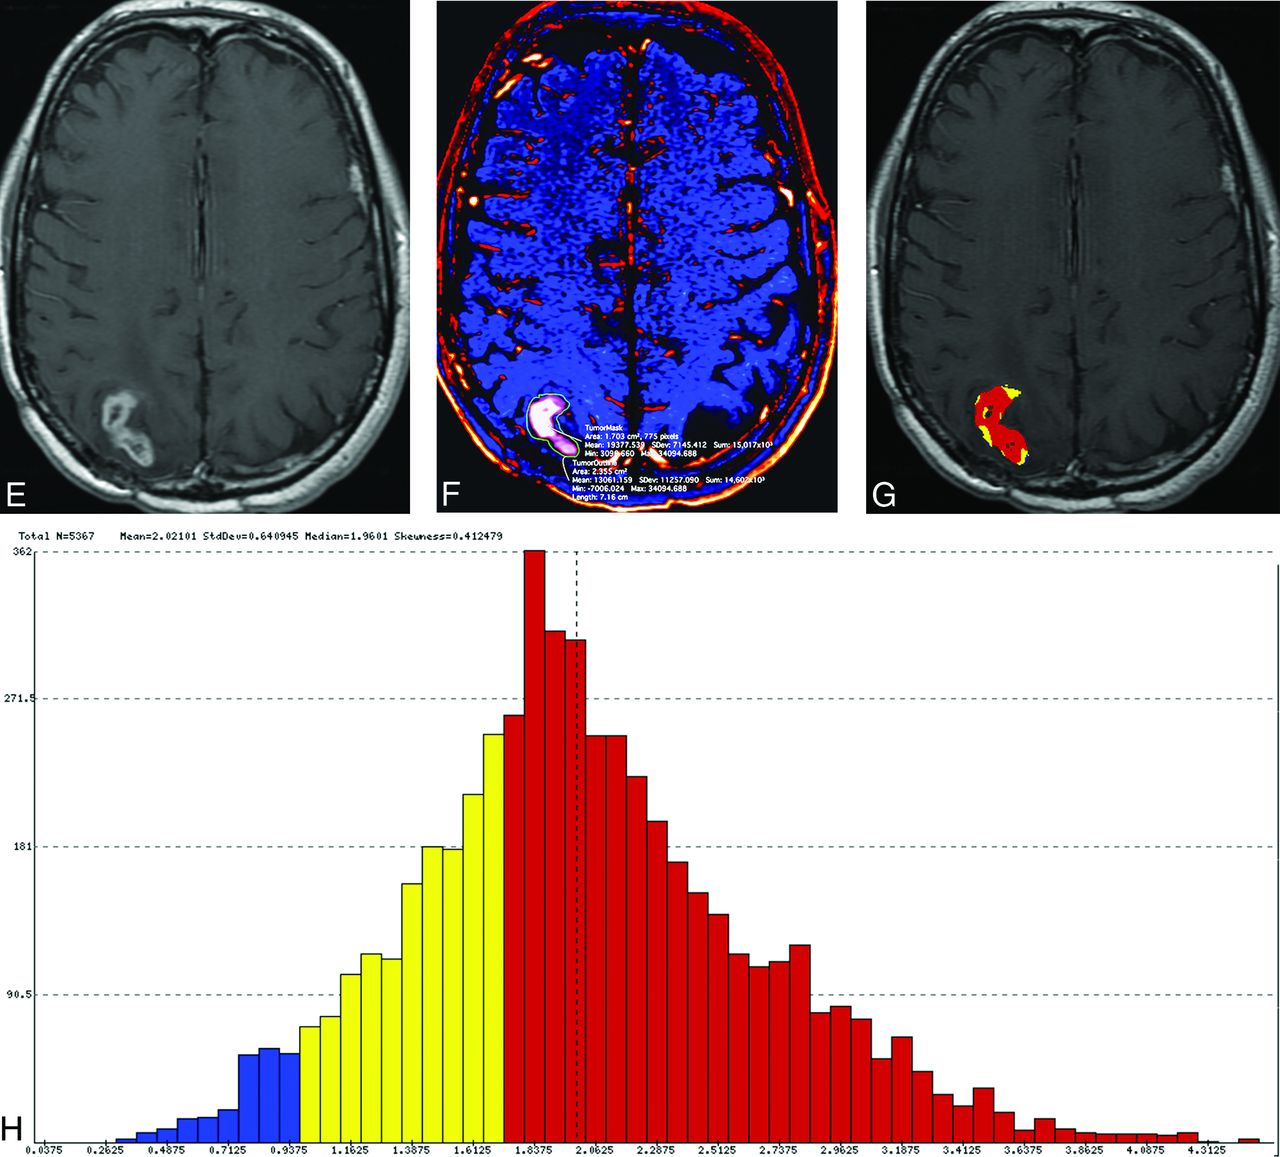
Representative examples of treatment effect (upper row) and recurrent tumor (lower row) in 2 patients with previously resected and irradiated glioblastomas. Contrast-enhancing lesions on postcontrast T1-weighted (A and E) and ΔT1 (B and F) images. Output FTB maps superimposed on the contrast-enhanced T1-weighted images (C and G). Blue represents areas of low blood volume (FTBlow), and red represents areas of high blood volume (FTBhigh). Histograms (D and H) show all voxels of the contrast-enhancing volume classified into the respective FTBlow, FTBmid (yellow), and FTBhigh classes, which is based on the rCBV thresholds of 1.0 and 1.75.
Perfusion MR Imaging Acquisition
MRIs were performed on a 1.5T (n = 28, Signa; GE Healthcare, Milwaukee, Wisconsin) or 3T (n = 19, MR750; GE Healthcare) scanner. Images were acquired as part of the brain tumor protocol of our institution, which varied across the years. However, all examinations included pre- and postgadolinium axial 2D-T1-weighted spin-echo or 3D-T1-weighted inversion recovery echo-spoiled gradient echo brain volume (BRAVO) images. DSC imaging was performed in each patient, and during the study period, it was acquired with nonpreload single-echo gradient EPI (parameters: TR/TE =1800/35-40 ms, section thickness =5 mm, 0 skip with 20 images covering the brain, flip angle =60°, matrix = 96 × 128 mm, FOV = 220-240 mm). A dynamic bolus was acquired using a full dose of a gadolinium (0.1 mmol/kg), which was administered intravenously by a power injector at a rate of 4-5 mL/s.
Image Processing and Quantitative Analysis
We used a workstation equipped with OsiriX MD (Version 7.0; http://www.osirix-viewer.com) and a commercially available plug-in (IB Neuro, Version 2.0; Imaging Biometrics, Elm Grove, Wisconsin), which uses well-established and previously published methods, including a leakage-correction algorithm, to process perfusion data and calculate rCBV and FTB.2,3,5,13-15 For semiautomated image analysis, we used IB Rad Tech (Version 2.0; Imaging Biometrics), which is a workflow engine that generates quantitative ΔT1 and FTB maps from the IB Delta Suite (Version 2.0; Imaging Biometrics), and IB Neuro. The overall workflow, which has been described previously,2 is highlighted as follows: 1) The volume of contrast enhancement was determined from ΔT1 maps, which are standardized difference maps computed from the difference of coregistered pre- and postcontrast T1-weighted images;14-17 2) postcontrast T1 images were coregistered to the raw DSC images; 3) the contrast-enhancing VOI was transferred to the rCBV map; and 4) normalization was performed by drawing and taking the average of two 5 × 5 mm2 ROIs in the maps, in which lesion mask voxels used to classify areas of contrast enhancement on the basis of predefined rCBV thresholds were subsequently generated. As previously stated, we selected thresholds of 1.0 and 1.75 to define 3 FTB classes: FTBlow, percentage of contrast-enhancing voxels with rCBV of ≤1.0; FTBmid, percentage of voxels with rCBV between 1.0 and 1.75; and FTBhigh, percentage of voxels with rCBV of ≥1.75. Percentage values from the 3 FTB classes totaled 100%. Mean rCBV values of the contrast-enhancing VOIs were generated for each patient. Volumetric images of the contrast-enhancing lesion superimposed on the FTB map containing colored voxels of each class (FTBlow = blue; FTBmid = yellow; FTBhigh = red) and a histogram displaying voxels for the entire contrast-enhancing VOI were also produced (Fig 1).
Histopathologic Examination
A team of 2 neuropathologists with 2 (J.L.) and 21 (D.E.B.) years of neuro-oncology–pathology experience was blinded to clinical and MR imaging results. Histopathologic examination of tissue specimens was performed by consensus agreement in a single session, with the reviewers providing only a single assessment for each sample. From each resection or biopsy, sections from different areas of the entire tissue submitted for histopathology were evaluated. To determine a single histopathologic diagnosis for a given case, the team evaluated whether each section consisted of TE (defined as the absence of neoplastic cells or the presence of scattered infiltrating atypical cells but without a focal group or a solid sheet of neoplastic cells) or tumor (defined as the presence of any group or a solid sheet of neoplastic cells with or without superimposed treatment-related changes). For the purpose of this study, scattered atypical cells were classified as TE because it was not absolutely certain to the neuropathologists whether the atypical cells represented radiation effect or treated-but-viable glioma cells. Second, the resolution of today's perfusion MR imaging is not high enough to detect scattered atypical cells that are otherwise only identified microscopically.
Qualitative Analysis
Five physician raters who are involved in the care of patients with glioma, consisting of 3 neuro-oncologists (R.T., S.N., L.R.) with varying levels of experience (6, 8, and 35 years), a radiation oncologist (S.G.S.) with 14 years of experience, and a neuroradiologist (N.F.) with 25 years of experience, were blinded to clinical and histopathology information. Each rater was given a PowerPoint file (Microsoft, Redmond, Washington) consisting of representative MR images and numeric perfusion values of a patient's contrast-enhancing lesion (On-line Fig 2). The file consisted of 3 sample patients drawn from the total pool of 47 patients, one with histopathologically confirmed TE and the other 2 with histopathologically confirmed tumor. Anonymized data of the remaining 44 patients, who were presented in random order, followed the 3 sample patients. For all patients, 2 representative axial images of the segmented contrast-enhancing mass with 2 corresponding axial images of the color FTB map and the histogram and FTB percentages of the entire contrast-enhancing lesion were provided. Of note, although only 2 representative image slices of a patient's lesion were provided for visualization, the histogram data and percentage values, which represented the entire contrast-enhancing volume, were provided. Raters recorded whether they thought that the data represented TE or tumor and whether they would hypothetically change treatment on the basis of FTB. A change in treatment was defined as a change in surgical or medical management and excluded the option for shorter interval imaging surveillance. For qualitative image interpretation, we compared the consensus decision (representing most decisions among all raters) with the actual histopathologic diagnosis. For decisions of treatment change, we compared the consensus decision with the actual treatment decision that was made at the time of the patient's real-time care, which was largely based on histopathologic assessment.
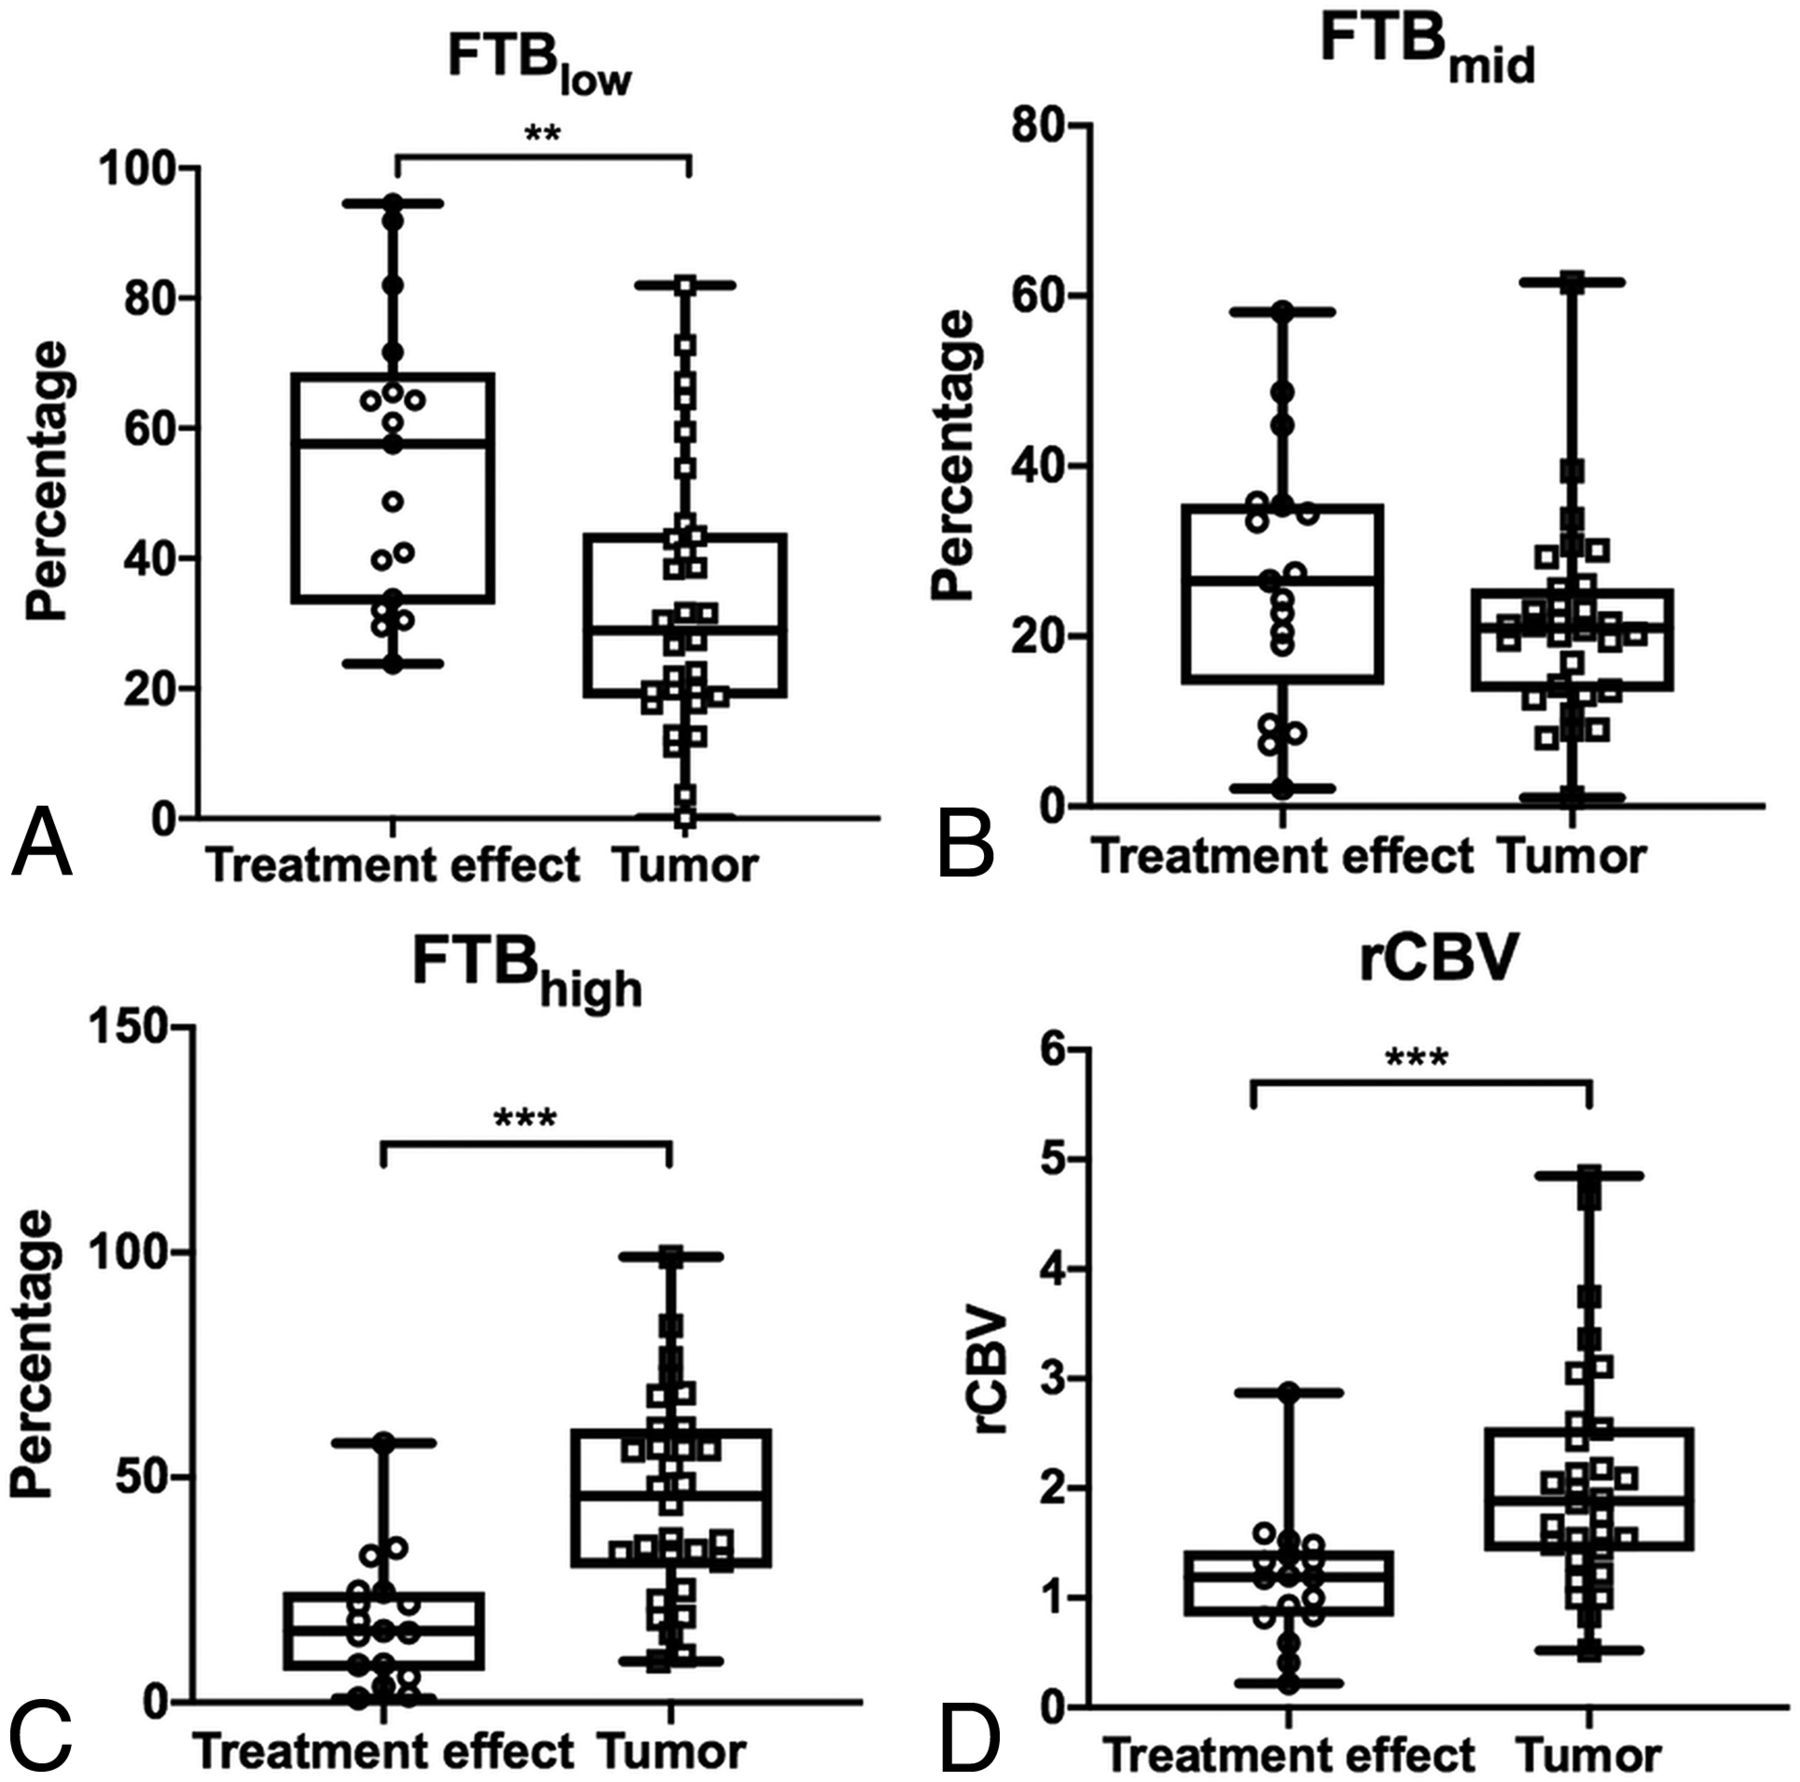
Boxplots of the relationship between FTB and normalized rCBV in 2 histopathologically defined groups: treatment effect and recurrent tumor. Open circles and squares represent individual measurements. The upper and lower limits of the whiskers represent the minimum and maximum of all of the data. Double asterisks indicate P < .01; triple asterisks, P < .001.
Statistical Analyses
Descriptive statistics were used to report patient demographics and perfusion metrics. We used the nonparametric Mann-Whitney test to compare FTB classes and rCBV between the TE and tumor groups. The performance of each FTB class and rCBV to distinguish TE and tumor was evaluated with the area under the receiver operating characteristic curve. To determine whether the use of both FTBlow and FTBhigh improved performance, we first used the Youden index to determine the percentage values that yielded the best sensitivity and specificity; then, we assigned a score of zero for cases that did not meet both conditions and a score of 1 for those that did. We subsequently used the Fisher exact test to assess significance between the groups and determined the sensitivity and specificity for this method. A P < .05 was considered statistically significant for all analyses.
For analysis of the qualitative data, we included only the 44 evaluated patients and excluded the 3 sample patients. The intraclass correlation coefficient (ICC) was used to assess agreement among the 5 raters for FTB interpretation and the decision to change treatment based on FTB. Agreement between the consensus scores for FTB interpretation and actual histopathologic diagnosis and between hypothetic and real-time treatment changes was also assessed with the ICC, using the following model of ICC interpretation: <0.40, poor; 0.40-0.75, fair-to-good; ≥0.75, excellent.18
All statistical analyses were performed with R statistical and computing software (Version 3.4.0; http://www.r-project.org/); graphs were created with GraphPad Prism software for illustrative purposes (Version 8.0.1; GraphPad Software, San Diego, California).
Results
Patients
Table 1 summarizes patient demographics and histopathologic and molecular tumor information. Seven patients underwent a biopsy, while 40 had a resection (12 had >90% and 28 had gross total resection). Averages of 5 (range, 1-12) and 6 (range, 1-16) representative sections per the entire volume of submitted tissue specimen were analyzed in the biopsy and resection groups, respectively. On the basis of histopathologic examination, 17 were classified as TE (consisting of 4 samples with no tumor cells and 13 with scattered infiltrating atypical cells), and 30, as recurrent tumor.
Patient demographics and clinicopathologic informationa
Quantitative FTB and rCBV
Differences in mean FTBlow, FTBhigh, and rCBV of the contrast-enhancing lesion volume were significant between TE and tumor (P = .002, <.001, and <.001, respectively), with tumor having higher FTBhigh and rCBV and lower FTBlow than TE (Table 2 and Fig 2). No significance was found with FTBmid (P = .16).
Mean values of FTB classes and normalized rCBV in histopathologically defined treatment effect and tumor groupsa
Areas under the receiver operating characteristic curve for using FTB and rCBV to distinguish TE and tumor were the following: 0.77 for FTBlow (95% CI, 0.64-0.90; P = .002), 0.63 for FTBmid (95% CI, 0.44-0.81; P = .16), 0.85 for FTBhigh (95% CI, 0.74-0.97; P < .001), and 0.81 for rCBV (95% CI, 0.69-0.94; P < .001) (Fig 3). The FTBhigh cut-point of >24.9% yielded a sensitivity of 80% and a specificity of 82%, and the FTBlow cut-point of <28.5% yielded a sensitivity of 50% and specificity of 94% for tumor prediction. The use of both cut-points showed significance in differentiating tumor from TE (P < .001), with a sensitivity of 100% and specificity of 47%. The optimal rCBV cut-point for identifying tumor was found to be >1.53, yielding a sensitivity of 70% and specificity of 88%.
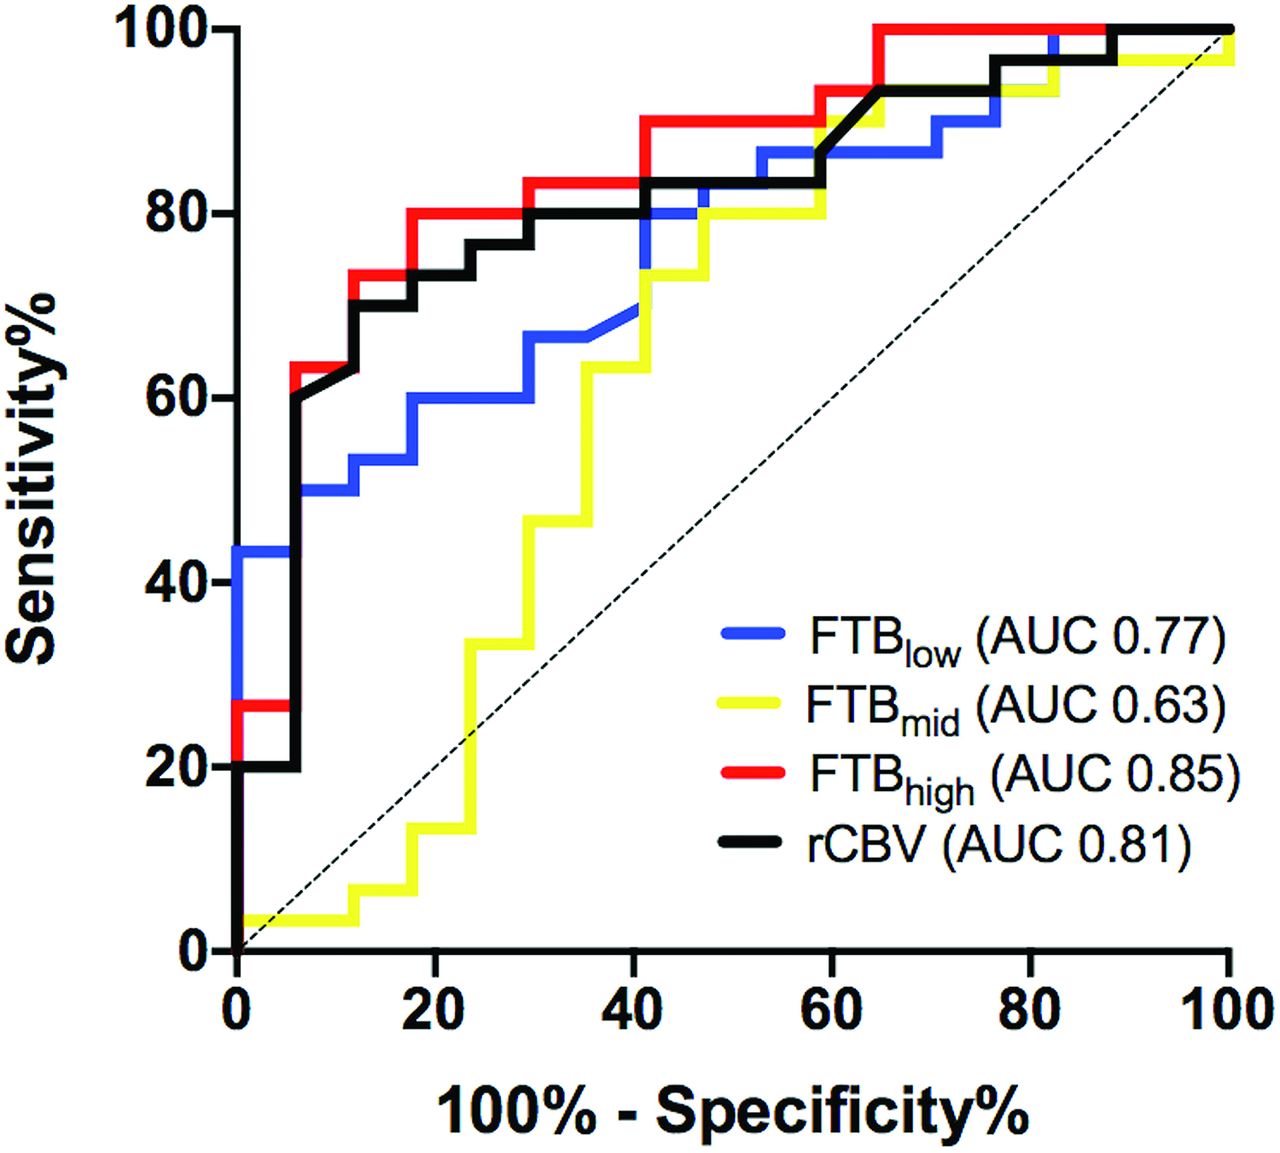
Receiver operating characteristic curves for the use of fractional tumor burden classes and normalized rCBV to differentiate tumor from treatment effect.
Qualitative Analysis
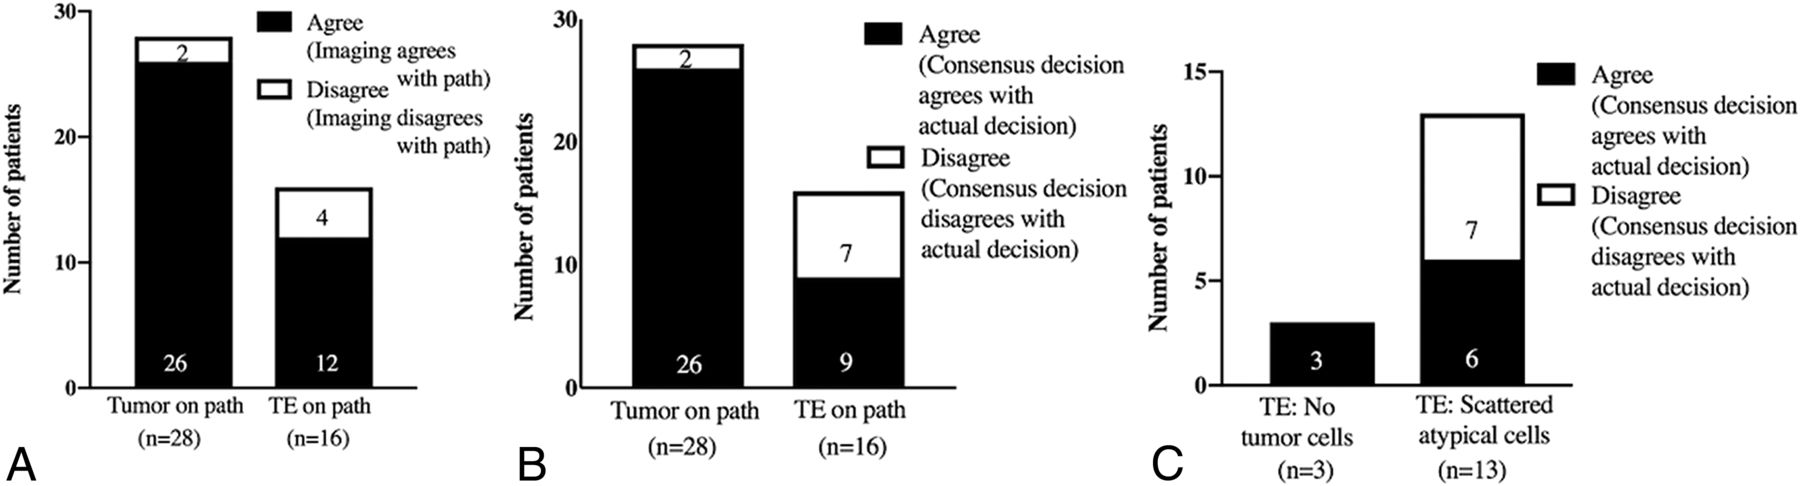
Agreement among the 5 physicians for the use of FTB to differentiate TE from tumor was fair-to-good (ICC = 0.48). When we compared the consensus decision with the actual histopathology, agreement improved (ICC = 0.70). Of the total number of cases with histopathologically confirmed tumor (n = 28) and TE (n = 16), there were disagreements in 7% (2/28) of tumor and 25% (4/16) of TE cases (Fig 4A).

Agreement between the consensus (among 5 physician raters) qualitative interpretation of imaging and the actual histopathologic diagnosis (A). Agreement between the hypothetic consensus decision to change treatment plans and the actual (real-time) management plans (B and C).
Agreement among the raters when asked whether they would hypothetically change treatment on the basis of their interpretation of FTB was fair-to-good (ICC = 0.48). The consensus decision was to hypothetically change treatment in 93% (26/28) of tumor cases and not to change treatment in 75% (12/16) of TE cases. When we compared the consensus decision with the actual treatment plan, agreement was fair-to-good (ICC = 0.46). Of the histopathologically confirmed tumor and TE groups, there were disagreements in 7% (2/28) of tumor and 44% (7/16) of TE cases (Fig 4B). In this latter TE group, all disagreements occurred in cases in which the surgical specimen showed scattered atypical cells and none in which the specimen showed no tumor cells (Fig 4C).
Discussion
Our results show that the use of 2 rCBV thresholds to define low and high fractional tumor burden of the contrast-enhancing volume allows differentiation of tumor and TE in the recurrent glioblastoma setting. Of the 3 FTB classes and rCBV parameters, FTBhigh performed the best for this task. In addition, we found good consensus agreement among 5 physicians for the use of FTB to differentiate TE from tumor and to inform potential treatment-related decision-making.
Given the variability of previously published mean rCBV thresholds to differentiate TE from tumor (with a reported range of 0.9-2.15 based on a recent meta-analysis),6 we selected predefined values on the low and high ends of the range to define fractions of the contrast-enhancing volume with low and high blood volume, respectively. On the basis of prior radiology-pathology correlative studies, areas of TE tend to have low blood volume and areas of tumor tend to have high blood volume on perfusion MR imaging.2,3,19 We did not generate the optimal thresholds to use from our own dataset (to minimize institutional bias in generating the values) and opted to use values that have been tested or validated in prior studies: On the low end of the rCBV range, a threshold of 1.0 has been used to reliably distinguish TE and tumor,2,3 and on the high end, a threshold of 1.75 has been used to identify aggressive tumors.8,10 In our study, the use of 2 thresholds allowed the delineation of 3 FTB classes; we found that TE had significantly higher FTBlow than tumor and that tumor had significantly higher FTBhigh than TE. In comparing these metrics, FTBhigh performed better than FTBlow for tumor identification. The use of both FTBhigh and FTBlow percentage cut-points improved the sensitivity of tumor diagnosis to 100%, but specificity remained low. We postulate that FTBhigh is a more robust marker than FTBlow due to tumoral heterogeneity, in which previously treated tumors can have regional and interspersed areas of both high and low blood volume, presumably related to varying degrees of angiogenesis and necrosis, respectively.20 In contrast, areas of pure TE and radiation necrosis tend to consistently show low blood volume.21 Sampling error, which is further discussed in the limitations, may also help to explain the lower specificity found in this study. FTBmid, which includes all rCBV values between 1.0 and 1.75, did not reliably differentiate TE from tumor, likely because of overlapping values in this range found in samples with both TE and tumor, which is consistent with findings in the study of Barajas et al.20 Nonetheless, a strength of using FTB is that it is less dependent on the magnitude of rCBV values, except to classify voxels within a FTB class, and it has been shown to better approximate tumor volume fraction.2
We did not correlate perfusion results with prognostic clinical end points such as overall survival because there were insufficient patient numbers to perform a meaningful analysis. Rather, we assessed whether FTB data could be used to predict the histopathologic diagnosis and inform short-term management plans. Agreement between the consensus assessment of disease based on FTB and the actual histopathologic diagnosis was good. In keeping with the imaging interpretation, the consensus decision was to hypothetically change treatment in 93% (26/28) of tumor cases and not to change treatment in 75% (12/16) of TE cases. This is in the context of all patients undergoing surgical intervention in real-time because of concerns for tumor progression at the time of the clinical MR imaging and suggests the potential role of this approach to help triage patients who may or may not need an operation for diagnosis. Most of the disagreement in treatment changes occurred in the histopathologically defined TE group; upon further analysis, all disagreements in this group occurred in cases in which histopathology showed scattered atypical cells. This may be because, in real-time, the decision to change treatment considered the uncertainty of whether the atypical cells represented radiation-related change or treated-but-viable glioma cells and other clinical factors (such as patient age, Karnofsky Performance Status Scale, tumor molecular status, and patient desires) that were not incorporated in our study. Nonetheless, our findings are in keeping with those of Geer et al,22 who showed that the addition of DSC and arterial spin-labeling perfusion imaging impacted and changed management plans in 8.5% (5/59) of patient care episodes and significantly increased physician confidence in treatment plans. In contrast to that study, which included only qualitative image interpretation, we show the potential of a combined approach using quantitative and qualitative data to inform treatment-related decision-making.
Limitations of this study should be considered. First, the retrospective nature of this study consisting of a single institutional dataset and small sample size limits the generalizability of our results. Second, acquisition of DSC-MR imaging during the study period was performed without preload dosing, which can confound rCBV estimates.7,23 Of note, Hu et al5 showed that the use of IB Neuro software, which was used in this study, generated rCBV metrics, including FTB, that were highly correlated even between nonpreload- and preload dose-corrected conditions. Schmainda et al15 also recently showed that DSC imaging using a low flip angle (30°) and no preload dose produces rCBV values similar to those of the conventional method of using an intermediate flip angle (60°) with preload and postprocessing leakage correction. Third, misregistration of VOIs due to geometric distortion in DSC is another potential source of error. Finally and most important, we used histopathologic examination of available tissue specimens from both surgical resection and, to a smaller extent, biopsies for ground truth diagnoses. Although we evaluated different representative sections of the entire submitted samples to determine a diagnosis, we could not provide histopathologic correlation for every voxel of the contrast-enhancing volume available on FTB. Because glioblastomas are markedly heterogeneous tumors, histopathologic diagnosis of samples from separate locations may differ; even with a given sample, and diagnostic agreement among pathologists can vary.24 However, despite the real possibility of sampling error, histopathologic assessment remains the “criterion standard” for determining disease status and often influences treatment-related decision-making. Taking these issues into consideration, we show the potential of FTB to distinguish TE and tumor, and we have yet to fully explore its role as an alternative means to provide accurate diagnostic and prognostic information, particularly given the limitations of histopathologic evaluation.
Conclusions
The use of 2 rCBV thresholds (1.0 and 1.75) to define FTBlow and FTBhigh provided good spatial visualization and quantification of contrast-enhancing volume fraction with low and high blood volume, respectively, and they performed well to differentiate tumor from TE in the recurrent-glioblastoma setting. In addition, combining qualitative image interpretation with quantitative FTB data can help inform clinical decision-making, with such decisions closely mirroring actual treatment decisions made for groups with histopathologically confirmed tumor and no tumor cells. Larger prospective studies, however, are needed to validate this method for use in real-time clinical decision-making and for correlation with important clinical outcomes.
Disclosures: Scott G. Soltys—UNRELATED: Consultancy: Inovio Pharmaceuticals. Lawrence Recht—UNRELATED: Employment: ????????; 1952.[fn_type;disclosure]
Footnotes
Michael Iv and Xiaobai Liu are co-first authors and contributed equally to this work.
References
- Received May 9, 2019.
- Accepted after revision August 1, 2019.
- © 2019 by American Journal of Neuroradiology


Jump to section
Related Articles
Cited By...
- Identification of a Single-Dose, Low-Flip-Angle-Based CBV Threshold for Fractional Tumor Burden Mapping in Recurrent Glioblastoma
- Arterial Spin-Labeling and DSC Perfusion Metrics Improve Agreement in Neuroradiologists Clinical Interpretations of Posttreatment High-Grade Glioma Surveillance MR Imaging--An Institutional Experience
- DSC Perfusion MRI-Derived Fractional Tumor Burden and Relative CBV Differentiate Tumor Progression and Radiation Necrosis in Brain Metastases Treated with Stereotactic Radiosurgery
- Performance of Standardized Relative CBV for Quantifying Regional Histologic Tumor Burden in Recurrent High-Grade Glioma: Comparison against Normalized Relative CBV Using Image-Localized Stereotactic Biopsies