
Abstract
BACKGROUND AND PURPOSE: Differences in molecular properties between one-molar and half-molar gadolinium-based contrast agents are thought to affect parameters obtained from dynamic contrast-enhanced imaging. The aim of our study was to investigate differences in dynamic contrast-enhanced parameters between one-molar nonionic gadobutrol and half-molar ionic gadoterate meglumine in patients with posttreatment glioma.
MATERIALS AND METHODS: This prospective study enrolled 32 patients who underwent 2 20-minute dynamic contrast-enhanced examinations, one with gadobutrol and one with gadoterate meglumine. The model-free parameter of area under the signal intensity curve from 30 to 1100 seconds and the Tofts model–based pharmacokinetic parameters were calculated and compared intraindividually using paired t tests. Patients were further divided into progression (n = 12) and stable (n = 20) groups, which were compared using Student t tests.
RESULTS: Gadobutrol and gadoterate meglumine did not show any significant differences in the area under the signal intensity curve or pharmacokinetic parameters of Ktrans, Ve, Vp, or Kep (all P > .05). Gadobutrol showed a significantly higher mean wash-in rate (0.83 ± 0.64 versus 0.29 ± 0.63, P = .013) and a significantly lower mean washout rate (0.001 ± 0.0001 versus 0.002 ± 0.002, P = .02) than gadoterate meglumine. Trends toward higher area under the curve, Ktrans, Ve, Vp, wash-in, and washout rates and lower Kep were observed in the progression group in comparison with the treatment-related-change group, regardless of the contrast agent used.
CONCLUSIONS: Model-free and pharmacokinetic parameters did not show any significant differences between the 2 gadolinium-based contrast agents, except for a higher wash-in rate with gadobutrol and a higher washout rate with gadoterate meglumine, supporting the interchangeable use of gadolinium-based contrast agents for dynamic contrast-enhanced imaging in patients with posttreatment glioma.
ABBREVIATIONS:
- DCE
- dynamic contrast-enhanced
- CE
- contrast-enhanced
- GBCA
- gadolinium-based contrast agent
- IAUC
- initial area under the time-to-signal intensity curve
- Kep
- rate transfer constant
- Ktrans
- volume transfer constant
- Ve
- extravascular-extracellular space per unit volume of tissue
- Vp
- blood plasma volume per unit volume of tissue
- WHO
- World Health Organization
In the evaluation of brain tumors on MR imaging, the interpretation of vascular permeability is important because an insufficient blood supply may be related to resistance to chemotherapy or immunotherapy owing to poor and heterogeneous uptake of the therapeutic agents.1,2 Dynamic contrast-enhanced (DCE) T1-weighted perfusion MR imaging, which involves the acquisition of serial images after the administration of a gadolinium-based contrast agent (GBCA), has demonstrated considerable utility for assessing tumor perfusion, vessel permeability, and the volume of the extravascular-extracellular space.3 DCE imaging is widely used for brain tumor imaging and is a useful noninvasive method for monitoring treatment response.4⇓-6
The relationship between the MR signal intensity of a voxel on DCE-MR imaging and the actual concentration of GBCA is complex, with the measured tissue relaxivity depending on the flip angle, TR, proton density, and precontrast tissue relaxivity.7 To date, both half-molar and one-molar GBCAs have been interchangeably used as DCE imaging agents.8⇓⇓⇓-12 The GBCA-induced signal enhancement depends on 3 factors:13⇓⇓-16 1) the T1 relativity of GBCA, 2) the concentration of GBCA in the ROI, and 3) certain tissue-specific characteristics such as tissue perfusion and extracellular blood volume. Regarding T1 relaxivity, gadobutrol (gadolinium-DO3A-butrol; Gadovist 1.0; Bayer Schering Pharma) is a 1.0 mmol/mL gadolinium chelate agent with approximately 14%–27% higher T1 relaxivity than half-molar GBCAs on 3T MR imaging.17,18 The concentration of GBCA in the ROI is determined by the interactions between the contrast agent molecules and tissues, and the nonionic property of gadobutrol is thought to affect tissue interactions and accumulation rates in a manner different from those of ionic GBCAs.13,14 Glioma is rich in negatively-charged glycosaminoglycans,19⇓-21 and differences in ionic properties between gadobutrol and gadoterate meglumine (Dotarem; Guerbet), may affect model-free or quantitative pharmacokinetic DCE parameters; however, there is a lack of studies comparing the 2 types of GBCA in DCE imaging, with the 2 types having been used interchangeably to date.
Thus, the aim of our study was to investigate differences in DCE parameters between one-molar nonionic gadobutrol and half-molar ionic gadoterate meglumine in patients with posttreatment glioma, evaluating both model-free and pharmacokinetic quantifications. On a theoretic basis, the higher T1 relaxivity of gadobutrol may provide excellent wash-in characteristics, and its nonionic nature may enable longer retention of the contrast media in tissue with a high negatively-charged content, resulting in higher contrast-related signal in delayed phases of contrast-enhanced imaging in comparison with ionic half-molar agents. We, therefore, used a prolonged DCE acquisition of 20 minutes to ensure sufficient observation of wash-in and washout patterns.
MATERIALS AND METHODS
Study Patients
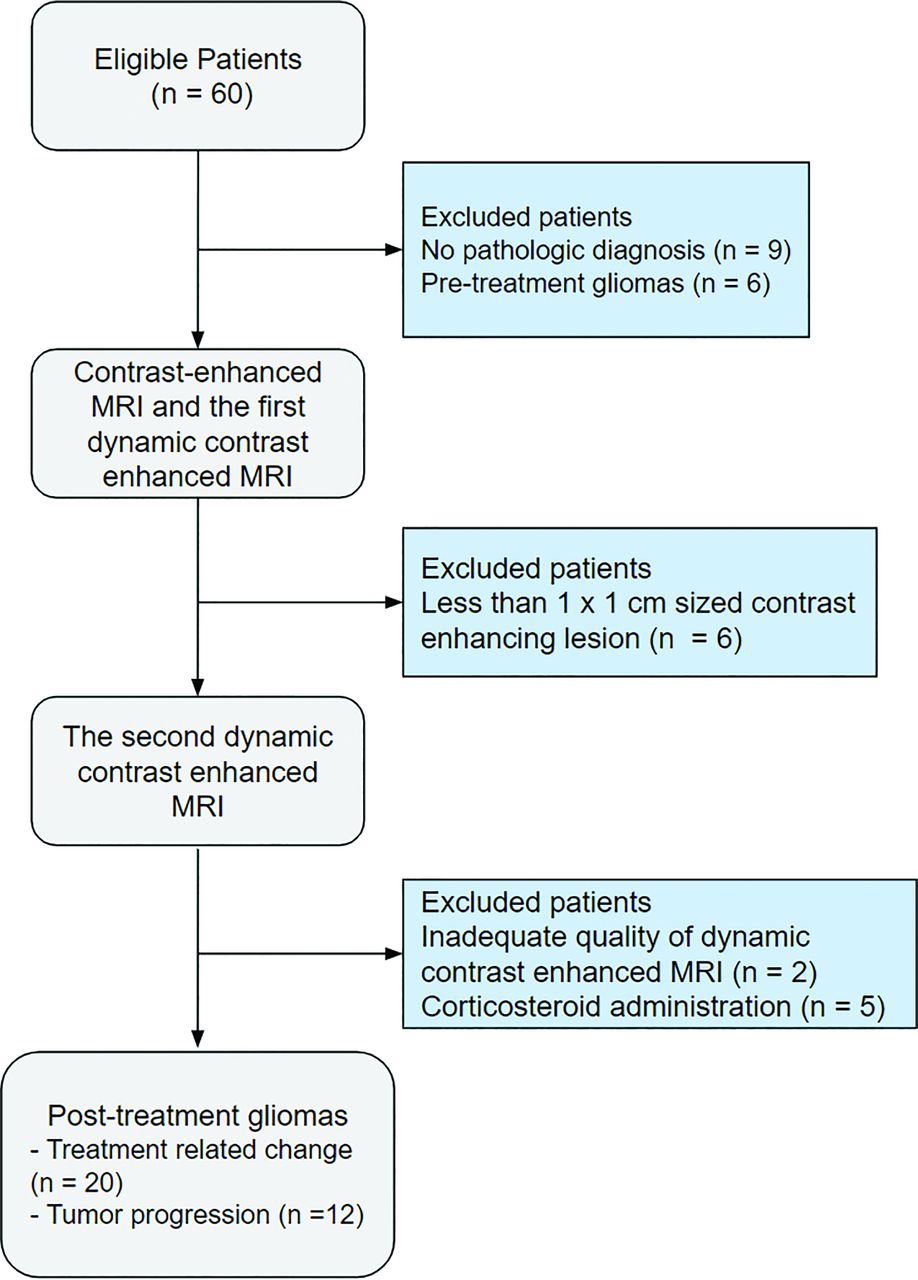
This prospective study was designed as an intraindividual comparison within a clinical cohort of patients with posttreatment glioma recruited between March 2017 and March 2019 and was approved by the institutional review board of our tertiary hospital (Asan Medical Center, Seoul, South Korea; institutional review board approval No: 2017-0003). Written informed consent was obtained from each patient. A flow diagram of the recruitment of study participants is shown in Fig 1. Patients with brain gliomas who were allocated for contrast-enhanced (CE) T1-weighted imaging and DCE imaging were potentially eligible. The detailed inclusion criteria for the current study were as follows: 1) histopathologic diagnosis of glioma according to the 2016 World Health Organization (WHO) criteria; 22 2) received standard treatment of radiation and chemotherapy (ie, for glioblastoma, concurrent chemoradiotherapy with temozolomide and 6 cycles of adjuvant temozolomide administered after surgical resection or biopsy); 3) a measurable contrast-enhancing lesion of more than 1 × 1 cm on CE-T1WI; 4) no corticosteroid administration within 1 week before DCE imaging; and 5) an image acquisition deemed to be of adequate quality without motion artifacts. The rationale for avoiding a certain period of corticosteroid administration was to avoid the possibility of corticosteroid-induced regression of the tumor.23

Flow diagram of the participant inclusion process.
Patients were excluded when there was no pathologic diagnosis (n = 9), pre-treatment gliomas (n = 6), no visible measurable measurable contrast-enhancing lesion on CE-T1WI (n = 6), or when the image quality was deemed inadequate (n = 2). Patients who received corticosteroid treatment (n = 5) were further excluded. A total of 32 patients (median age, 58 years; age range, 21–76 years; 19 [59.3%] male patients) with posttreatment gliomas were finally included in the study. The clinical characteristics of the patients, including sex, age, extent of surgical treatment for the tumor (gross total resection, partial resection, or biopsy), and pathologic confirmation, were collected from medical records.
MR Imaging Protocol
All MR imaging studies were performed on a 3T unit (Achieva; Philips Healthcare) using an 8-channel head coil. Two DCE imaging examinations were acquired from each patient, with an interval of at least 12 hours between each session. The order of gadobutrol and gadoterate meglumine administration was randomly chosen for each patient. The first session involved acquisition of our dedicated MR imaging protocol for brain tumors, which consisted of T2WI, FLAIR, T1WI, diffusion-weighted imaging, CE-T1WI, and DCE imaging.
DCE imaging was performed using a 3D gradient-echo sequence with 21 slices, with imaging volumes being obtained after administration of a standard dose of GBCA. Because the one-molar nonionic agent gadobutrol (Gadovist 1.0) is provided at twice the gadolinium concentration of the half-molar ionic gadoterate meglumine (Dotarem), 0.05 mmol (0.1 mL)/kg of body weight (average total volume, 5.8 mL; range, 4–7 mL) of gadobutrol was delivered at a rate of 2 mL/s using an MR imaging–compatible power injector (Spectris; MedRad), whereas 0.1 mmol (0.2 mL)/kg of body weight (average total volume, 13.7 mL; range, 12–15 mL) of gadoterate meglumine was delivered at a rate of 4 mL/s. The temporal resolution was 3.22 seconds, and the contrast material was administered after 10 baseline dynamics. The parameters for the DCE perfusion imaging included section thickness, 4 mm with no gap; TR/TE, 6.4/3.1 ms; flip angle, 15°; FOV, 24 × 24 cm; and matrix, 184 × 186. The total acquisition time for DCE imaging was 18 minutes 40 seconds.
After DCE imaging, CE-T1WI was performed for anatomic reference using a 3D gradient-echo T1-weighted sequence with the following parameters: TR/TE, 9.9/4.6 ms; flip angle, 8°; FOV, 22.4 × 22.4 cm; matrix, 224 × 224; and section thickness, 1 mm with no gap.
Image Registration and Processing
All imaging data were transferred from the MR imaging scanner to an independent computer for quantitative perfusion analysis. For quantitative analysis, contrast-enhancing lesion volumes were segmented on the CE-T1WI using a semiautomated adaptive thresholding technique to select all pixels above a determined threshold value. The resulting segmentation of the entire enhancing tumor was verified by an experienced neuroradiologist (J.E.P., with 7 years of experience in neuro-oncology imaging), who was blinded to the clinical information.
For the DCE imaging, motion correction was performed using rigid-body registration to realign each time point of the time-series. The CE-T1WI was coregistered to the DCE images using an affine transformation with 6 df and fourth-degree B-spline interpolation performed using SPM12 (http://www.fil.ion.ucl.ac.uk/spm/software/spm12).
The model-free parameters were obtained using Matlab 2019b (MathWorks). The signal intensity was normalized into its percentage change compared with the baseline signal intensity value, and then the initial area under the signal intensity time curve (IAUC) at 30, 100, 200, 300, 400, 500, 600, 700, 800, 900, 1000, and 1100 seconds was calculated for each patient using trapezoidal integration of the normalized signal intensity after the contrast agent arrived in the voxel of interest. Outlier values were automatically removed from the output maps because these can occur due to unstable curve-fitting conditions with a noisy input signal.
The pharmacokinetic parameters were obtained using a dedicated software package (nordicICE; NordicNeuroLab) based on the 2-compartment model proposed by Tofts and Kermode.24 The parameters included volume transfer constant (Ktrans), rate transfer constant (Kep), blood plasma volume per unit volume of tissue (Vp), and extravascular-extracellular space per unit volume of tissue (Ve). The wash‐in rate was calculated as the maximum slope between the time of onset of contrast inflow and the time of peak enhancement on the time-intensity curve. The washout rate was calculated as the negative slope of the late part of the exponential curve. Each parameter was calculated using a fixed T1 of 1000 ms, because this can contribute to more reliable results and protect the dynamic data from patient movement or inaccurate scaling factors occurring during the DCE imaging acquisition.25,26
The arterial input function was selected by a neuroradiologist (J.Y.K., with 2 years of experience in neuro-oncology imaging), who was blinded to the clinical information of the study subject, using an ROI confined to the vertical portion of the superior sagittal sinus, which avoided problems of feeding veins causing mixed artifacts in the same image section.
Reference Standard for Tumor Progression and Treatment-Related Change
A final diagnosis of tumor progression or treatment-related change was confirmed pathologically in second-look operations when clinically indicated. When second-look operations were not performed, tumor progression on MR imaging was assessed according to the Response Assessment in Neuro-Oncology criteria,27 using serial measures of the product of the 2 largest cross-sectional diameters. The consecutive clinicoradiologic diagnoses were made by consensus between a neuro-oncologist (J.H.K, with 26 years of experience in neuro-oncology practice) and a neuroradiologist (H.S.K., with 21 years of experience in neuro-oncologic imaging) after complete imaging and medical chart review.27
Statistical Analysis
Sample Size.
The sample size of our study was determined according to power analysis for paired-means analysis, which was performed using Power Analysis Software (PASS, Version 15.0.7; https://www.ncss.com/download/pass/updates/pass15/). We used data on the distribution of the IAUC30 parameter from a previous study,28 which showed mean values of 15.73 ± 2.76 in recurrent glioblastoma and 7.31 ± 3.59 in radiation necrosis, with a meaningful difference between the 2 contrast agents being indicated by a difference of >8.0. The null hypothesis was that there was no difference in the mean of the paired differences of IAUC30 between the 2 contrast agents. A sample size of 32 would achieve 100% power to detect a mean paired difference of 8.0 with an estimated SD of differences of 7.0 with a significance level (α) of .05 using a 2-sided paired t test. This represents significance in a 2-sided Z-test (P < .05). Thus, the sample size of 32 was sufficient to detect meaningful differences in the 2 contrast agents that would affect the clinical diagnosis of recurrent glioblastoma or radiation necrosis.
DCE parameters were initially assessed for normality using the Shapiro-Wilk test. The DCE parameters were found to be normal and were then expressed as mean ± SD. Paired t tests were used to assess intraindividual differences in the DCE parameters between the 2 GBCAs.
The Student t test and χ2 test were used for comparisons of clinical and demographic characteristics between tumor progression and treatment-related change. Differences in DCE parameters between tumor progression and treatment-related-change groups were assessed using the Student t test.
All statistical analyses were performed using SPSS, Version 21 (IBM) and MedCalc, Version 18.2.1 (MedCalc Software). A P value < .05 was considered statistically significant.
RESULTS
Patient Demographics
Of the 32 study patients, 19 were pathologically confirmed with glioblastoma (WHO grade IV); and 13, with lower-grade astrocytomas (5 with WHO grade II and 8 with grade III; Table 1). There were no differences in age, sex, extent of surgery, and postoperative adjuvant chemotherapy status between the 2 groups.
Clinical information of the enrolled patients with gliomaa
Comparison of DCE Parameters between Gadobutrol and Gadoterate Meglumine
Table 2 summarizes the comparisons of model-free and pharmacokinetic parameters. When the model-free DCE parameters were compared, gadobutrol showed a trend for a higher rate of relative contrast enhancement compared with gadoterate meglumine, but there was no significant difference in the IAUC 30, 100, 200, 300, 400, 500, 600, 700, 800, 900, 1000, and 1100 seconds (paired t test, all P > .05).
Intraindividual comparison of model-free and pharmacokinetic parameters between gadobutrol and gadoterate meglumine dynamic contrast-enhanced MR imaginga
The pharmacokinetic parameters of Ktrans, Ve, Vp, and Kep also showed no significant differences between the 2 contrast agents (paired t test, all P > .05). However, gadobutrol showed a significantly higher mean wash-in rate (0.825 ± 0.644 versus 0.289 ± 0.634, P = .013) and a significantly lower mean washout rate (0.001 ± 0.0001 versus 0.002 ± 0.002, P = . 02) than gadoterate meglumine. Figures 2 and 3 show representative cases in patients with tumor progression and treatment-related change, exhibiting differences in wash-in and washout rates.
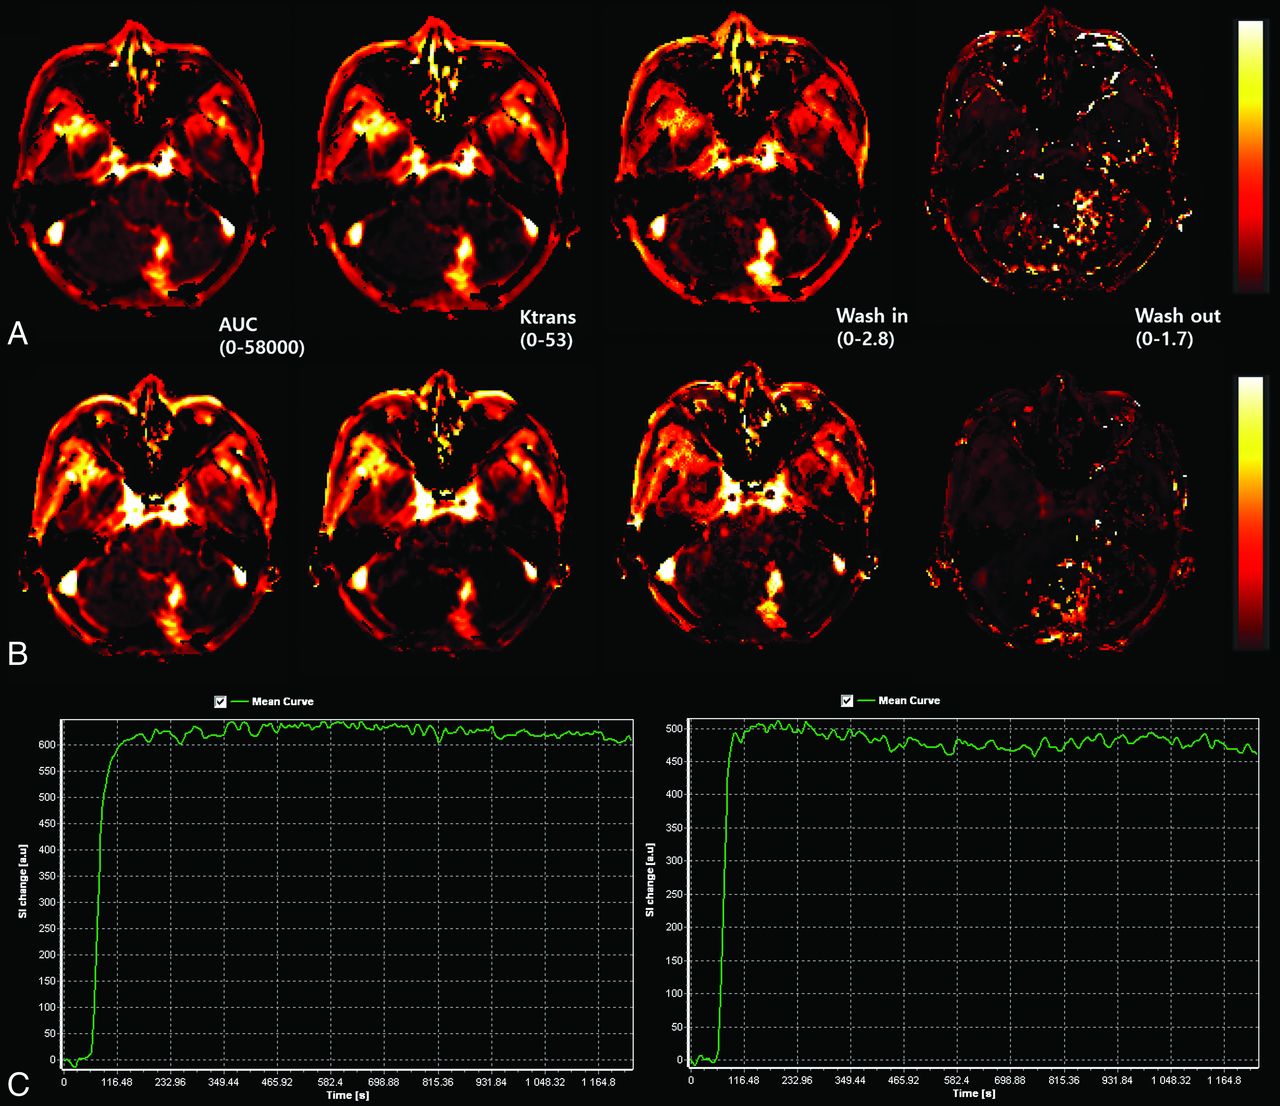
A 62-year-old female patient with posttreatment glioblastoma at 15 weeks after concurrent chemoradiotherapy exhibits a contrast-enhancing mass on DCE imaging with gadobutrol (A, upper row) and gadoterate meglumine (B, lower row). The Ktrans, IAUC 30, Kep, Ve, Vp, and dynamic curve show similar patterns and values. Wash-in and washout maps show differences between the 2 gadolinium-based contrast agents. The patient was diagnosed with tumor progression. C, The time-to-signal intensity curves (left: gadobutrol and right: gadoterate meglumine) are shown for both contrast agents. SI indicates signal intensity.

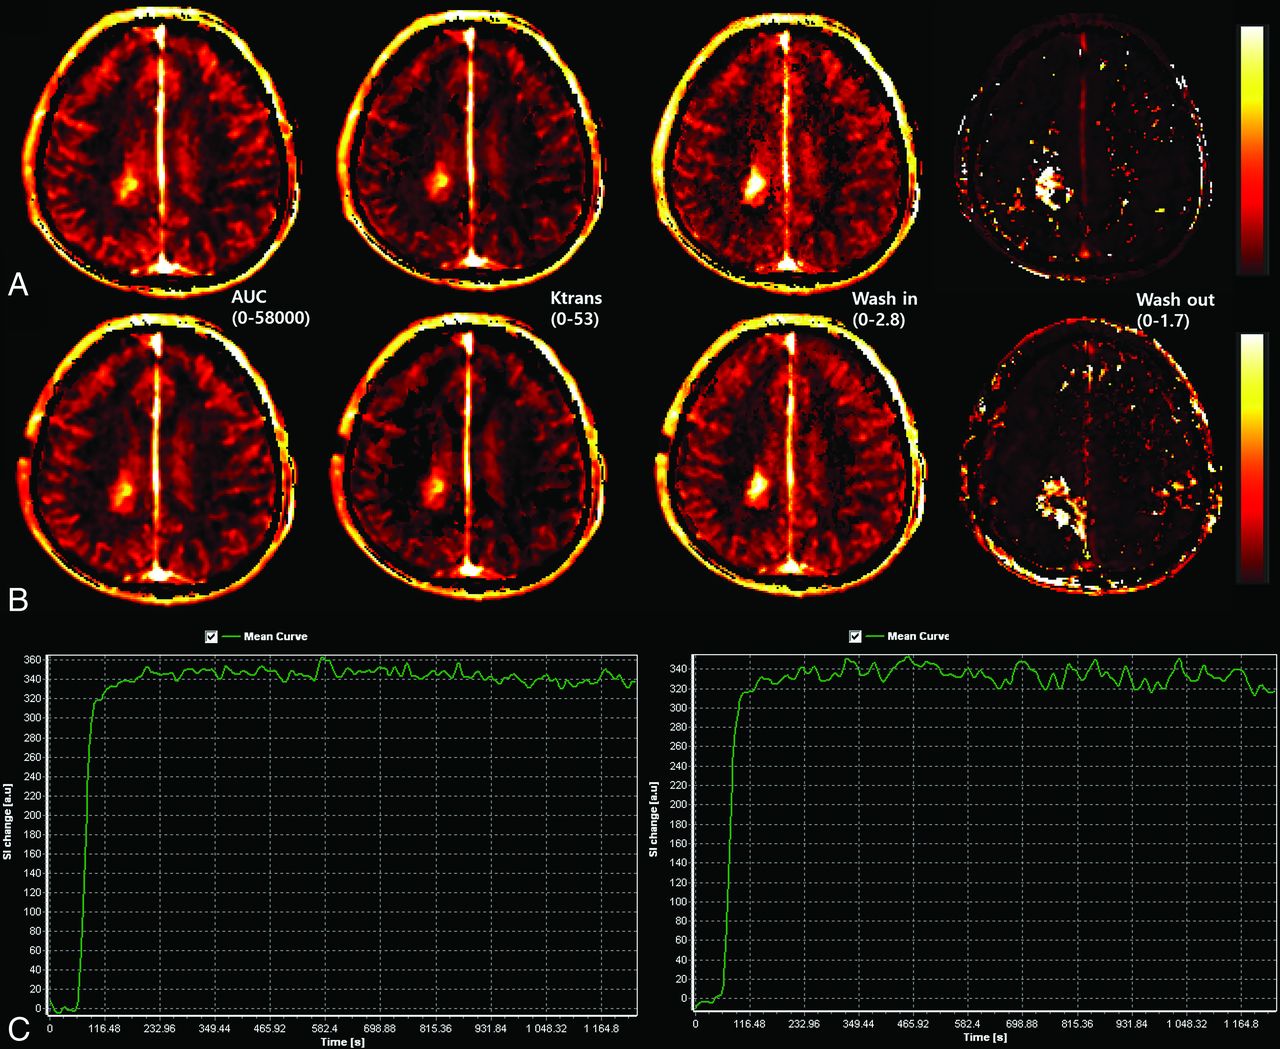
A 55-year-old female patient with posttreatment glioblastoma at 15 weeks after concurrent chemoradiotherapy exhibits a contrast-enhancing mass on DCE imaging with gadobutrol (A, upper row) and gadoterate meglumine (B, lower row). The Ktrans, IAUC 30, Kep, Ve, Vp, and dynamic curve show similar patterns and values. Wash-in and washout maps show differences between the 2 gadolinium-based contrast agents. The patient was diagnosed with treatment-related change. C, The time-to-signal intensity curves (left: gadobutrol and right: gadoterate meglumine) are shown for both contrast agents. SI indicates signal intensity.
Subgroup Analysis between Tumor Progression and Treatment-Related Change in DCE Parameters
Table 3 summarizes the comparisons of DCE parameters between the tumor-progression and treatment-related-change groups. The higher wash-in and lower washout rates with gadobutrol compared with gadoterate meglumine were maintained in the tumor-progression and treatment-related-change subgroups, with the higher mean wash-in rate with gadobutrol being especially notable in the treatment-related-change group (0.813 ± 0.521 versus 0.220 ± 0.590, P = .002). The progression group showed trends toward higher areas under the curve, Ktrans, Ve, Vp, wash-in and washout rates, and lower Kep in comparison with the treatment-related-change group, regardless of the GBCA type, though the differences did not reach statistical significance.
Intraindividual comparisons of model-free and pharmacokinetic parameters between stable and progression posttreatment glioma groupsa
DISCUSSION
We compared gadobutrol with gadoterate meglumine on an intraindividual basis to investigate whether model-free and pharmacokinetic parameters from DCE imaging were affected by differences between one-molar nonionic gadobutrol and half-molar ionic gadoterate meglumine. Gadobutrol had a significantly higher wash-in rate and a lower washout rate compared with gadoterate meglumine. However, neither the model-free parameters obtained from relative signal change nor the pharmacokinetic parameters of Ktrans, Ve, Vp, or Kep showed any significant difference between the 2 GBCAs. Both GBCAs showed the same trends of higher leakage parameter values, except for the comparison of Kep between the tumor progression group and the treatment-related-change group, though the 2 GBCAs showed no significant difference between the 2 groups. Our results support the current notion that one-molar nonionic gadobutrol and half-molar ionic gadoterate meglumine can be used interchangeably for DCE imaging in patients with posttreatment gliomas.
Using pharmacokinetic parameters, previous studies found that treatment-related change demonstrated lower Ktrans, Ve, and Vp than tumor progression, especially in glioblastoma.29,30 The diagnostic utility of the model-free parameters of IAUC at 30 and 60 seconds was also previously demonstrated.28,31⇓⇓-34 Recently, standardization of the DCE image-processing method has been pursued,12 with a method involving 2-compartment pharmacokinetic modeling with patient-specific baseline T1 maps and a vascular input function taken from the superior sagittal sinus. Nonetheless, GBCA use has not been standardized, and there are only limited reports comparing DCE patterns between one-molar and half-molar gadolinium-based contrast agents.16,35⇓⇓⇓⇓-40
Whereas some authors reported that gadobutrol resulted in an increase in diagnostic accuracy for detecting prostate cancer in comparison with half-molar GBCAs,41 other studies16,42⇓-44 performed on different organs did not show significant diagnostic benefits with gadobutrol. A recent in vitro study comparing gadobutrol and other half-molar GBCAs in various body regions showed significant differences in signal enhancement among body regions.15 The highest amplitude of signal enhancement was observed in the blood, followed by well-perfused organs such as the spleen, liver, tongue, and prostate, whereas much lower signal intensity was observed in extremity muscle and only minor signal changes were detected in brain tissue, probably attributable to the blood-brain barrier.15 Our results indicate that it is unlikely that there would be any significant difference between one-molar nonionic gadobutrol and half-molar ionic gadoterate meglumine when they are used to establish clinical diagnoses or management plans in patients with posttreatment glioma. Our study has value in that it performed a direct head-to-head comparison between one- and half-molar GBCA, and our results imply that the 2 GBCA types can be used interchangeably for most of the DCE parameters, thereby supporting the standardization of DCE imaging in patients with posttreatment glioma.
Both gadobutrol and gadoterate meglumine are macrocyclic gadolinium agents and are known to be safer than linear gadolinium agents because of their higher kinetic stability.17,45,46 Many studies have shown that contrast agents with higher T1 relaxivity result in stronger contrast enhancement than those with lower T1 relaxivity.16,35,36,47 The combined properties of higher gadolinium concentration and T1 relaxivity obtained with gadobutrol could have resulted in a significantly higher wash-in rate calculated by the pharmacokinetic method in comparison with gadoterate meglumine; however, the model-free method with calculation of the IAUC is a robust and simple indicator of tumor vascular characteristics,48 and the IAUCs did not show any significant difference between the 2 GBCAs. We, therefore, suggest that the results can be interpreted without having to consider the molarity of the GBCA.
Our finding of a difference in the washout rate is in accord with previous studies in the breast, which demonstrated slower washout of gadobutrol than gadoterate meglumine.16,36 The difference might be attributable to the difference in ionic properties between the 2 contrast agents, with the higher washout rate of gadoterate meglumine reflecting its lower accumulation in the extravascular extracellular space compared with gadobutrol. A previous DCE study of cartilage14 showed that a nonionic neutral agent revealed diffuse contrast enhancement independent of glycosaminoglycan concentration, while a negatively charged ionic agent showed a negative correlation between signal enhancement and the concentration of glycosaminoglycan. This effect was explained by electrostatic repulsion between the ionic contrast agent and the negatively charged glycosaminoglycan-rich extravascular-extracellular space.14 The extravascular-extracellular space of gliomas is glycosaminoglycan-rich,19⇓-21 which may have contributed to the faster washout of the ionic contrast agent compared with the nonionic agent.
Several limitations to this study should be noted. First, because of the small sample size of the prospective cohort, the statistical power of our data, especially in the tumor-progression group, might be limited. Second, although our study result does not suggest any recommendations for altering clinical practice or patient management, it may still be important to standardize the MR imaging contrast agent to ensure accurate comparisons in patients with posttreatment glioma undergoing monitoring with serial follow-up MR imaging, especially considering the different T1 relaxivities and ionic properties of the 2 types of GBCA.
CONCLUSIONS
Both one-molar nonionic gadobutrol and half-molar ionic gadoterate meglumine showed the same trends in model-free and pharmacokinetic parameters, except for a higher wash-in rate with gadobutrol and a higher washout rate with gadoterate meglumine. Therefore, our findings support the current interchangeable use of these 2 GBCAs for DCE imaging in patients with posttreatment glioma.
ACKNOWLEDGMENT
The authors would like to thank Jeong Hoon Kim for his assistance in clinicoradiologic diagnoses.
Footnotes
Ji Eun Park and Jung Youn Kim contributed equally to this work.
This work was supported by Bayer Korea and by a National Research Foundation of Korea (Ministry of Education) (grant No. NRF-2020R1A2B5B01001707 and NRF-2020R1A2C4001748). The funders had no role in study design, data collection and analysis, decision to publish, or preparation of the manuscript.
Indicates open access to non-subscribers at www.ajnr.org
References
- Received May 17, 2020.
- Accepted after revision July 22, 2020.
- © 2020 by American Journal of Neuroradiology


Jump to section
Related Articles
Cited By...
- No citing articles found.