
Abstract
BACKGROUND AND PURPOSE: The Clinical Activity Score is widely used to grade activity of thyroid eye disease and guide treatment decisions, but as a subjective measurement and being confined to the anterior orbit, it has limitations. Non-EPI-DWI of the extraocular muscles may offer advantages as a functional imaging technique with reduced skull base artifacts, but the correlation with the Clinical Activity Score and patient outcome is unknown. Our aim was to establish the correlation between the Clinical Activity Score and non-EPI-DWI and to describe the additional value provided by adjunctive non-EPI-DWI in making clinical decisions.
MATERIALS AND METHODS: This was a retrospective longitudinal study of 31 patients seen in a multidisciplinary thyroid eye disease clinic during 5 years who had at least 1 ophthalmic and endocrine assessment including the Clinical Activity Score and a non-EPI-DWI ADC calculation. The Spearman rank correlation coefficient was used to determine the relationship between the Clinical Activity Score and non-EPI-DWI. A patient flow chart was constructed to evaluate clinical decision-making, and receiver operating characteristics were generated.
RESULTS: From 60 non-EPI-DWI scans, 368 extraocular muscles were selected for analysis. There was a significant positive correlation between the Clinical Activity Score and ADC (rs = 0.403; 95% CI, 0.312–0.489; P < .001). ADC values were significantly higher in the Clinical Activity Score ≥ 3 group compared with the Clinical Activity Score < 3 group (P < .001). Our patient flow chart identified a third intermediate-severity cohort in which the non-EPI-DWI was particularly useful in guiding clinical decisions.
CONCLUSIONS: The non-EPI-DWI correlated well with the Clinical Activity Score in our patients and was a useful adjunct to the Clinical Activity Score in making clinical decisions, especially in patients with intermediate activity and severity of thyroid eye disease.
ABBREVIATIONS:
- CAS
- Clinical Activity Score
- DON
- dysthyroid optic neuropathy
- EOM
- extraocular muscle
- ROC
- receiver operating characteristic
- TED
- thyroid eye disease
Thyroid eye disease (TED) is one of the most common inflammatory diseases of the orbit affecting approximately 25% of individuals presenting with systemic Graves disease.1,2 TED can be a sight-threatening disease with profound physical and psychological consequences.3 The time course of the disease typically follows an initial active phase, potentially amenable to immunosuppressive treatment, and a later inactive phase in which residual structural orbital disease is usually surgically managed.4
Disease activity is often guided by the Clinical Activity Score (CAS) based on scoring of mainly subjective markers of disease, with a score of ≥3 often denoting cases in which systemic immunosuppression should be considered.5,6 Despite its wide use, the CAS has limitations. The CAS can underestimate activity in the posterior orbit, and most important, sight-threatening dysthyroid optic neuropathy (DON) may occur in the presence of a low CAS score.7
Advances and availability in MR imaging have resulted in a trend toward the application of MR imaging to TED to inform disease activity alongside CAS.8,9 Various MR imaging modalities have been applied in this setting and include T2-weighted extraocular muscle (EOM) signal intensities, dynamic contrast-enhanced MR imaging, and fat-suppression techniques such as the STIR sequence.10-13 Results from these reports have been variable, and some techniques have additional limitations that include the adverse events associated with contrast administration and necessary standardization corrections to allow reliable comparison between scans (eg, normalization of signal intensities with those of the nearby temporalis muscle).14,15
DWI is an MR imaging technique that measures movement of water molecules within tissues to calculate an ADC, in which higher ADC values indicate greater facilitated diffusion reflective of an underlying active inflammatory process.14 Echo-planar DWI has shown promise in the evaluation of active TED, and studies have demonstrated higher ADC values in the EOMs of patients with TED compared with healthy controls.14,16,17 In studies comparing active with inactive TED, the ADC is reported to be higher in active disease and is elevated at an early stage in the disease before activity is detected on routine MR imaging, suggesting the potential utility of ADC evaluation at an early time point in the disease trajectory.16,17
Non-EPI-DWI, however, has the potential of higher resolution images and a reduction in air-bone interface artifact distortion.18 These advantages potentially allow greater clarity of orbital images and more reliable measurement of ADC values, and non-EPI-DWI has replaced its EPI counterpart in assessing other skull base pathologies such as middle ear cholesteatoma.19,20 In TED, we have demonstrated in a case series that non-EPI-DWI was a useful adjunct in our management of selected cases of moderate-to-severe and active TED.21 Acknowledging that conventional MR imaging STIR signal intensity ratios are a commonly used MR imaging technique in TED, we previously conducted a preliminary study to establish that signal intensity ratios and ADC are positively correlated and that there was good interobserver correlation within each measurement in our center.21,22
The objectives of this study were to build on our previous work to do the following: 1) investigate the correlation of non-EPI-DWI with CAS; 2) describe the clinical decisions made on the basis of non-EPI-DWI data in a tertiary referral multidisciplinary setting; and 3) explore the diagnostic potential of non-EPI-DWI in mild and sight-threatening disease.
MATERIALS AND METHODS
Subjects
This retrospective observational study examined all adult patients who were referred to a multidisciplinary TED clinic from inception of the service in October 2012 to data base lock in April 2017 and fulfilled the following inclusion criteria: 1) suspected diagnosis of TED in combination with either signs or symptoms of proptosis, ocular motility disturbance, reduced visual acuity, and/or known thyroid disease; 2) at least 1 endocrine and ophthalmologic assessment and at least 1 CAS measurement; 3) at least 1 non-EPI-DWI orbital MR imaging scan with at least 1 measurement of an EOM ADC value. This study design was reviewed and approved by the institutional research and development review board (Northwest University Healthcare National Health Service Trust). The requirement for informed consent was waived.
Clinical Assessment
Patients were evaluated in a multidisciplinary TED clinic with a consultant ophthalmic and oculoplastic specialist with an interest in TED (V.L.), an endocrinologist (C.F.), and orthoptist. The CAS score is a validated score to grade disease activity in TED.5 CAS assessments were performed by the same observer (V.L. with >20 years’ experience) at each visit and scores of ≥3 were considered moderate-to-severe and active cases of TED.6 In the case of multiple CAS measurements, the score nearest in date to MR imaging was selected for analysis (mean time from CAS to MR imaging, 13.2 ± 21.9 days).
All patients had at least 1 endocrine assessment with optimization of the thyroid status with either antithyroid medication (carbimazole first-line and propylthiouracil second-line) or thyroxine replacement or both (ie, block and replace) in patients with moderate-to-severe and active eye disease or in patients with unstable thyroid function.
The following clinical data were collected retrospectively for each patient: 1) date of birth; 2) sex; 3) ethnicity; 4) medical history including a history of thyroid disorder and previous radioiodine treatment; 5) a family history of Graves disease; 6) smoking status; 7) thyroid status including antibody assessment; 8) medications at initial visit; 9) CAS measurements closest in time to DWI scans; 10) formal DWI radiology report; and 11) TED treatments between scans (eg, intravenous methylprednisolone, orbital radiation therapy, second-line immunosuppressive treatment, and surgical interventions).
Imaging Technique
MR imaging was performed on a 1.5T superconductive unit (Magnetom Avanto; Siemens) using a standard Head Matrix coil. In all patients, a 3-mm-thick HASTE DWI sequence was acquired in the coronal plane (TR = 900 ms; TE = 118 ms; matrix = 192 × 86; FOV = 145 mm; 18 averages; EPI spacing = 6.28 ms; bandwidth = 465 Hz/pixel; b factors, 0 and 1000 s/mm2). Coronal 3-mm-thick STIR images (TR = 5640 ms; TE = 91 ms; matrix = 256 × 112; FOV = 145 mm) were obtained. The STIR, b = 0, and b = 1000 diffusion-weighted images were copy-referenced to ensure the same section position to allow optimal image evaluation and measurement. Following acquisition, an ADC map was calculated using the diffusion scan raw data.
Imaging Evaluation
A specialist head and neck radiologist, blinded to the CAS score (R.K.L. with 14 years’ experience), examined all MR images before selecting the non-EPI-DWI section that best illustrated EOMs with higher ADC on visual survey, corroborated by an observer (C.F.) also blinded to CAS score. We have previously observed good interobserver agreement for non-EPI-DWI ADC in 23 actively inflamed muscles in cases of in TED in our center (intraclass coefficient = 0.97; 95% CI, 0.94–0.98).22 Freehand ROIs were contoured within the inner border of all visualized active EOMs to determine the ADC (±SD) value. In addition, ADC values were derived for the medial and inferior recti bilaterally on all scans, irrespective of the initial survey, because TED appears to have a predilection for these EOMs.14 The oblique muscles were excluded from analysis due to concerns about the reliability of measurement in an oblique plane as well as being atypical sites for TED involvement. Right and left values in each individual were analyzed separately to reflect that disease can be unilateral and asymmetric. Therefore, the minimum number of EOM measurements per scan was 4 (ie, right and left inferior and medial recti alone) or a maximum of 8 (ie, inferior and medial recti as well as the superior and/or lateral recti bilaterally). Each scan was assessed in an identical fashion regardless of whether it was a baseline or follow-up scan.
Subgroup Analyses
Three clinically defined subgroups were selected for further analysis. Cohort 1 (96 EOMs, n = 12) was defined as mild/possibly active TED based on clinical criteria, a CAS of ≤1, and no more than 1 scan. Cohort 2 (100 EOMs, n = 8) referred to individuals who were considered to have definite TED but fell within a mild-to-moderate and active category of severity based on CAS 1–3. These subjects had an initial scan at presentation and at least 1 follow-up scan. The remaining cohort 3 (172 EOMs, n = 11) had moderate-to-severe and active TED with CAS scores of ≥3. These subjects also had at least 2 scans. For selected analyses, a DON subgroup (n = 5) was defined as those patients with acuity loss and requiring high-dose pulse methylprednisolone and/or emergency orbital decompression.
Patient Flow Chart
To describe the clinical decisions made on the basis of clinical assessment, the CAS, and the non-EPI-DWI result (determined globally as active or inactive based on the initial radiology report by R.K.L.), we constructed a flow chart to follow the patient journey for each of cohorts 1–3 and documented the patient outcome at study close. This was performed to determine whether non-EPI-DWI had any observed advantage for patients beyond the CAS and clinical assessment alone.
Receiver Operating Characteristic
To evaluate the potential utility of ADC as a diagnostic test for DON or to exclude mild/possible TED, we generated receiver operating characteristic (ROC) curves for the 2 following scenarios: 1) cases of DON versus no DON, and 2) cohort 1 (mild/possible TED) versus cohort 3 (moderate-severe TED).
Statistical Analysis
Statistical analyses, including ROC generation, were performed using GraphPad Prism software, Version 8.0.0 (GraphPad Software). Demographic data are presented as number and percentage; group averages are reported as mean ± SD, range, and Fisher exact/Mann-Whitney U test or 1-way ANOVA to compare groups. To calculate correlations of CAS and ADC values, we used a paired Spearman rank correlation coefficient statistical test (rs, confidence interval, and P value). For subgroup comparisons of non-normally distributed data, we applied the Mann-Whitney U test. P values < .05 were considered significant.
RESULTS
Patient Characteristics
Of the 88 patients seen in the multidisciplinary clinic, 31 met the inclusion criteria (60 DWI scans, 368 EOMs) and were included in the final analysis (mean age, 48.2 years; range, 20.2–79.8 years; 22/31 [70.9%] women; 32% smokers). Given that only a subset of the total cohort warranted specialized imaging to inform clinical care, most exclusions (55/57, 96%) were due to no DWI scan being available for review, with the remainder (2/57, 4%) due to no documented CAS.
There was strong representation from ethnicities that were not white, in keeping with demographics of a large metropolis and included 32% Black Caribbean, 32% white (UK and Europe), 23% Indian/Asian, and 10% Middle Eastern. At presentation to the clinic, 20/31 (64.5%) were on treatment for confirmed Graves thyrotoxicosis (16/20 carbimazole and 4/20 prophylthiouracil), 3/31 (9.7%) were on levothyroxine, and 8/31 (25.8%) had normal thyroid function and were not receiving treatment.
There was a significant positive correlation of moderate effect size between CAS and ADC across all 368 EOMs (rs = 0.403; 95% CI, 0.312–0.489; P < .001) (Fig 1A). Given that CAS ≥ 3 often denotes a cutoff for clinically active moderate-to-severe and active TED, a group-wise comparison was made between CAS < 3 (EOMs, n = 298) and CAS ≥ 3 (EOMs, n = 70) groups. ADC values were significantly higher in the CAS ≥ 3 group (mean ADC, 913 ± 312) compared with the CAS < 3 group (mean ADC, 760 ± 239) (P ≤ .001) (Fig 1B).

Correlation between CAS and ADC and clinically meaningful group-wise comparisons of ADC and CAS in the overall cohort. Box plots demonstrate a positive Spearman rank correlation coefficient between CAS and ADC of individual EOMs (n = 368) (A) and significantly greater ADC values in CAS ≥ 3 (n = 70) (B) compared with CAS < 3 (n = 298) groups. Two asterisks indicate P < .001, 2-tailed. C, Significantly greater ADC values of all EOMs in cohort 3 compared with those in cohort 1 (P < .001) and cohort 2 (P = .03). For cohort 2, ADC values were significantly higher than those in cohort 1 (P < .001) but lower than those in cohort 3 (P = .03). Single asterisk indicates P < .05.
Subgroup Analyses
Demographic data are shown in Table 1. There was greater representation from Black Caribbean racial groups in cohorts 2 and 3 versus cohort 1, but this did not reach statistical significance. All patients in cohort 3 had a positive thyroid autoantibody result and were taking antithyroid medication at presentation.
Patient characteristics (cohorts 1–3)
ADC values in cohort 3 were significantly higher than those in cohorts 1 (96 EOMs, P < .001) and 2 (100 EOMs, P = .03). In cohort 2, ADC values were significantly higher than those in cohort 1 (P < .001) and lower than those in cohort 3 (172 EOMs, P = .03) (Fig 1C).
Subgroup Results: Clinical Course
There were differences in the clinical courses of patients in each cohort. In cohort 1, there were no patients who developed moderate-to-severe and active TED requiring medical or surgical treatment, and to our knowledge, no patients re-presented with symptoms during a 6- to 18-month follow-up.
In cohort 3, all patients had at least 1 course of IV methylprednisolone compared with 2/8 (25%) patients in cohort 2 (P = .001). Seven of 11 patients in cohort 3 received orbital radiation therapy compared with 0/8 patients in cohort 2 (P = .004). Greater numbers of patients in cohort 3 (3/11, 27.3%) required second-line immunosuppressants (mostly mycophenolate) compared with none in cohort 2. Four patients (36.3%) developed DON in cohort 3 and 1/8 (12.5%) in cohort 2, all necessitating high-dose pulsed methylprednisolone with 2/5 requiring surgical decompression (Table 1).
Patient Flow Chart
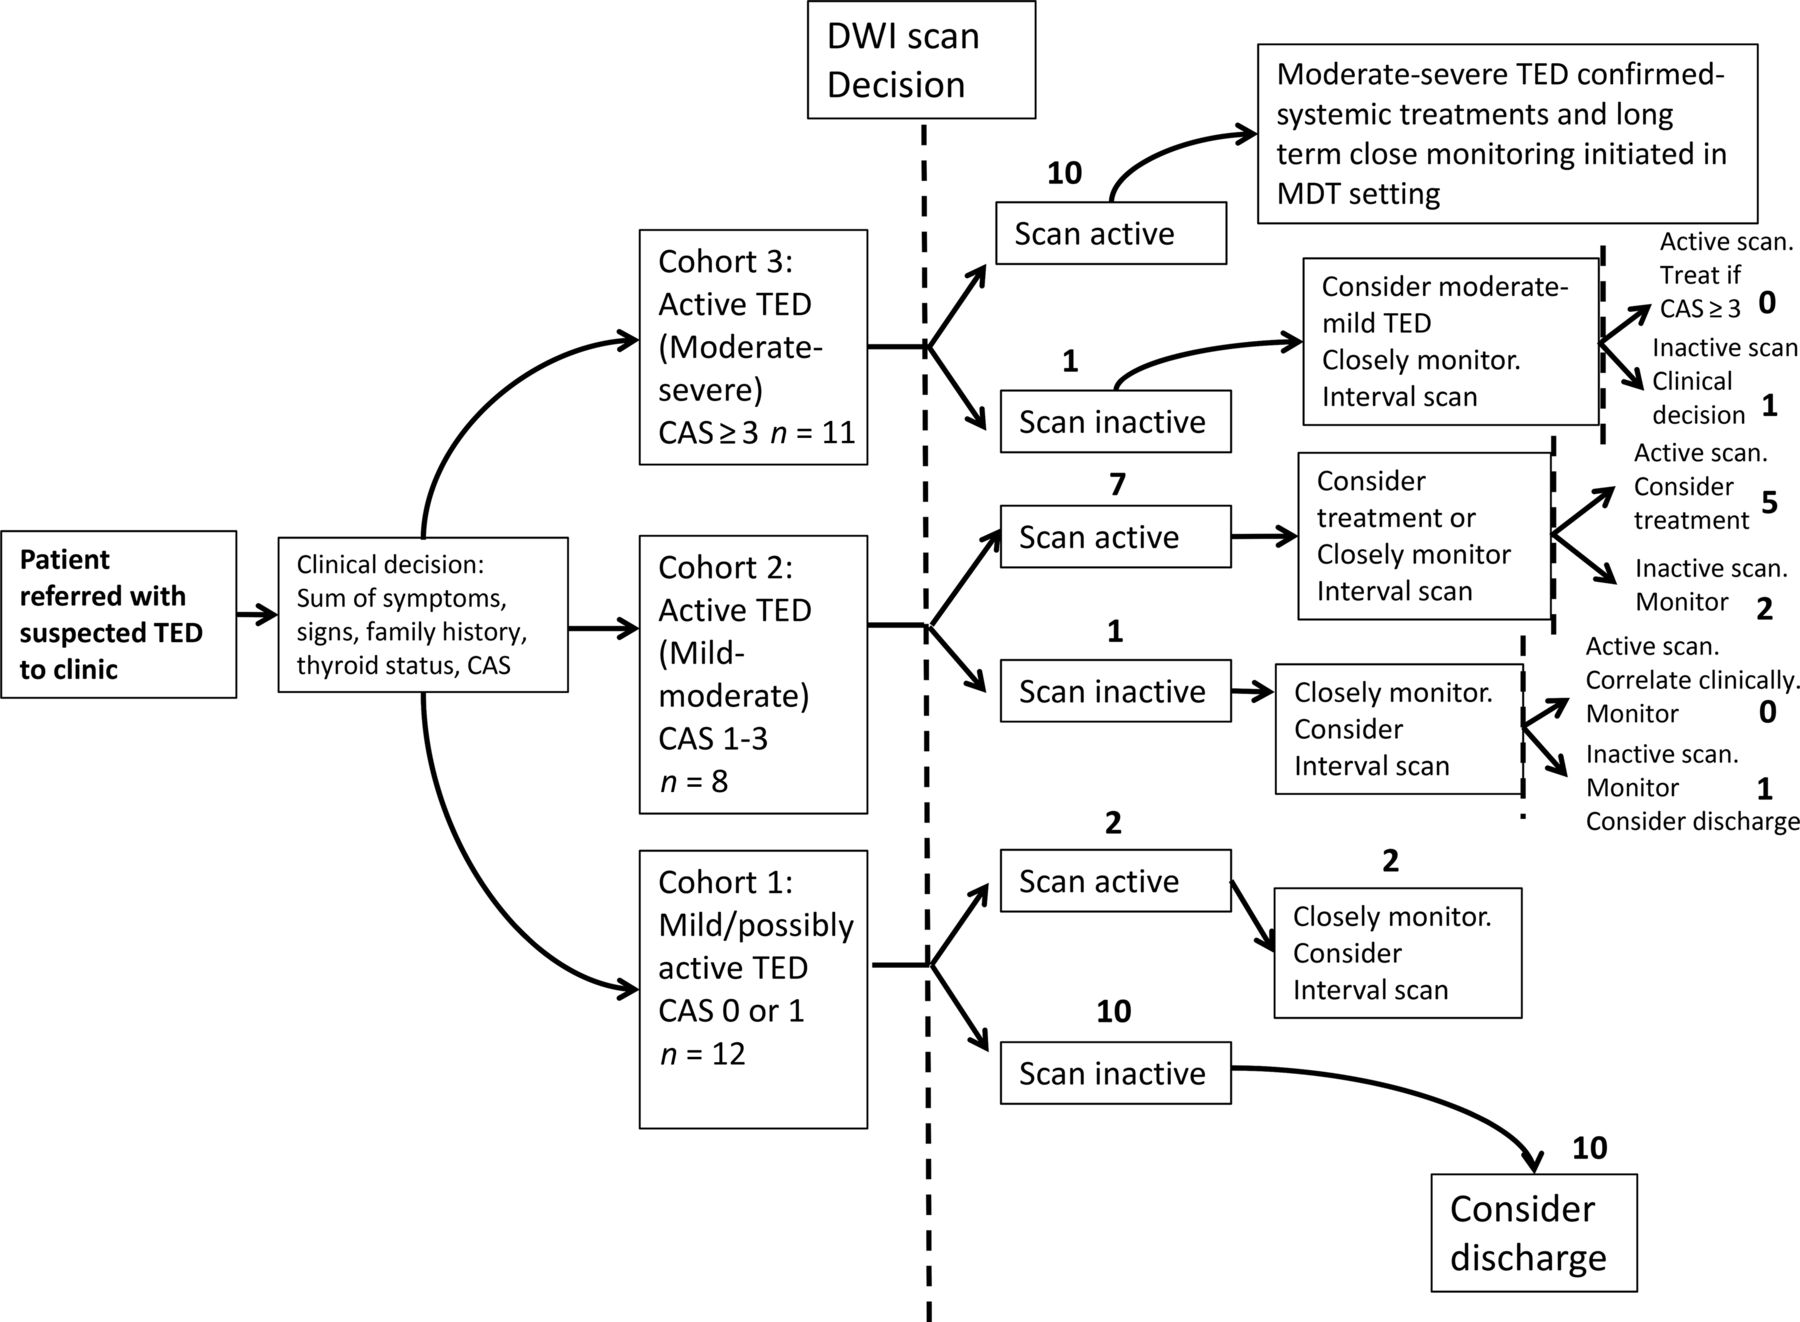
Results of the patient flow chart are shown in Fig 2. In cohort 1, most patients, 10/12 (83.3%), showed concordance between a mild clinical picture and an inactive scan and were discharged after a follow-up clinical review. The remaining 2 showed discordance (ie, an active scan) and were followed more closely but remained stable.

Patient flow chart for clinical decisions influenced by the reported activity of non-EPI-DWI scans in conjunction with CAS and clinical assessment. Whole numbers denote the number of patients. The dashed line represents the opportunity for a non-EPI-DWI-informed clinical decision. MDT indicates multidisciplinary team.
Non-EPI-DWI appeared to have the most value as an adjunct to the CAS in determining treatment and monitoring decisions in cohort 2 (ie, patients with active disease but not meeting the CAS criteria for systemic immunosuppression). Those patients in cohort 2 who also had an active scan (ie, 7/8, 87.5%) were not treated with immunosuppressive therapies, as were those with CAS < 3, but a more conservative approach of clinical surveillance in combination with a second interval scan at 3–6 months was pursued. Of these, 2 patients remained clinically and radiologically active at the next review to justify systemic immunosuppression despite CAS < 3. One of these patients subsequently developed DON, and the other required further courses of immunosuppression to control the disease (latter patient shown in Fig 3B).

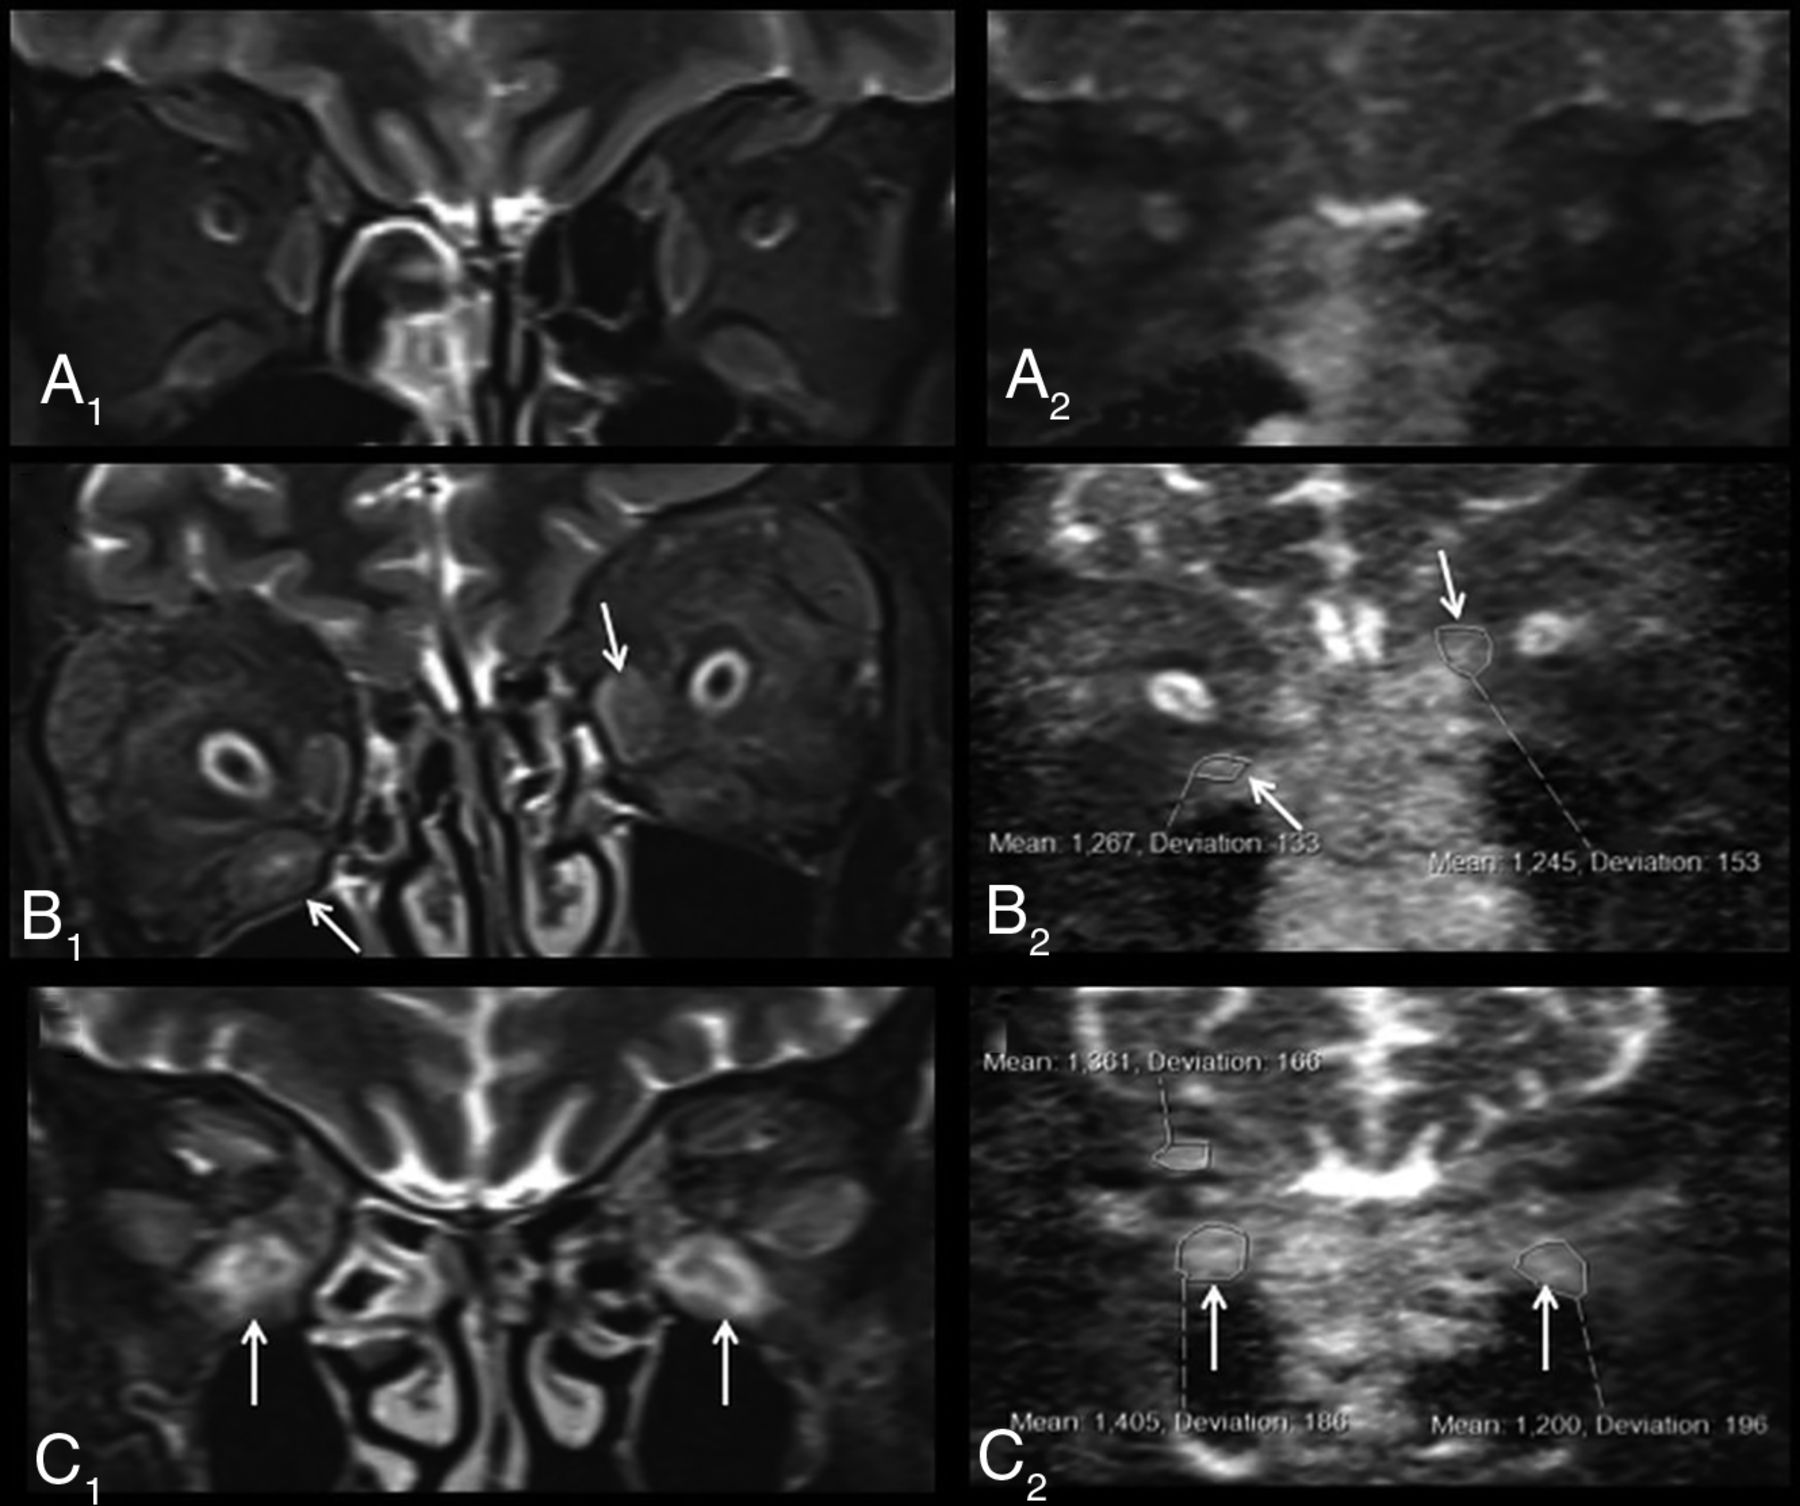
Representative examples of non-EPI-DWI of orbital EOMs in patients from each of cohorts 1, 2, and 3 alongside STIR MR imaging. A, Coronal orbital/EOM MR imaging STIR image (A1) and a non-EPI-DWI ADC image (A2) show mild enlargement of the extraocular muscles with mild increased signal and ADC values (right inferior rectus muscle = 590; left inferior rectus muscle = 540), labeled an inactive scan (cohort 1). STIR image (B1) and ADC image (B2) show moderate-to-marked enlargement of the extraocular muscles and increased signal and ADC values, notably at the right inferior and left medial recti muscles (arrows) (cohort 2). STIR image (C1) and ADC image (C2) show moderate-to-marked enlargement of the extraocular muscles and markedly increased signal and ADC values notably at the inferior recti muscles (arrows) (cohort 3).
Only 1/11 (9.9%) patients in cohort 3 had a discordant clinical and radiologic picture (ie, CAS > 3 but scan inactive). This patient was treated regardless with IV methylprednisolone on the basis of clinical judgment (CAS = 4); however, the CAS remained high during the 18-month follow-up period, raising the possibility of a type I error in the CAS. All other patients in this group had an active scan and received systemic treatment, radiation therapy, and surgical intervention as described earlier. All of these patients had a protracted clinical course, and 3/10 (30%) relapsed at some point during the follow-up period. A representative non-EPI-DWI from a patient within this cohort (who was treated for DON) is shown in Fig 3C.
ROC
ADC performed reasonably well in differentiating cohort 1 from cohort 3, with an estimated ADC cutoff of <833 to give an 83% sensitivity and 61% specificity in diagnosing mild/possibly active disease (Fig 4). An optimum ADC cutoff to diagnose DON was estimated at >1154 to give 100% sensitivity and 96% specificity; however, the analysis was severely limited by the low number of DON cases included in the analysis (n = 5).
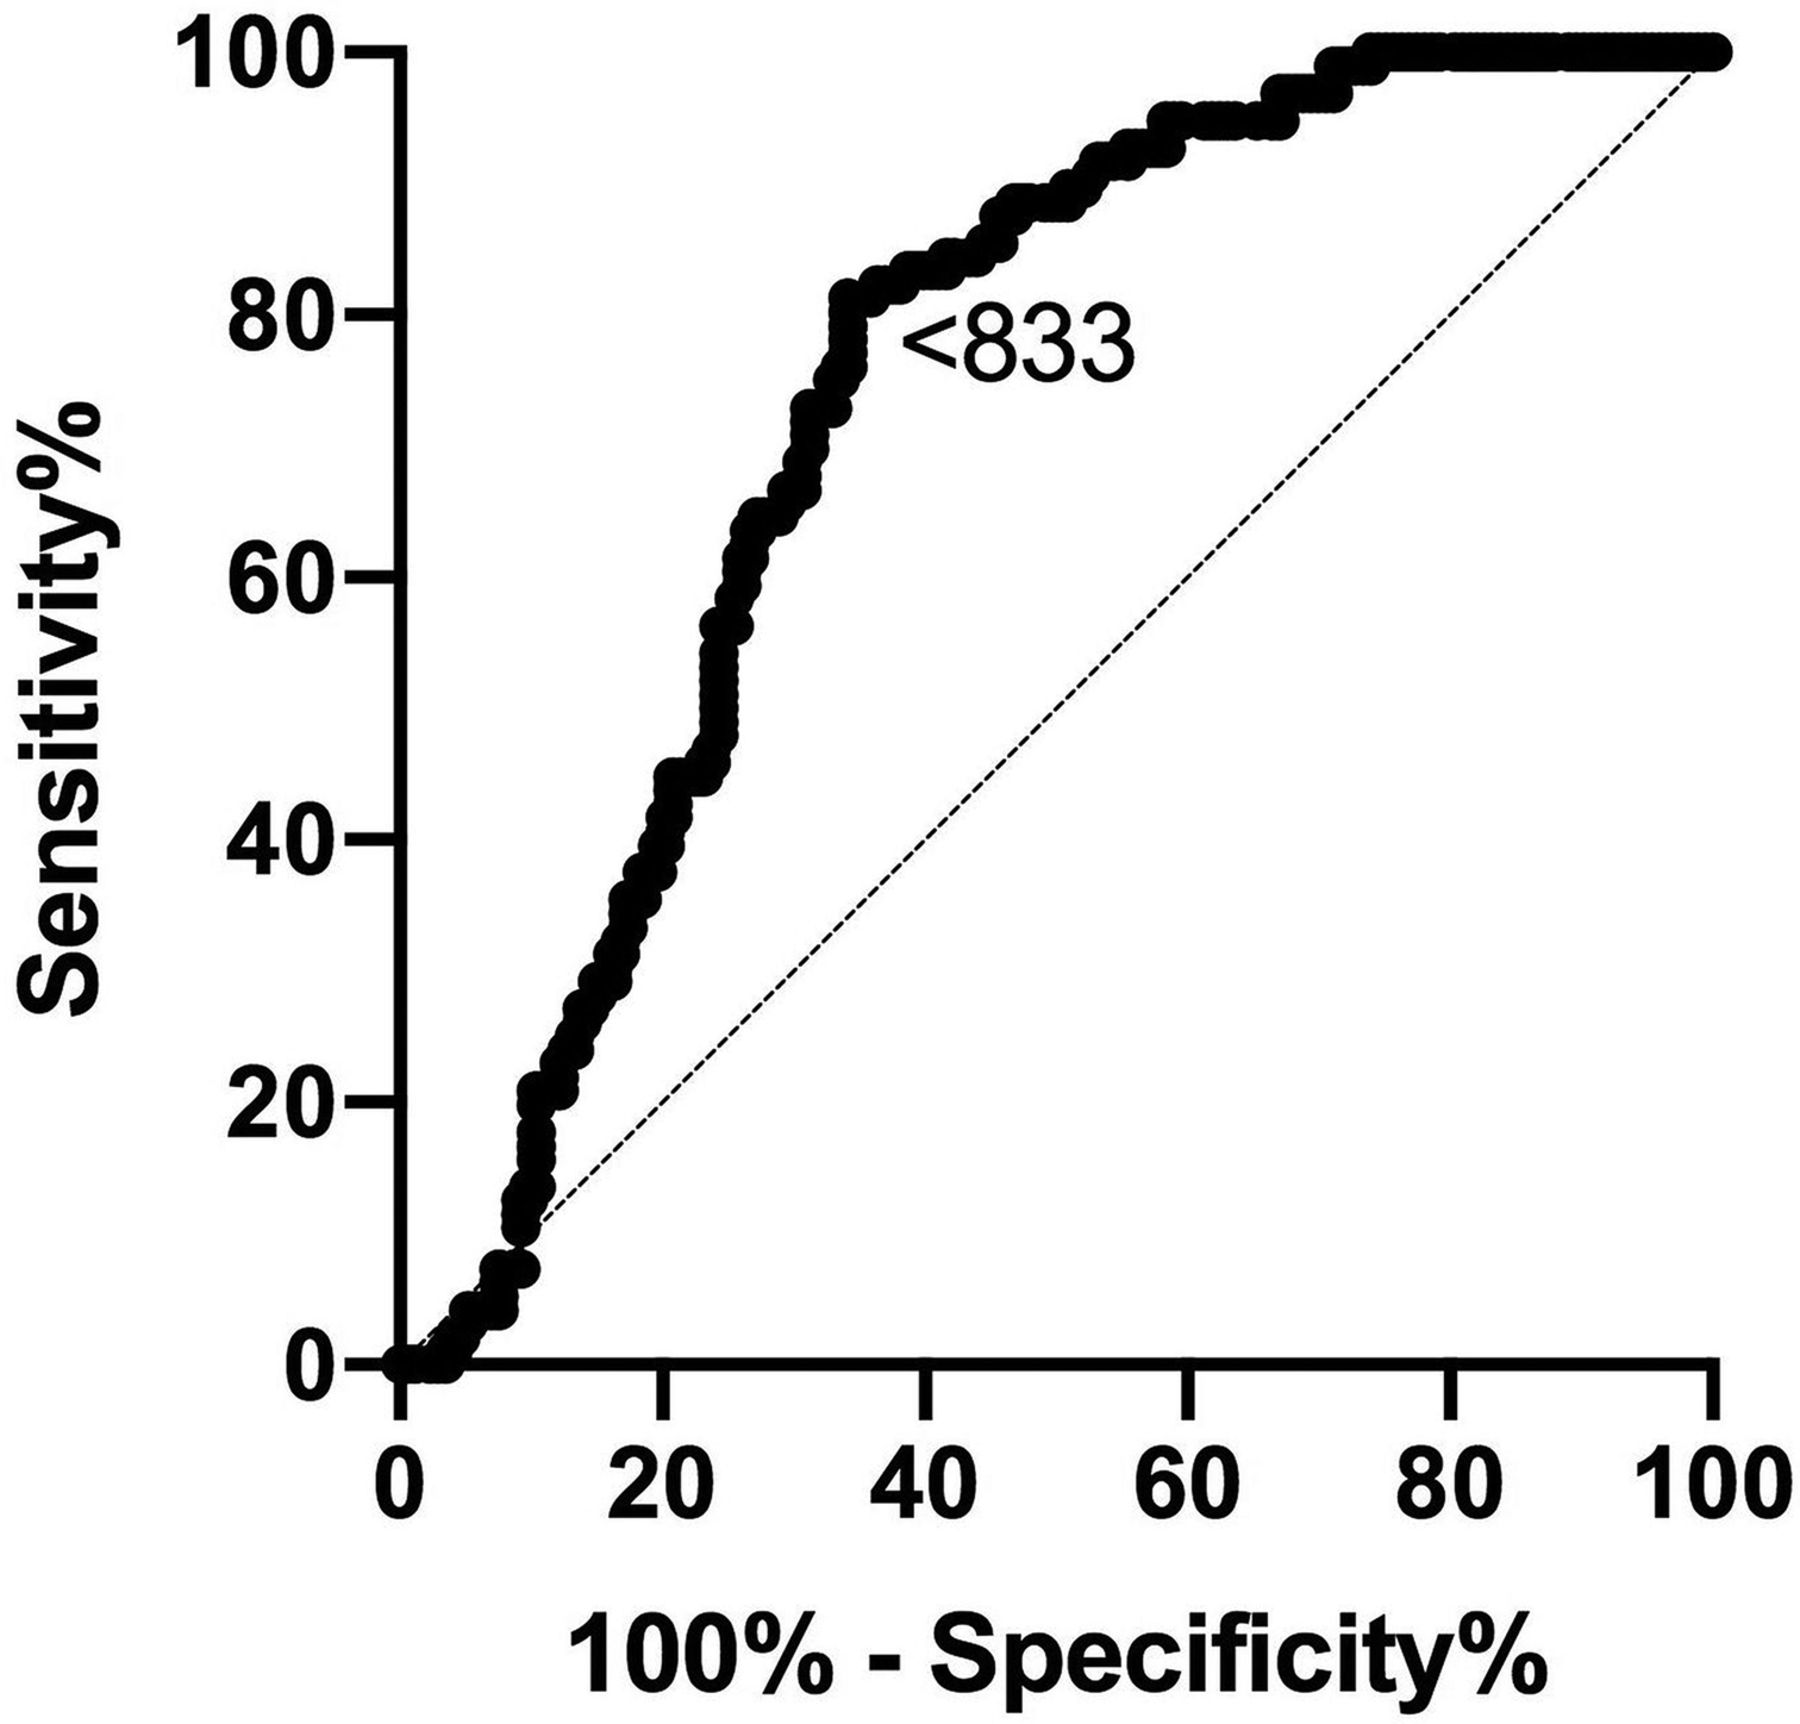
ROCs for ADC values obtained in subjects with no/possible disease (cohort 1) and moderate-severe disease (cohort 3) (area under the curve = 0.737; 95% CI, 0.68–0.80; P < .001). Diagonal line represents a line of no discrimination between disease states. Arrowed number represents the ADC value.
DISCUSSION
Our results build on our previous work to demonstrate that a significant positive correlation exists among the CAS, the commonly used the TED activity score, and ADC derived from non-EPI-DWI of EOMs in cases of suspected active TED.21,22 Previous studies have also demonstrated this finding using echo-planar-DWI, but to our knowledge, this is the first demonstrating a positive relationship, using non-EPI-DWI.16,17
Non-EPI-DWI has potential advantages over echo-planar DWI, which include greater resolution, thinner-section images, and refocusing pulses for every measured EPI-DWI sequence that reduces air-bone interface artifacts and distortion.19,23⇓-25 Given DWI scanning parameters (including the number of b-values used) are standardized, there is no requirement for normalization of ADC values with those of the adjacent temporalis muscles, unlike other MR imaging modalities, and DWI obviates contrast administration.
Using non-EPI-DWI in our clinic, we identified 3 broad groups of patients with distinct characteristics, clinical courses, CAS scores, and imaging features. Although the moderate-to-severe and active group is a well-recognized TED group often defined as CAS ≥ 3 and usually requiring systemic immunosuppressive therapies, our findings have highlighted, for the first time, 2 further subgroups with CAS < 3 in which clinical decision-making can be more challenging. While we made decisions primarily on the basis of clinical judgment and in line with European guidance,6 we found, from our own experience, that agreement or disagreement with non-EPI-DWI allowed us to make more confident decisions regarding discharge, monitoring, and treating with immunosuppressive therapy with CAS < 3. However, a larger follow-up study is needed to determine what impact the addition of non-EPI-DWI to a management algorithm has on long-term patient outcomes.
We believe that non-EPI-DWI was a useful adjunct for our patients, in part because the CAS can sometimes over- or underestimate true disease activity, even in very experienced hands and when controlling for interrater variability in clinical judgment as we did in this study. For example, one of our patients who presented with CAS < 3 was not treated immediately with systemic immunosuppression but eventually re-quired treatment after active progression was noted on non-EPI-DWI. This patient subsequently developed and was successfully treated for DON. In this case, the CAS, being largely restricted to signs in the anterior or-bit, may have underestimated disease pathogenesis posteriorly, whereas non-EPI-DWI may be advantageous in this setting.26 Conversely, we managed a patient with an inactive scan who continued to have a CAS ≥ 3 despite long-term follow-up and systemic immunosuppression, and we suspect this condition was due to unreliable reporting and interpretation of orbital pain.
The other potential limitations of CAS (and other scores based on signs and symptoms) include the absence of a scoring system for highly rele-vant signs such as diplopia at the initial visit, the inclusion of measurements of ocular motility restriction at follow-up that can be unreliable, and the potential under-reporting of erythema-based signs in darker-skinned individuals.27 The latter point is especially relevant in our patient population in which up to 70% of our patients were not white. Non-EPI-DWI may also have limitations as a disease activity biomarker. It is limited to assessment of ADC to the EOMs only, rather than other tissues implicated in disease pathogenesis such as adipose tissue, and the exact relationship between ADC and disease pathogenesis requires further understanding.
Finally, we found other potential advantages of non-EPI-DWI in our patients that require further validation. By means of ROC analysis, non-EPI-DWI ADC may have the potential to differentiate mild/possible TED unlikely to require immunosuppressive treatment from more severe disease, but this possibility requires validation from larger studies using this imaging technique. Second, non-EPI-DWI has the potential to gather information on more anatomic variables than CAS alone (up to 8 EOMs), increasing the utility of this technique as a research tool to test hypotheses and explore spatial and temporal patterns of disease. Although not evaluated in this study, it would be of future interest to compare non-EPI-DWI in TED with other causes of EOM enlargement such as lymphoma, metastases, benign tumors. and other inflammatory lesions.
However, despite the potential merits of this technique, it is important to consider the limitations of adjunctive imaging in TED, which include an additional patient visit to the hospital, additional specialist resources, and, as with any investigational test, the potential for false-positive and false-negative findings.
CONCLUSIONS
These results show a positive relationship with CAS and non-EPI-DWI in TED across the spectrum of active disease. To our knowledge, this is the first study demonstrating this relationship using non-EPI-DWI, our preferred technique for imaging soft tissue near the skull base. We also found that our patients fell into 3 activity subgroups, and non-EPI-DWI was particularly useful in aiding clinical decisions with CAS < 3. Our findings also suggest that non-EPI-DWI may have promise as a diagnostic tool, a biomarker of disease activity, and a research tool for hypothesis testing to further our understanding of this challenging and costly disease.
Acknowledgments
We would like to acknowledge all staff at the Eye and Endocrinology Departments at Central Middlesex Hospital, especially Jennifer Coelho and Drs Koteshwara Muralidhara, Camelia Kirollos, Pari Avari, Daniel Darko, Wingmay Kong, and Bernie Colaco. Thanks also to the radiographers and radiology staff at London Northwest University Healthcare National Health Service Trust.
Footnotes
C.F. was funded by a Medical Research Council research grant during the period of data collection.
Disclosures: Claire Feeney—UNRELATED: Employment: I have been a Pfizer employee in an unrelated field since June 2018. However, this study was conducted before I started employment and during my PhD with the Imperial College London. Vickie Lee—UNRELATED: Employment: Imperial College Healthcare and London North West Healthcare National Health Service Trusts, Comments: I am employed at these National Health Service institutions as a Consultant Ophthalmic and Oculoplastic Surgeon; Expert Testimony: Eye-Law Chambers, Comments: I undertake medicolegal work in my area of specialist expertise; Other: I work in private practice as a Consultant Ophthalmic and Oculoplastic Surgeon.
Indicates open access to non-subscribers at www.ajnr.org
References
- Received October 13, 2019.
- Accepted after revision May 16, 2020.
- © 2020 by American Journal of Neuroradiology


Jump to section
Related Articles
Cited By...
- No citing articles found.