
Abstract
BACKGROUND AND PURPOSE: An accurate evaluation of the World Health Organization grade is critical in pediatric intracranial tumors. Our aim was to explore the correlations between parameters derived from conventional DWI, intravoxel incoherent motion, and diffusional kurtosis imaging with histopathologic features to evaluate the accuracy of diffusion parameters for grading of pediatric intracranial tumors.
MATERIALS AND METHODS: Fifty-four pediatric patients with histologically proved intracranial tumors who underwent conventional DWI, intravoxel incoherent motion, and diffusional kurtosis imaging were recruited. The conventional DWI (ADC), intravoxel incoherent motion (pure diffusion coefficient [D], pseudodiffusion coefficient [D*], perfusion fraction [f], diffusional kurtosis imaging [K], and diffusion coefficient [Dk]) parameters in the solid component of tumors were measured. The cellularity, Ki-67, and microvessel density were measured. These parameters were compared between the low- and high-grade pediatric intracranial tumors using the Mann-Whitney U test. Spearman correlations and receiver operating characteristic analysis were performed.
RESULTS: The ADC, D, and Dk values were lower, whereas the K value was higher in high-grade pediatric intracranial tumors than in low-grade tumors (all, P < .001). The K value showed positive correlations (r = 0.674–0.802; all, P < .05), while ADC, D, and Dk showed negative correlations with cellularity and Ki-67 (r = −0.548 to −0.740; all, P < .05). The areas under the curve of ADCVOI, DVOI, DkVOI, and KVOI were 0.901, 0.894, 0.863, and 0.885, respectively, for differentiating high- from low-grade pediatric intracranial tumors. The area under the curve difference in grading pediatric intracranial tumors was not significant (all, P > .05).
CONCLUSIONS: Intravoxel incoherent motion– and diffusional kurtosis imaging–derived parameters have similar performance compared with conventional DWI in predicting pediatric intracranial tumor grade. The diffusion metrics may potentially reflect tumor cellularity and Ki-67 in pediatric intracranial tumors.
ABBREVIATIONS:
- AUC
- area under the curve
- D
- true diffusion coefficient
- D*
- pseudodiffusion coefficient
- Dk
- the corrected ADC without Gaussian bias
- DKI
- diffusional kurtosis imaging
- f
- perfusion fraction
- IVIM
- intravoxel incoherent motion
- K
- diffusional kurtosis
- MVD
- microvessel density
- PIT
- pediatric intracranial tumor
- WHO
- World Health Organization
Pediatric intracranial tumors (PITs) are the second most common cancers with the highest mortality among children.1 In contrast to adults, the pathologic types of intracranial tumors are widely heterogeneous in children.2 Preoperative accurate evaluation of the World Health Organization (WHO) grade is critical for choosing the appropriate therapeutic treatment and evaluating prognosis in PIT. Conventional MR imaging, such as T2-weighted and T1-weighted MR imaging without and with contrast, is usually used to assess the location, morphology, and extension of PITs.3 However, differentiating high- and low-grade PITs remains challenging owing to the overlap of conventional MRI manifestation of these 2 tumors. Conventional DWI based on the monoexponential model could noninvasively provide additional functional information within the tumor.4 Conventional DWI with ADC values has been reported to be useful in characterizing tumor cellularity and predicting the PIT grade.4⇓⇓-7 However, the ADC value calculated using the monoexponential model may not accurately reflect the water molecular diffusion behavior due to the influence of capillary microcirculation and complex cellular microstructural barriers within the tumor.
Previous researchers have suggested that several advanced MR diffusion techniques, including intravoxel incoherent motion (IVIM) and diffusional kurtosis imaging (DKI), might provide a more accurate illumination of water molecular diffusion behavior.8⇓-10 IVIM with a biexponential model, introduced by Le Bihan8 and Le Bihan et al,9 can be used to distinguish real water molecular diffusion from microcirculation with sufficiently low b-values. On the other hand, DKI with a non-Gaussian model, proposed by Jensen et al,10 could more accurately characterize the microstructural complexity of tumors with high b-values. Several investigations have demonstrated that IVIM and DKI have a higher accuracy for reflecting tumor biology and predicting tumor grades in glioma,11,12 meningioma,13 and sinonasal malignancies.14 Because conventional DWI, IVIM, and DKI may reflect different information about tissue properties, investigating their roles in the grading of PIT should be valuable. However, only a few studies with small sample sizes have investigated the promising potential of IVIM in grading of PIT.15,16 So far, no comparison of the 3 different diffusion models in predicting tumor biology and grades in PIT has been made. Thus, this study aimed to explore the correlations of metrics derived from conventional DWI, IVIM, and DKI with histopathologic features to compare the accuracy of conventional DWI, IVIM, and DKI for PIT grading.
MATERIALS AND METHODS
Patients
This retrospective study was approved by our institutional review board, and the informed consent requirement was waived due to the retrospective nature of this study. Between July 2017 and August 2020, a total of 56 consecutive pediatric patients with intracranial tumors were enrolled on the basis of the following inclusion criteria: 1) intracranial tumors histologically proved by surgery/biopsy, 2) preoperative MR imaging performed (without any previous treatment), and 3) available IVIM and DKI sequences. The exclusion criterion was the solid component of tumor being unavailable for analysis (<10 mm2, n = 2). Ultimately, 54 patients (40 boys and 14 girls; mean age, 9.35 [SD, 3.84] years; range, 8 months to 18 years) with 28 high-grade (WHO grades III and IV) and 26 low-grade (WHO grades I and II) tumors were included in this study.
MR Imaging Techniques
All patients underwent MR imaging examinations with a 3T MR imaging scanner (Magnetom Skyra; Siemens) using a 20-channel head/neck coil. Routine MR imaging was performed, including axial T2WI, SWI, and pre- and postcontrast T1WI.
Multiple b-value DWI was performed using a single-shot echo-planar imaging sequence in the axial plane. The detailed imaging parameters were as follows: TR/TE = 5000 ms/78 ms, FOV = 220×220 mm, acquisition matrix = 150 × 135, parallel acceleration factor = 2, section thickness = 5 mm, gap = 1 mm, and acquisition time = 8 minutes 25 seconds. Thirteen different b-values (b = 0, 50, 100, 150, 200, 300, 400, 600, 700, 800, 1000, 1400, and 2000 s/mm2 with 2, 2, 2, 2, 2, 2, 2, 2, 2, 3, 3, 4, 4 signal averages, respectively) were applied in all 3 orthogonal diffusion directions.
Image Processing and Analysis
In the conventional DWI model, the DWI data-fitting was performed on the basis of the following equation: Sb/S0 = exp (–b·× ADC), Where Sb and S0 are the signal intensities at a specific b-value and at b = 0 s/mm2, respectively. The ADC map was calculated from 2 b-values (0 and 1000 s/mm2). For the IVIM model, the corresponding parameters, including D, D*, and f, were derived from the following equation using the following 11 b-values (b = 0, 50, 100, 150, 200, 300, 400, 600, 700, 800, and 1000 s/mm2): Sb/S0 = (1–f) × exp (–b × D) + f × exp [–b × (D + D*)]. Where Sb and S0 are the signal intensities at a specific b-value and at b = 0 s/mm2, respectively. D is the true diffusion coefficient, D* is the pseudodiffusion coefficient, and f is the perfusion fraction. For the DKI model, diffusion signal intensities of 4 b-values (b = 0, 700, 1400, and 2000 s/mm2) were fitted with the following equation: Sb/S0 = exp (–b × Dk + b2 × Dk2 × K/6). Where Sb and S0 are the signal intensities at a specific b-value and at b=0 s/mm2, respectively. Dk is the corrected ADC without Gaussian bias, and K is the diffusional kurtosis. ADC, IVIM, and DKI processing were performed using a prototype software (Diffusion Toolbox; Siemens), which generated quantitative parametric maps, including the ADC and D, D*, f, Dk, and K maps.
The quantitative parametric maps were independently analyzed by 2 blinded pediatric neuroradiologists (S.L. and W.G., with 3 and 5 years of experience in neuroradiology, respectively) unaware of the clinicopathologic data. For each patient, both reviewers placed 1 polygonal ROI (mean ROI = 643.20 [SD, 526.64] mm2; range, 16.13–2181.77 mm2) along the outer margin of the solid component of the tumors on the section where the lesion was the largest of the corresponding parametric maps. Consequently, the mean ADCROI, DROI, D*ROI, fROI, DkROI, and KROI values of a single section were calculated. Moreover, 1 polygonal VOI (mean VOI = 41,441.50 [SD, 51,160.96] mm3; range, 756.37–298,406.35 mm3) was also drawn along the outer margin of the solid component of the tumors on the corresponding parameter maps to calculate the quantitative parameters for the whole lesion, which were referred as ADCVOI, DVOI, D*VOI, fVOI, DkVOI, and KVOI. Attention was paid to exclude the areas of necrosis, edema, cyst, hemorrhage, calcification, or apparent blood vessel. The measurements made by 2 neuroradiologists were used to evaluate the interreader repeatability. The measurements were made repeatedly by W.G. with a minimum washout period of 1 month to assess the intrareader repeatability.
In addition, the conventional MR imaging characteristics of each tumor were recorded by 1 blinded pediatric neuroradiologist (D.C., with 30 years of experience in neuroradiology), including tumor location, cystic degeneration, hemorrhage, necrosis, enhancement characteristics of the solid component, peritumoral edema, and tumor margin.
Histopathologic Evaluation
All PITs were classified according to the 2016 WHO Classification of Tumors of the Central Nervous System.17 Thirty-five histopathologic specimens (35/54, 64.8%) were retrospectively reviewed by an experienced pathologist (Y.Z.) for this study. All histologic parameters were calculated from 5 arbitrarily selected high-power fields (original magnification ×200; area, 0.583 mm2). Tumor cellularity was determined using the number of tumor cell nuclei from the total tissue area.4 The mean tumor cell counts for 5 high-power fields were calculated. The Ki-67 index was evaluated using a previous method.15 Briefly, the specimens were immunostained with a commercial Ki-67 monoclonal antihuman antibody (MIB-1; Santa Cruz Biotechnology). The Ki-67 was determined using the percentage of tumor cell nuclei labeled with the Ki-67 monoclonal antibody from all tumor cell nuclei. The highest value for Ki-67 for 5 high-power fields was recorded. Microvessel density (MVD) was calculated as previously described.18 The specimens were immunostained with a commercial anti-CD31 antibody (Abcam). The MVD was determined using the percentage of anti-CD31 immunostained vascular area from the total tissue area. The mean MVD value for 5 high-power fields was calculated.
Statistical Analysis
All data of PITs were presented as means (SDs), medians, and interquartile range, or number of cases and ratio, as appropriate. The inter- and intrareader repeatability was evaluated using the intraclass correlation coefficient with corresponding 95% CIs. Intraclass correlation coefficient values of >0.75 indicated good agreement. Comparisons of diffusion parameters, histologic parameters, and age between high- and low-grade tumor groups were made with the Mann-Whitney U test. Comparisons of sex and conventional MR imaging characteristics were made with the χ2 test. The Spearman correlations were performed to assess correlations between diffusion parameters and histologic features (correlation coefficient ρ [r] ≤ 0.3, very weak to negligible; 0.31–0.5, weak; 0.51–0.7, moderate; 0.71–0.9, strong; 0.91–1.0, very strong). Receiver operating characteristic curve analyses were performed to assess the diagnostic performance and determine the optimal cutoff value of each diffusion parameter for tumor grading. The area under the curves (AUCs) among 9 parameters were compared using the DeLong method with a Bonferroni correction. The corrected P value was obtained by multiplying uncorrected P values by 36 (9 comparisons). The AUC, Youden index, sensitivity, specificity, positive likelihood ratio, and negative likelihood ratio were calculated. Statistical analyses were performed with commercial software programs (SPSS Version, 22.0, IBM; MedCalc, Version 15.0, MedCalc Software). P values < .05 were considered statistically significant.
RESULTS
The comparative results of demographic characteristics, tumor location, and conventional MR imaging characteristic between low- and high-grade PITs are summarized in Table 1. A high-grade PIT was more likely to demonstrate necrosis than a low-grade PIT (50% versus 19.2%, P <.05). No differences in other conventional MR imaging characteristics, age, and sex were observed between these 2 groups.
Comparison of demographic and conventional MR imaging characteristics between low- and high-grade PITs
The quantitative MR imaging parameters of each pediatric brain tumor type are shown in the Online Supplemental Data. As shown in Table 2, inter- and intrareader agreement was good for the measurements of conventional DWI, IVIM, and DKI parameters (intraclass correlation coefficient = 0.771–0.984). The comparative results of histologic and quantitative MR imaging parameters between low- and high-grade PITs are shown in Table 3. For the diffusion parameters, the ADCROI, ADCVOI, DROI, DVOI, DkROI, and DkVOI values were significantly lower in high-grade tumors than in low-grade tumors (all, P < .001), whereas the KROI and KVOI values of high-grade brain tumors were significantly higher than those in low-grade tumors (P < .001) (Figs 1 and 2). The high-grade brain tumors tended to have higher f values, but the difference was not significant (P > .05). For the histologic parameters, the cellularity and Ki-67 were significantly higher in the high-grade group than in the low-grade group (all, P < .05) (Figs 1 and 2).
The inter- and intrarater repeatability for quantitative MR imaging parameters
Comparison of histopathologic and quantitative MR imaging parameters between low- and high-grade PITsa

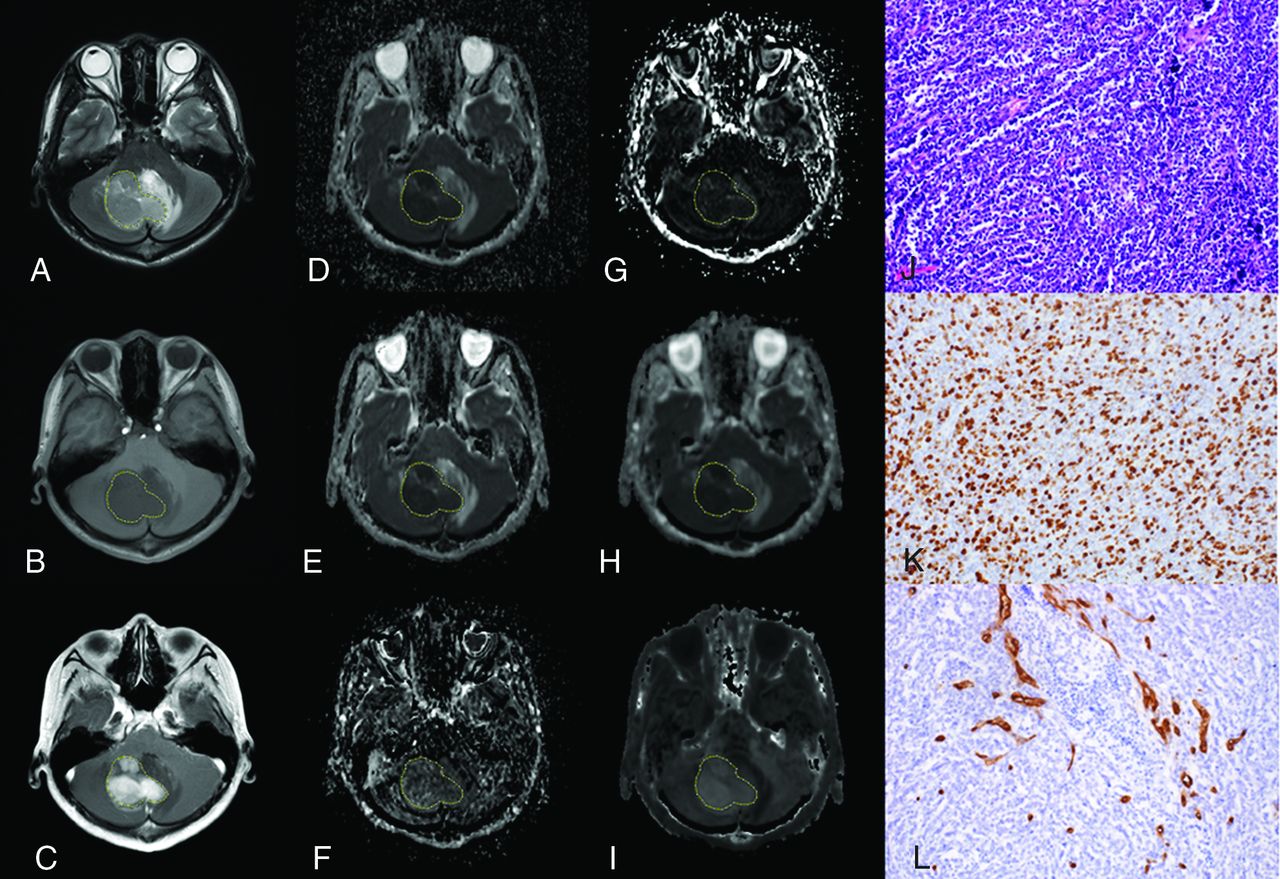
A 15-year-old boy with medulloblastoma in the cerebellum (WHO grade IV). The lesion shows hyperintensity on the T2-weighted image (A), hypointensity on the T1-weighted image (B), and enhancement on the postcontrast T1-weighted image (C). The lesion (VOI) demonstrates hypointensity on the ADC map (D), D map (E), and Dk map (H) and hyperintensity on the D* map (F), f map (G), and K map (I), with values of 0.647 × 10⁻³mm2/s, 0.594 × 10⁻³ mm2/s, 0.778 × 10⁻³ mm2/s, 87.228 × 10⁻³ mm2/s, 6.312%, and 1.210, respectively. The pathologic diagnosis was medulloblastoma with a cellularity of 4927 cell/mm2 (J), a Ki-67 index of 80% (K), and an MVD of 1.4% (L) (original magnification × 200).

A 5-year-old boy with a diffuse astrocytoma in the brain stem (WHO grade II). The lesion shows hyperintensity on the T2-weighted image (A), hypointensity on the T1-weighted image (B), and enhancement on the postcontrast T1-weighted image (C). The lesion (VOI) demonstrates hyperintensity on the ADC map (D), D map (E), and Dk map (H) and hypointensity on the D* map (F), f map (G), and K map (I), with values of 1.528× 10⁻³mm2/s, 1.530 × 10⁻³ mm2/s, 1.681 × 10⁻³ mm2/s, 57.310 × 10⁻³ mm2/s, 2.394%, and 0.315, respectively. The pathologic diagnosis was diffuse astrocytoma with a cellularity of 1917 cell/mm2 (J), a Ki-67 index of 1.1% (K), and an MVD of 0.9% (L) (magnification, × 200).
The correlation results between quantitative MR imaging parameters and histologic parameters are illustrated in Table 4. The cellularity and Ki-67 were inversely correlated with the ADCROI, ADCVOI, DROI, DVOI, DkROI, and DkVOI values (r = −0.548 to −0.740; all, P < .001) and were positively associated with KROI and KVOI values (r = 0.674−0.802; all, P < .001), respectively. The KVOI value showed the strongest correlation with the Ki-67 index (r = 0.802, P < .001). The MVD was not significantly correlated with any diffusion parameters (r = −0.101−0.273; all, P > .05).
Correlation between histologic parameters and quantitative MR imaging parameters for all PITs
As demonstrated in Table 5 and Fig 3, according to receiver operating characteristic curve analysis, the ADC, D, Dk, and K values were useful in grading PITs (AUC = 0.799–0.901). The diagnostic performance of the quantitative diffusion parameters in grading PITs was superior to that of the conventional MRI (all, corrected P <.05). However, the diagnostic performance of quantitative diffusion parameters was similar (all, corrected P > .05, compared with each other).
Measurement of the quantitative MR imaging parameters and conventional MR imaging for differentiating high- and low-grade PITs
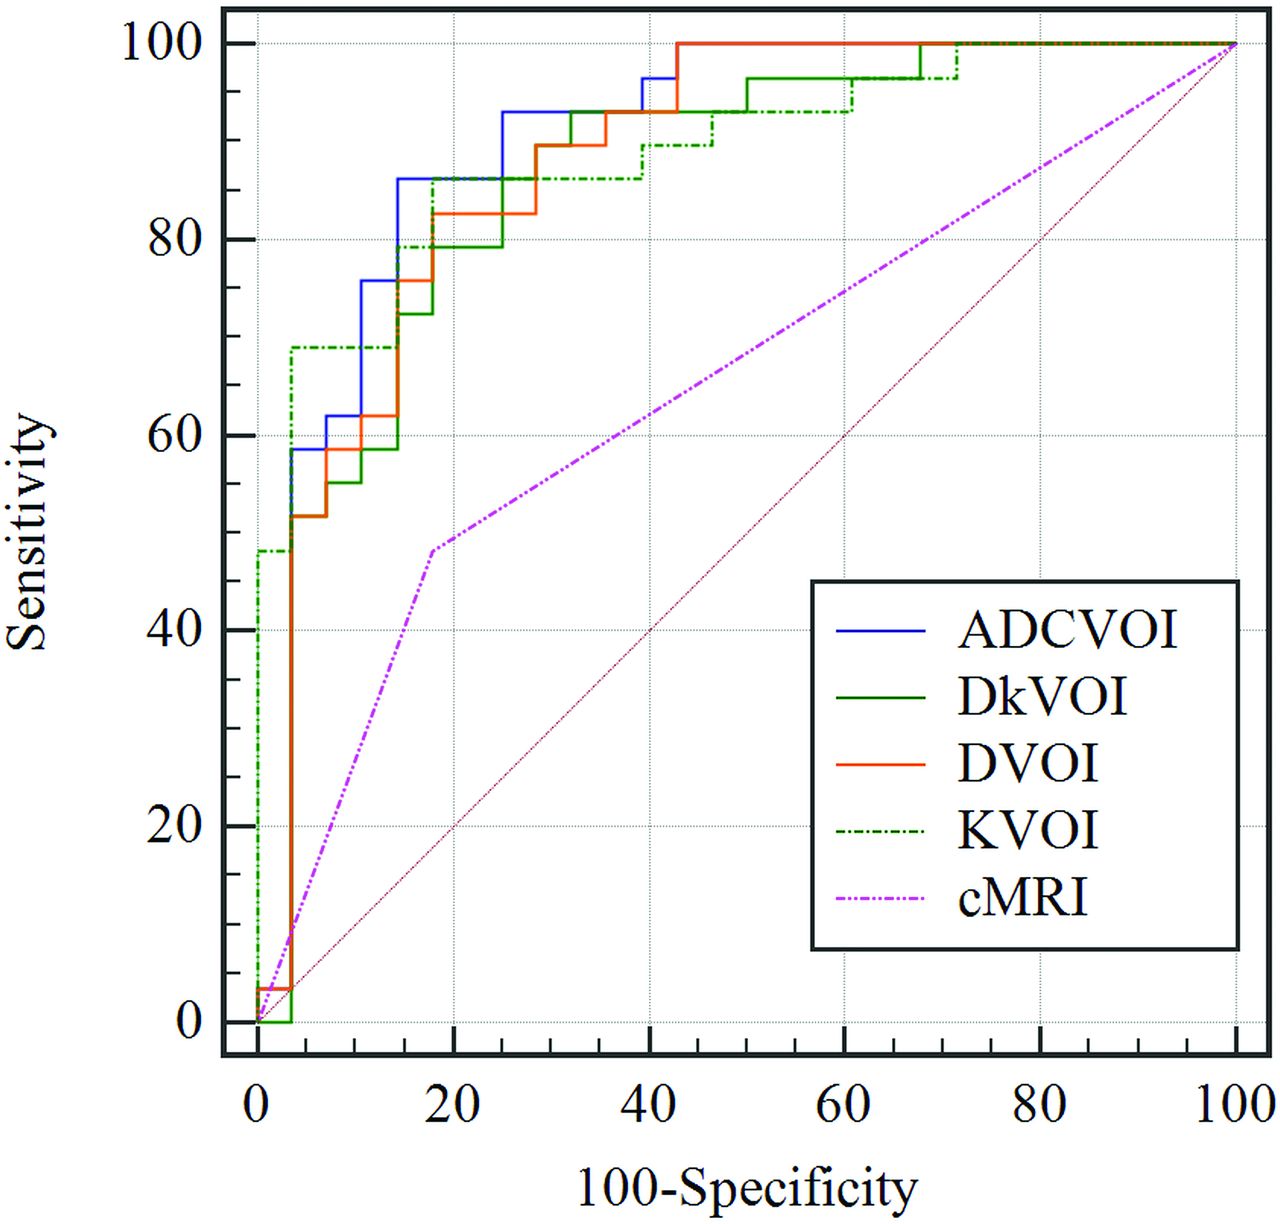
Receiver operating characteristic curves for ADCVOI, DVOI, DkVOI, KVOI, and conventional MR imaging in distinguishing low- from high-grade pediatric intracranial tumors.
DISCUSSION
An accurate assessment of the WHO grade and histologic features is particularly vital in PIT. In this study, with a relatively large sample size, the results showed that the DWI, IVIM, and DKI parameters were correlated with the cellularity or Ki-67 of PIT and were helpful in differentiating low- from high-grade PITs. However, IVIM- and DKI-derived parameters had similar diagnostic performance compared with conventional DWI.
Conventional MR imaging has been shown to be insufficient for differentiation of PIT, in part because location, cystic degeneration, necrosis, peritumoral edema, or enhancement may be seen with both high- and low-grade PITs.3 In our study, high- and low-grade PITs have similar conventional MR imaging characteristics except necrosis. Even necrosis was not reliable for differentiating high- or low-grade PITs, which were not seen in half of the high-grade PITs (14/28, 50%) in this study. Con-sequently, advanced MR imaging techniques, such as diffusion imaging, that improve diagnostic performance of tumor grading remain valuable.
Our preliminary results showed that ADC, D, and Dk values were negatively correlated with cellularity and Ki-67. In comparison with ADC, D and Dk represent the pure molecular diffusion coefficient without microcirculation influence8 and the corrected diffusion coefficient for non-Gaussian bias,10 respectively. Therefore, it was not unusual that the negative correlation was found between quantitative diffusion metrics (D and Dk) and histologic features (cellularity and Ki-67) because high Ki-67 or cell density could reduce tumor stromal space and cause the restriction of water molecular diffusion (reflected by decreasing ADC, D, and Dk).4 Our findings also agree with the results of an earlier IVIM study performed in a small number of pediatric patients, in which the D value was correlated with Ki-67 and the f value was correlated with MVD.15 Additionally, we also found that the K value obtained from DKI was positively correlated with cellularity and Ki-67, a finding consistent with recent studies in adult intracranial tumors.13,19 K is the deviation of water molecular diffusion from a Gaussian distribution, which might indicate the tissue heterogeneity.10 These correlations may be attributed to a higher degree of heterogeneous cell membranes (reflected by cellularity and Ki-67) and complex intracellular microstructure (reflected by Ki-67). Furthermore, the K value had the strongest Ki-67-related correlation among all parameters, indicating that the K value could serve as a promising metric for predicting Ki-67 expression in PITs.
D* and f are both perfusion-related IVIM metrics that quantify the microcirculation perfusion of the tissue.8 The f value represents the flowing blood volume fraction and has no correlation with cellularity and Ki-67, or even with MVD in this study. This result is in discordance with those of previous studies,15,20 while consistent with another study.21 Lima et al20 found a positive correlation between f and MVD in a rat brain model, while Li et al21 reported that the f value had no evident correlation with MVD in rabbit liver VX2 tumors. The reason for the discordance between the f value and capillary density is still unclear and may be attributed to the complex microcirculation environment, such as extravasation due to increased permeability in immature microvessels and higher vascular pressure, which may decrease the blood volume.20 The heterogeneity of tumor included in this study might also account for this discordance. In addition, the D* value in our study had no correlation with histologic features due to the low SNR and the relatively weak reproducibility, in line with previous studies.15
Furthermore, we found that high-grade PITs had lower ADC, D, and Dk values but higher K values than low-grade tumors, in line with the recent studies.11⇓–13,15 In an earlier IVIM study performed in 17 pediatric intracranial tumors, lower ADC and D values were also seen in high-grade tumors.15 The decrease of diffusion-related parameters (ADC, D, and Dk) in high-grade PITs reflected a higher cell density and increased mitotic activity (higher Ki-67), which were also shown in our study. The increase of the K value in high-grade PITs may be attributed to heterogeneous malignancies in childhood and complex microstructure in the tumors. Additionally, although the high-grade PIT tends to have higher f values, the difference was not significant, inconsistent with a previous study,15 probably due to the differences in inclusion types and case sizes between the previous study and the present study. Specifically, some high-grade pediatric intracranial tumors, such as diffuse midline gliomas, showed a low microcapillary perfusion (mean fVOI = 4.20%). Most interesting, the diffusion parameters (ADC, D, and Dk) for ROIs were slightly higher than those for VOIs (the opposite of K) in low-grade PITs. The ROI method used in this study may be more prone to imaging noise, which may lead to the overestimation of diffusion parameters.22
Our preliminary study showed that ADC, D, Dk, and K had similar diagnostic performance for differentiating high- from low-grade PITs. We noticed that DROI had the highest specificity. This means that D removal of the perfusion portion could be conducive to revealing the cellular density within tumor23⇓-25 and could have a relatively better performance in diagnosing low-grade PITs. ADCVOI achieved the highest Youden index, with a maximum AUC in a nonsignificant manner. Compared with IVIM and DKI, ADC was easily acquired with a shorter scanning time, had a low requirement for specific software, and was less prone to motion artifacts, which may be more applicable in pediatric patients. These preliminary findings suggest that ADC could serve as a useful and convenient marker in pediatric brain tumor grading.
This study had several limitations. First, our major limitation is the heterogeneity of the tumors studied. Larger numbers of individual tumor types are necessary to validate these preliminary findings across all tumor types. Second, the histopathologic analyses were available for only 35 (64.8%) cases due to the retrospective study. However, to our knowledge, the sample size in our study for histopathologic analyses was relatively large in the study of pediatric intracranial tumors. Third, conventional DWI, IVIM, and DKI parameters derived from regions of tumor may not correspond well to the histologic tissue samples for histologic analysis. Thus, a site-to-site MR imaging–guided biopsy may be needed to confirm our findings. Fourth, the diffusion encoding was performed using only 3 perpendicular directions in this study. More direction could be used to realize anisotropic diffusion via the diffusion tensor imaging in brain tissues and to increase spatial resolution. However, DWI averaged over 3 directions is usually applied during the clinical diagnostic procedure.
CONCLUSIONS
IVIM- and DKI-derived parameters have similar performance compared with conventional DWI in reflecting histologic features and predicting the PIT grade.
Footnotes
This study was supported by the Funding Project of Medical Innovation of Fujian Province (No. 2019-CX-23); the Joint Project of Health and Education of Fujian Province (No. 2019-WJ-10); the Leading Project of the Department of Science and Technology of Fujian Province (No. 2020Y0025); the National Natural Science Foundation of China (No. 82071869); the Joint Funds of the Innovation of Science and Technology, Fujian Province (No. 2019Y9115); and the Startup Fund for Scientific Research, Fujian Medical University (No. 2018QH1048).
Dejun She and Shan Lin contributed equally to this study.
Indicates open access to non-subscribers at www.ajnr.org
References
- Received April 1, 2021.
- Accepted after revision June 23, 2021.
- © 2021 by American Journal of Neuroradiology


