
Abstract
BACKGROUND AND PURPOSE: Dual-layer spectral CT is a novel technology that utilized conventional single-tube CT acquisition with a dual-layer detector for the separation of high and low-energy photons to create spectral data for material decomposition. We evaluated the spectral parameters of iodine density and Z-effective values in primary head and neck squamous cell carcinoma and determined its impact on local tumor staging.
MATERIALS AND METHODS: Twenty-one patients with primary head and neck squamous cell carcinoma and 15 healthy controls were retrospectively evaluated. Iodine density (milligram/milliliter) and Z-effective values were compared quantitatively between head and neck squamous cell carcinoma and normal neck mucosa. The receiver operating characteristic area under the curve determined the diagnostic performance of the spectral data for local staging. We compared conventional CT images without and with iodine density and Z-effective images to determine its impact on local tumor staging.
RESULTS: Primary head and neck squamous cell carcinoma showed higher mean iodine density (2.01 [SD, 0.26] mg/mL, P < .001) and Z-effective values (8.21 [SD, 0.36], P < .001). A high interobserver correlation was demonstrated for ROI measurements for both the control group (iodine density, κ = 0.71, and Z-effective values, κ = 0.78) and head and neck squamous cell carcinoma (iodine density, κ = 0.84, and Z-effective values, κ = 0.75) group. The area under the curve for iodine density and Z-effective values was 0.98 and 0.93, respectively. Optimal thresholds were identified as 1.58 mg/mL (95% CI, 1.45–1.71 mg/mL; P < .001; sensitivity = 1.0; specificity = .0.93) for iodine density and 8.08 (95% CI, 7.96–8.19; P < .001; sensitivity = 0.86; specificity = 0.93) for Z-effective values. Conventional CT with the addition of dual-layer spectral data (iodine density and Z-effective values) improved the accuracy of local tumor staging in 3 of 21 patients (14%) with head and neck squamous cell carcinoma compared with the criterion standard surgical staging/histopathology.
CONCLUSIONS: Dual-layer spectral iodine density and Z-effective values provided increased quantitative and qualitative differentiation between upper aerodigestive head and neck squamous cell carcinoma and normal mucosa. Increased tissue differentiation improved the local tumor staging accuracy.
ABBREVIATIONS:
- DLSCT
- dual-layer spectral CT
- HPV
- human papillomavirus
- HNSCC
- head and neck squamous cell carcinoma
- ROC
- receiver operating characteristic
Head and neck squamous cell carcinoma (HNSCC) is one of the most common malignant cancers of the upper aerodigestive tract. CT and MRI are used for diagnosis and local staging. Recent advances in CT technologies include dual-energy CT scanners. A variety of dual-energy CT systems are available from multiple vendors including dual-source, single-source (rapid kilovolt switching or twin-beam), and dual-layer detector-based technologies.1⇓⇓⇓-5 Postprocessed images from dual-energy CT scanners improve tissue contrast on the basis of the attenuation profile and chemical composition. The dual-layer spectral CT system (DLSCT) (IQon Spectral CT; Philips Healthcare) uses a conventional single x-ray tube acquisition with a dual-layer detector.5,6 The dual-layer detector distinguishes between low- and high-photon energies. High- and low-energy raw data from the dual-layer detectors are used for the extraction of 2 base models: Compton scattering-like and photoelectric-like effects. DLSCT parameters derived from the 2 base models are used to reconstruct the iodine density and Z-effective spectral images.6 The use of a dual-layer detector enables the acquisition of spectral data being always on despite the conventional (single-tube) CT acquisition, which is different from other commercially available dual-energy CT technologies that use either dual-source (2-tube) or kilovolt switching.
A recent study by van Ommen et al7 concluded that dual-layer detector CT enables the acquisition of dual-energy information over a broad range of clinical indications without increasing the radiation exposure compared with a conventional single-layer-detector CT. Quantitative analysis of tissue using these spectral parameters has been made more accessible through the integration of the IntelliSpace Portal software (Phillips Healthcare) into the PACS system allowing on-demand analysis of the DLSCT data (iodine density and Z-effective values) for the radiologist’s assessment. Lohöfer et al5 are the only group to have previously assessed DLSCT parameters in patients with HNSCC. They found that tumor tissue had a higher iodine density content compared with the surrounding soft tissue. This study was limited to only iodine density parameter assessment and did not assess diagnostic accuracy or the clinical impact of this single spectral parameter on local tumor staging. The utility of the Z-effective spectral parameter has not been previously reported in HNSCC. The purpose of this study was 3-fold: to define normal mucosal iodine density and Z-effective values, to quantitatively assess iodine density and Z-effective values of HNSCC, and to determine the diagnostic accuracy of Z-effective values and iodine density enhancements of conventional CT on tumor detection. We also, descriptively, looked at the effect on local tumor staging when these spectral parameters were used.
MATERIALS AND METHODS
Patients
This study was approved by the institutional ethics review board at the Gold Coast University Hospital, Queensland, Australia. Fifteen consecutive controls and 26 patients with upper aerodigestive HNSCC scanned with the DLSCT between June 2019 and March 2020 were identified. Scans of healthy controls comprised normal or near-normal scan results with minor incidental findings (dental periapical lucencies, benign reactive lymph nodes or tonsillar enlargement, and incidental cutaneous lesions such as sebaceous cysts) and no known local or distant malignancy. Inclusion criteria for the patient cohort with HNSCC were patients with histopathologically proved upper aerodigestive tract HNSCC. Participants with confirmed human papillomavirus (HPV)–associated HNSCC were included. Exclusion criteria were suspected HNSCC without histopathologic confirmation and any tumor too small for sampling by the minimum preset ROI. The final study cohort comprised 21 patients with upper aerodigestive HNSCC.
CT Scanning Technique
All patients underwent a head and neck protocol using the same DLSCT scanner (IQon Spectral CT). Images were acquired after injection of 50 mL of Optiray 350 (Mallinckrodt; 74.0 g/100 mL) at a rate of 1.5 mL/s, followed by a further 50 mL of Optiray 350 injected at a rate of 2 mL/s after a delay of 100 seconds. Patients were scanned 160 seconds after the start of the first contrast bolus. The scanned volume extended from the aortic arch to the top of the ear with a reconstructed FOV of 250 mm, 64 × 0.625 mm beam collimation, 0.27-second rotation time, and 1.234:1 helical pitch. IQon Spectral CT uses conventional CT acquisitions with a dual-layered scintillation detector, comprising an upper layer of an yttrium-based garnet low-density scintillator for detection of lower energy photons and a lower layer of a gadolinium oxysulphide high-density scintillator for detection of higher energy photons. The design of the thickness of the 2 scintillators is optimized for energy separation and an optimal SNR. While all photons are represented superficially, lower energy photons are filtered out with increased depth. The difference in detected photon energy is secondary to augmentation by tissues of different densities. Combining the raw data from each detector layer, IntelliSpace Portal software (Philips Healthcare) reconstructs CT images as conventional CT and additional spectral data overlay maps for each parameter.
Specifically, 2 spectral parameters, iodine density with and without color overlay and Z-effective color overlay, were analyzed in this study. The Z-effective value is the effective atomic number of the tissue, representing the combination of atomic numbers of the elements that comprise the tissue.6 The Z-effective value is measured by the ratio between 2 monoenergetic density coefficients, according to the Joshi Method, and is calibrated on the DLSCT system by fitting measured data to expected values from the National Institute of Standards and Technology data base.6,8 The Z-effective value is dimensionless and has no unit of measure. The calculation of the ratio between density coefficients at 2 energies eliminates the dependency on material density. Non-iodine-enhanced soft tissue is expected to have an effective atomic number of about 7.5, whereas with the presence of iodine, the effective atomic number is increased, accounting for the iodine molecules within the soft tissue. The iodine density result is derived by projecting each voxel from the Compton scattering/photoelectric base to the water/iodine base and quantifying the magnitude of the iodine projection.6 The water/iodine base is defined using the National Institute of Standards and Technology data base, in which water and iodine densities are projected to the Compton scattering and photoelectric base functions. Non-iodine-enhanced soft tissue is expected to have zero or close to zero iodine content in contrast to iodine-enhanced tissue. Iodine density is measured by milligram/milliliter.
Postprocessing and Image Analysis
For each patient, qualitative assessment and quantitative spectral analysis were performed using the IntelliSpace Portal software (Philips advanced visualization platform, Version 9.0) for the iodine density, iodine density color overlay, and Z-effective images. Each study was initially read independently by 2 readers, C.C.-T.H. (a fellowship-trained neuroradiologist with 5 years of experience) and L.D. (a fellowship-trained radiologist and nuclear medicine specialist with 10 years of experience), with final placement of ROIs performed together through a consensus reading session. Normal structures were evaluated with 3 nonoverlapping circular ROIs. A total of 10 mucosa and 3 muscle subsites were evaluated, each with 3 ROIs, corresponding to a total of 39 ROIs per control subject. The average ROI area evaluated per structure was 53.2 mm2 (range, 25.4–67.8 mm2). For HNSCC, each tumor was evaluated, with a total of 9 ROIs placed on at least 3 separate sections. The tumor ROIs were placed in the homogeneous-appearing enhancing part of the lesion, avoiding areas of cystic change/necrosis or visible artifacts. The minimum individual ROI diameter used was 3 mm (sampled ROI of 7.1 mm2), and the maximum diameter used was 5 mm (sampled ROI of 19.6 mm2) (Fig 1). Mean (SD) iodine density (milligrams/milliliter) and Z-effective values were measured within the ROIs. The average value of the 3 ROIs per area was recorded. Normative data for mucosa and muscles were obtained at 6 different levels in the head and neck on the axial plane to enable sampling of the mucosa subsites, including the floor of the mouth, buccal mucosa, oral tongue, palatine tonsil, soft palate, tongue base, aryepiglottic fold, vocal fold, post-cricoid hypopharynx, and cervical esophagus. Measured neck muscles from cranial to caudal included the following: longus coli, genioglossus, and the sternocleidomastoid muscle. For consistency, the right side of the neck was evaluated, except for the genioglossus muscles, for which because of their relatively small size, the largest available structure of both sides was evaluated. The time taken to interpret and perform the spectral analysis in healthy controls and subjects with HNSCC was recorded in minutes.
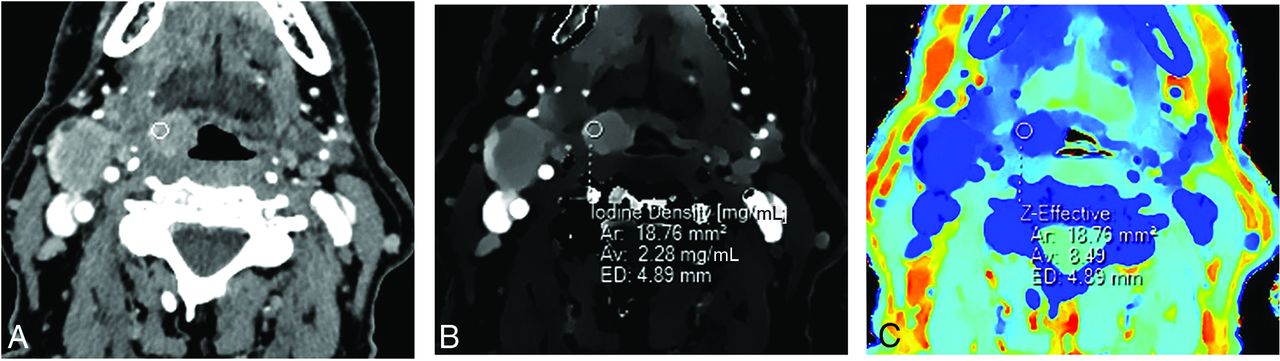
Conventional (A), iodine density (B), and Z-effective (C) images illustrating an ROI placed over a right tongue base squamous cell carcinoma. ROI size is 4.89 mm in diameter (ED), with an average area (Av) of 18.76 mm2. ROI measurements were obtained over 3 image slices (not shown), with the average iodine and Z-effective values calculated. A right level IIa cystic nodal metastasis is also present (not labeled).
Local Tumor Staging
Two readers (C.C.-T.H. and L.D.) blinded to the clinical history reviewed the DLSCT studies independently; if any discrepancy occurred, the final staging was decided by consensus. Two reading sessions occurred a week apart. In the first reading session, only the conventional CT images (120 kV[peak]) were available. In the second reading session, the conventional CT images with the addition of the iodine density, color overlay iodine density, and Z-effective spectral images were available. The local tumor staging data were compared with the surgical tumor stage determined from the multidisciplinary team meeting after histopathologic confirmation. The outcome of radiologic assessment compared with surgical staging was recorded as no change in T-staging, upstaging, or downstaging.
Statistical Analysis
All statistical analyses were computed using STATA (Version 12.1; StataCorp). Mucosa, muscle, and tumor tissue iodine density and Z-effective values were reported as mean and SD. Comparison of iodine density and Z-effective values between HNSCC and healthy muscle and mucosa was performed using an unpaired 2-tailed Student t test. The absolute contrast difference between HNSCC and healthy mucosa iodine and Z-effective images was calculated because both the iodine density and Z-effective images are noiseless with the SD approaching 0. Receiver operating Characteristic (ROC) curves quantified the performance of iodine density and Z-effective values to discriminate tumor from normal mucosal tissue. ROC areas under the curve were presented as an overall assessment of the diagnostic value of each technique and were compared. An optimal cut-point for each was determined (Youden Index: maximum sensitivity + specificity–1) that maximized both sensitivity and specificity. Using these cut-points for the Z-effective score and iodine density, we compared tumor identification with the predefined histopathologic tumor status. The κ statistic was used to assess the level of agreement between each spectral technique and known tumor status. The number and details of nonagreement were also noted. Finally, descriptive statistical analysis of the local tumor staging of conventional CT images only versus conventional CT with the addition of each spectral data technique was compared with the criterion standard surgical staging/histopathology. Time taken to interpret and perform the spectral analysis was recorded. Mean (SD) and range taken for each reader to interpret the spectral data were calculated.
RESULTS
Quantitative Data
The control group comprised 15 patients (7 women and 8 men; age range, 21–84 years; mean age, 55.3 [SD, 18.9] years). Iodine density and Z-effective values for normal tissue subsites are summarized in the Table. Iodine density and Z-effective values showed slight variation among the mucosa subsites, with the floor of mouth and palatine tonsil having the highest values and buccal mucosa being the lowest.
The HNSCC group consisted of 21 patients (5 women and 16 men; age range, 35–80 years; mean age, 62.0 [SD 10.2] years). Patient demographics and tumor subsite distributions are shown in the Online Supplemental Data. Four participants had histologically confirmed HPV-positive HNSCC. The HPV-associated HNSCC was not statistically analyzed as a separate entity due to the small sample size, in order to produce meaningful statistical results.
The mean iodine density value of tumor was 2.01 (SD 0.26) mg/mL (95% CI, 1.70–2.51 mg/mL), and the Z-effective value was 8.21 (SD, 0.36) (95% CI, 8.05–8.91). HNSCC demonstrated a higher mean iodine density (P < .001) and Z-effective values (P < .001) (Fig 2) compared with normal tissue. The absolute contrast difference between healthy mucosa and HNSCC for iodine density and Z-effective values was 0.87 mg/mL and 0.38, respectively. A high interobserver correlation was demonstrated for placement of the ROI for both normal mucosa of the control group (iodine density, κ = 0.71, and Z-effective values, κ = 0.78) and the HNSCC group (iodine density, κ = 0.84, and Z-effective values, κ = 0.75). The ROC area under the curve was slightly greater for iodine density, 0.98, in comparison with the Z-effective value, 0.93 (P = .27) (Fig 3). The optimal iodine density threshold of 1.58 showed a sensitivity of 1 and specificity of 0.93, while the optimal Z-effective threshold of 8.08 showed a sensitivity of 0.86 and specificity of 0.93, respectively.
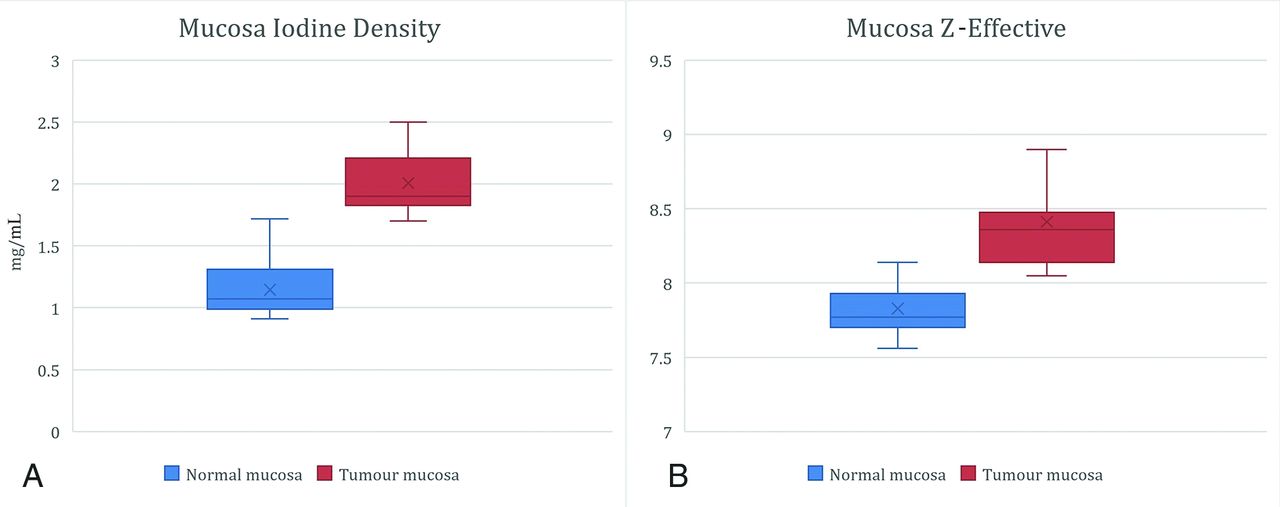
Head and neck squamous cell carcinomas demonstrate a higher mean iodine density = 2.01 (SD 0.26) mg/mL (95% CI, 1.70−2.51 mg/mL) and mean Z-effective value = 8.21 (SD, 0.360) (95% CI, 8.05–8.91) compared with normal tissue (P < .001).

ROC plot of the iodine density and Z-effective values for differentiation of upper aerodigestive HNSCC from normal mucosa tissue. The optimal iodine density cutoff is 1.58 (95% CI, 1.45−1.71; P < .001) with a sensitivity of 1 and a specificity of 0.93. The optimal Z-effective cutoff is 8.08 (95% CI, 7.96–8.19; P < .001) with a sensitivity of 0.86 and a specificity of 0.93, respectively.
Qualitative Results: Impact on Staging
The addition of iodine density and Z-effective images improved local tumor staging compared with the conventional CT images (120 kVp) alone. Visually, the iodine density and Z-effective images provided better delineation of the tumor margin (Fig 4). Upstaging occurred in 3 patients, which included detection of paraglottic involvement in vocal cord squamous cell carcinoma (T2 to T3) (Fig 5), cartilage invasion in post-cricoid hypopharyngeal squamous cell carcinoma (T3 to T4a), and mandible bone invasion from buccal/alveolar mucosa squamous cell carcinoma (T3 to T4a) (Fig 6). No false-positive cases were encountered.

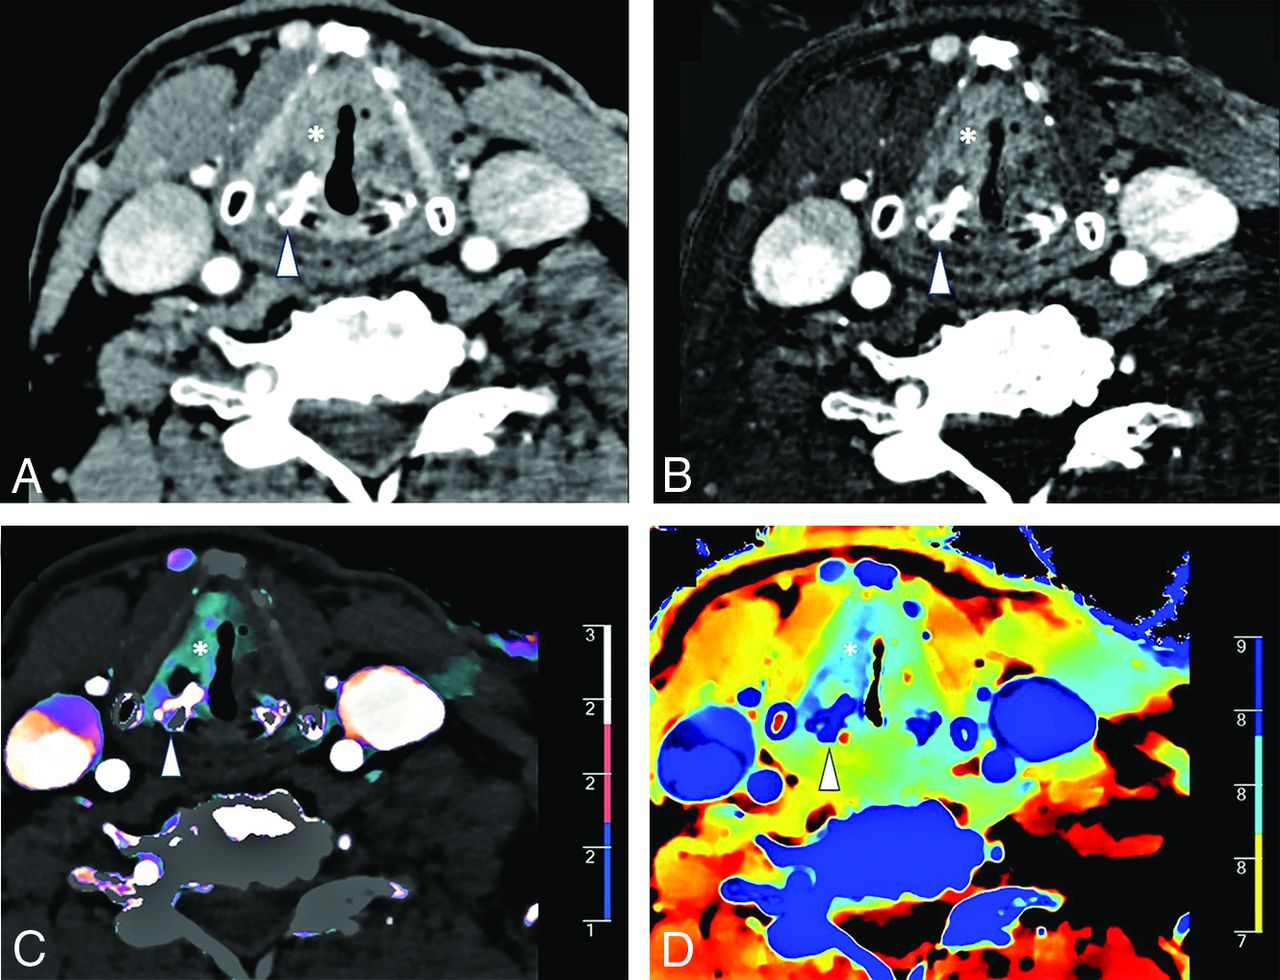
A 61-year-old man with left oral tongue squamous cell carcinoma (arrow) seen on a conventional CT image (A). Iodine density (B), color iodine density overlay (C), and Z-effective (D) images show markedly improved contrast resolution of the tumor from the surrounding normal oral tongue mucosa. The left oral tongue tumor has an iodine density = 2 mg/mL and a Z-effective value = 8.33. Normative oral tongue mucosa values from the healthy control cohort are iodine density = 0.92 mg/mL and Z-effective value = 7.67.
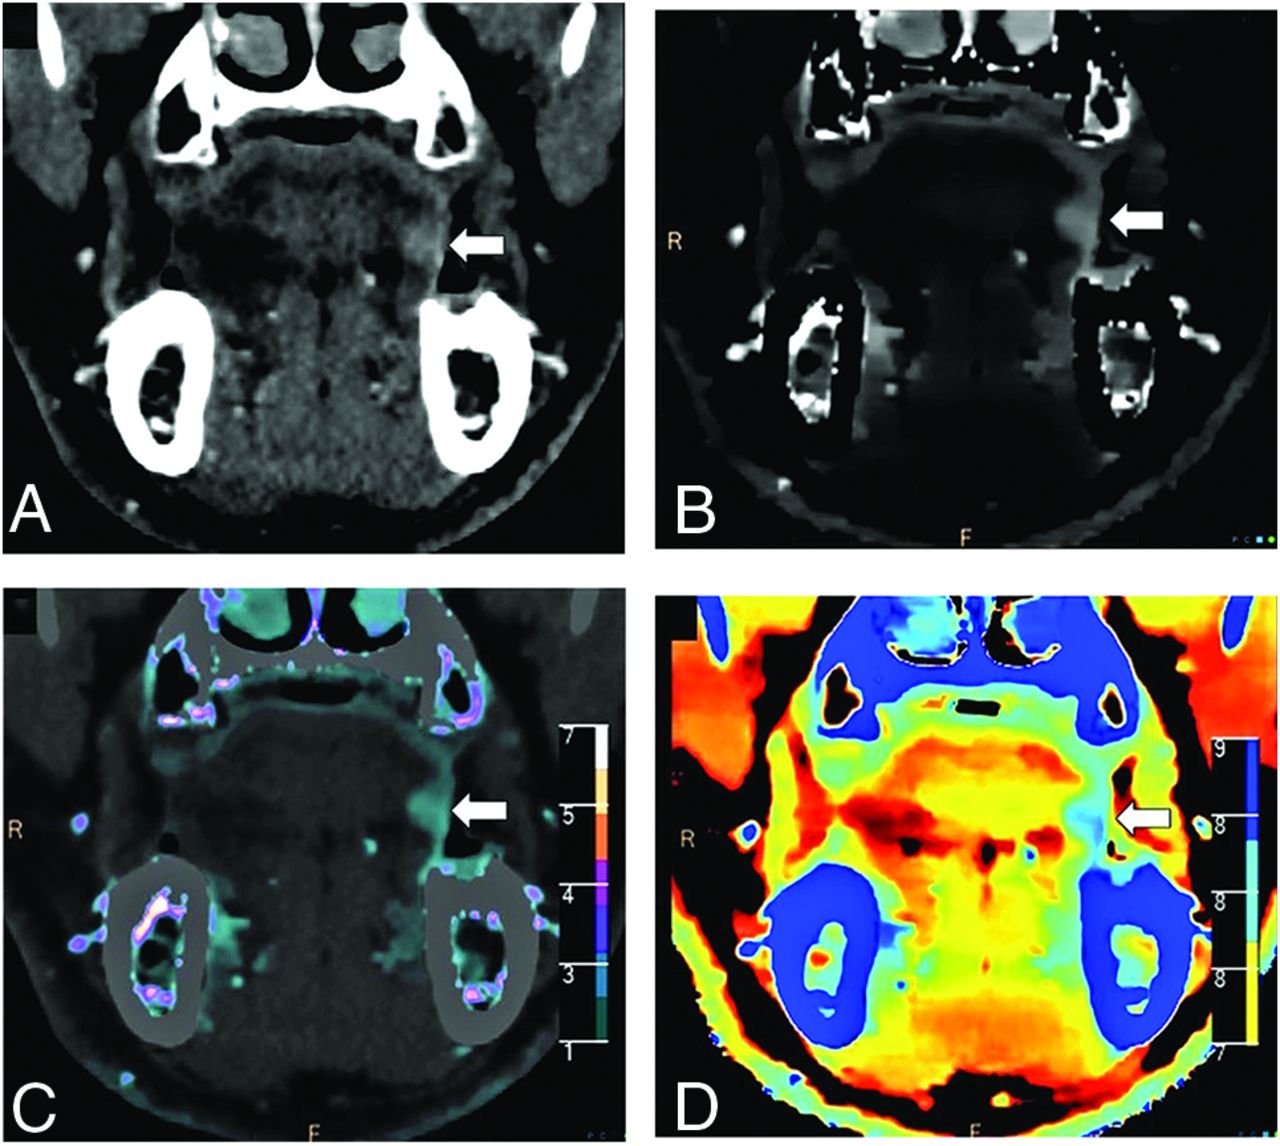
A 70-year-old man with left vocal cord squamous cell carcinoma (asterisk) and asymmetric sclerosis of the right arytenoid cartilage (arrowhead) seen on a conventional CT image (A). Iodine density (B), color iodine density overlay (C), and Z-effective (D) images reveal right paraglottic fat involvement with increased iodine density. The patient was upstaged from T2 to T3.

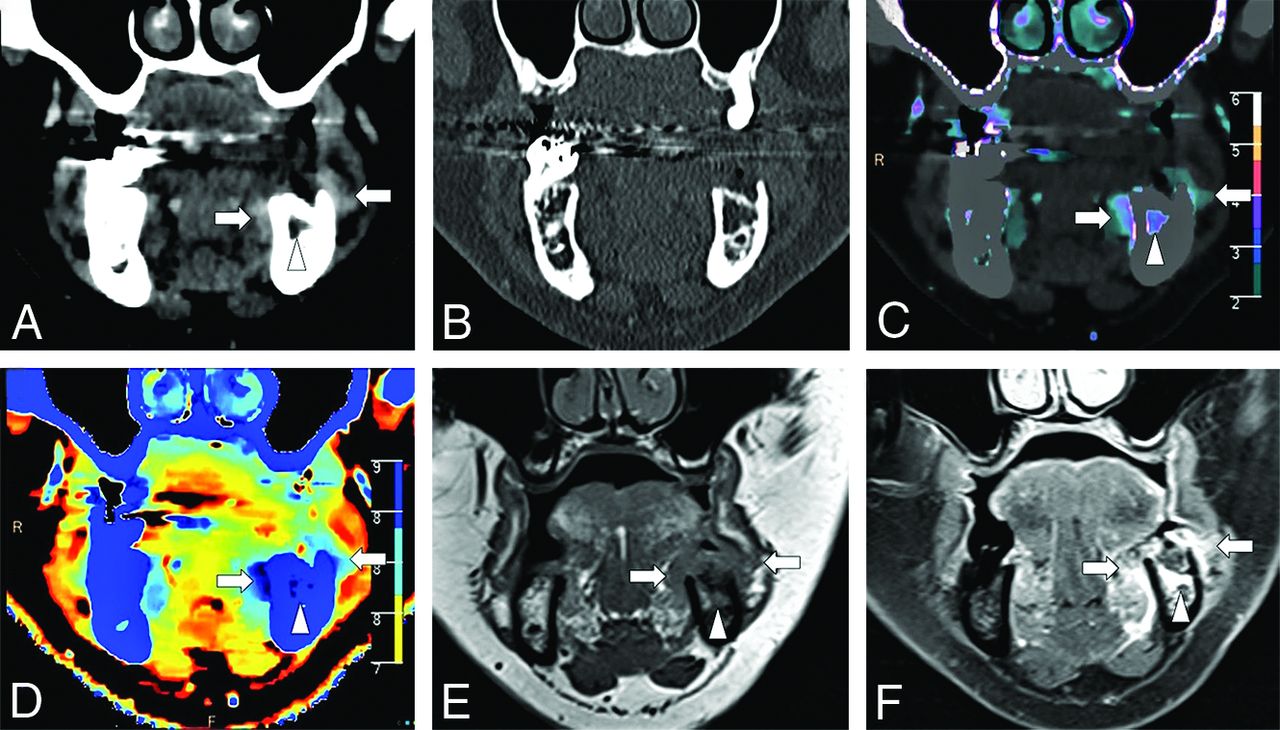
A 63-year-old man with left buccal and alveolar mucosa squamous cell carcinoma (arrows) seen on the conventional images in soft-tissue (A) and bone (B) window settings. Iodine density (B), color iodine density overlay (C), and Z-effective (D) images reveal right mandibular bone invasion with increased iodine density in the medullary cavity of the left hemimandible (arrowhead). T1-weighted MR imaging (E) and post-gadolinium-enhanced T1 fat-saturated (F) image confirm bone marrow infiltration. The patient was upstaged from T3 to T4a.
Time Taken for the Interpretation of the Spectral Images
The time taken to interpret and perform the spectral analysis was recorded. Reader 1 took 13.53 (SD, 1.77) minutes (range, 12–18 minutes) to analyze the spectral CT data for healthy subjects and 15.25 (SD 1.68) minutes (range, 13–19 minutes) to analyze the spectral CT data for subjects with HNSCC. Reader 2 took 13.60 (SD, 1.90) minutes (range, 11–18 minutes) to analyze the spectral CT data for healthy subjects and 15.55 (SD, 1.7) minutes (range, 12–20 minutes) to analyze the spectral CT data for subjects with HNSCC.
DISCUSSION
The results demonstrate that quantitative analysis of spectral CT data can improve diagnostic confidence in local staging of upper aerodigestive HNSCC. Our patient cohort with upper aerodigestive HNSCC showed higher iodine density and Z-effective values compared with those of normal upper aerodigestive mucosal tissue. ROI measurements of the normal mucosa and tumor also showed a high interobserver correlation. On the basis of the ROC curve analysis, the optimal thresholds of iodine density and Z-effective values showed high sensitivity and specificity for differentiation between tumor and normal mucosal tissue. DLSCT is a relatively new technology with only 1 prior published study analyzing DLSCT spectral parameters in head and neck cancer. This study also found increased iodine density in tumor tissue compared with surrounding healthy tissue, as well as improved tissue contrast at monoenergetic 40 keV-equivalent reconstructions compared with conventional CT reconstructions.5 The results from this study extend on these prior quantitative findings by also demonstrating that the qualitative assessment of tumor staging is enhanced using iodine density and Z-effective overlay images by increasing tumor boundary distinction and therefore assisting in local tumor staging. Although Z-effective images did show inherently poorer spatial resolution and lacked detailed anatomic resolution seen on the iodine density and conventional CT images, Z-effective images were particularly useful at distinguishing the margin where 2 adjacent tissues had significantly different inherent atomic numbers. For example, Z-effective overlay maps increased the distinction of tumor adjacent or invasion into tissue planes such as paraglottic fat, cartilage, or bone, which is clinically relevant in determining local tumor staging.
Earlier studies have shown the benefits of the dual-energy spectral Hounsfield unit curve and the effective atomic numbers in differentiating benign and malignant neck pathologies.9 Currently, the more widely used postprocessed dual-energy CT image to enhance tumor–soft tissue contrast resolution has been achieved using virtual monochromatic image reconstructions with optimal contrast resolution and delineation of the head and neck tumor margin at 40 KeV.5,10,11 Dual-source CT data can also be used to better depict residual and recurrent tumor, which shows statistically higher spectral Hounsfield units at 40 keV and higher iodine concentration, enabling differentiation from benign posttreatment changes.11 This application is yet to be validated on the DLSCT scanner.
This study is the first to propose a healthy control group reference range of normal iodine density and Z-effective values across mucosal and selective neck muscle subsites. There are minimal physiologic variation of iodine density and Z-effective values across the mucosa subsites, with the floor of mouth and palatine tonsil showing consistently higher values across the healthy patient cohort. Head and neck histopathologic studies have previously identified a greater abundance of lymphovascular networks at mucosal subsites with minor salivary and/or intrinsic lymphoid tissue, and this finding is hypothesized to be the cause for consistently increased iodine density and Z-effective values at these 2 mucosal subsites in healthy patients.12,13
Performing and interpretating of spectral data analysis required training and can be time-consuming. In our study, it took both trained readers, on average, 13−15 minutes to perform and interpret the spectral data for research purposes, but we anticipate that incorporation of spectral analysis into clinical practice would be longer because the radiologists need to incorporate the spectral results into a meaningful report.
There were several limitations to this study. First, the study has a small sample size of patients with HNSCC and healthy controls; however, despite the small cohort, significant differences between iodine density and Z-effective values in the tumor and control groups were demonstrated. Future studies with larger patient cohorts would be helpful to further consolidate these initial findings and increase the statistical accuracy of healthy and disease thresholds. The interobserver agreement in local tumor staging and final ROIs for both Z-effective values and iodine density was not undertaken; however, there were no discrepancies in local tumor staging and complete consensus on final ROIs between 2 expert radiologists. This study did not analyze DLSCT parameters in normal or metastatic lymph nodes. This domain has previously been evaluated on dual-source CT by groups such as Foust et al14 and Tawfik et al,15 who have shown that metastatic HNSCC lymph nodes, predominately HPV-positive nodes, have statistically lower iodine density compared with normal nodes. Quantitative CT analysis opens the possibility of radiogenomics, which can exploit potential differences in DLSCT parameters between HPV-positive and HPV-negative HNSCC. This ]concept has already been applied to distinguishing esophageal squamous cell carcinoma and adenocarcinoma on the basis of the iodine concentration at 40–70 keV.16
CONCLUSIONS
This study demonstrates that DLSCT-derived iodine density and Z-effective images provide both valuable quantitative data and improved contrast resolution for qualitative assessment of upper aerodigestive HNSCC. DLSCT parameters with conventional CT images were found to enhance local tumor staging accuracy compared with surgical histopathology.
Summary of iodine density and Z-effective values for normal tissue subsites
ACKNOWLEDGMENT
The authors thank Dr. Michael Lousick and Dr. Matthew Devine for assisting with ethics proposal and editing of the manuscript.
Footnotes
This study was awarded the Gabriel H. Wilson Award at the Western Neuroradiology Society Annual Meeting, September 26–29, 2019; Coeur d’Alene, Idaho, and was represented at the Annual Meeting of the American Society of Neuroradiology, May 30 to June 4, 2020; Virtual.
Disclosures: Yael Nae—UNRELATED: Employment: Philips Healthcare, Comments: I am an employee in the Philips Healthcare CT/Advanced Molecular Imaging business.
References
- Received August 3, 2020.
- Accepted after revision April 20, 2021.
- © 2021 by American Journal of Neuroradiology


Jump to section
Related Articles
Cited By...
- No citing articles found.