Abstract
BACKGROUND AND PURPOSE: Persistent T1-hypointense lesions (“black holes”) are thought to represent permanent damage of brain parenchyma. We attempted to ascertain whether the metabolic profiles of these hypointense areas support this hypothesis and whether these profiles correlate with these hypointense findings.
METHODS: Four patients with relapsing-remitting multiple sclerosis and four matched control volunteers underwent MR imaging and 3D proton MR spectroscopy. Absolute levels of N-acetylaspartate (NAA), creatine, and choline (Cho) were obtained in 0.19 cm3 voxels containing 14 T1-hypointense lesions (average volume, 0.4 cm3; range, 0.2–1.0 cm3) in patients. Metabolite levels were analyzed, by using Pearson correlation, against their respective lesions’ hypointensity relative to the surrounding normal-appearing white matter.
RESULTS: Moderate correlation, r = 0.56, was found between the NAA level and MR imaging hypointensity. Of the 14 lesions studied, 12 were deficient in NAA and 11 had excess Cho compared with corresponding brain regions in control volunteers. Only one lesion was significantly deficient in all three metabolites, indicative of total damage or matrix loss.
CONCLUSION: No relationship was found between the hypointensity of the lesions and their metabolic profile. Specifically, lesions with the same hypointensity on T1-weighted MR images were metabolically variable (ie, displayed disparate metabolite levels and behavior). Also, although 86% of the lesions exhibited abnormally low NAA, 71% also had increased Cho. This indicates that although neuronal damage had already occurred (lower NAA), these lesions were still “smoldering” with active membrane turnover (high Cho), most likely because of de- and remyelination, indicative of shadow plaques (remyelinated lesions). Consequently, relapsing-remitting hypointense lesions represent neither final-stage nor static pathologic abnormality.
MR imaging is the most sensitive probe of disease load in cases of multiple sclerosis, and T2-weighted imaging excels in hyperintense lesion detection (1–3). Despite this sensitivity, the T2-weighted lesion load correlation with clinical disability has been variable at best (4, 5). This discrepancy could be explained, in part, by the nonspecificity of T2-weighted hyperintensity, which can arise from edema, mild (reversible) or severe chronic demyelination, inflammation, axonal loss, and gliosis. In contrast, the load of persistent T1-weighted hypointense lesions on short-TE, short-TR, spin-echo MR images (6), reported first by Uheln-brock and Sehlen (7), correlated well with chronic disability (8, 9). Because they also exhibited higher water diffusivity and lower fractional anisotropy on diffusion-weighted images (10), it was hypothesized that they reflect substantial irreversible tissue destruction and axonal loss, which are more likely to contribute to permanent clinical impairment (11–14).
Recent studies have shown that the varying degrees of T1-weighted hypointensities could represent different levels of disease activity (11–17) and, therefore, correlate with the lesions’ metabolism obtained with localized proton MR spectroscopy (15, 16). These investigations, however, used single-voxel localization and focused on the late-stage, secondary progressive form of multiple sclerosis. This form is characterized by accumulation, over many years, of significant, unrecoverable, parenchymal, axonal, and neuronal losses (18).
Our study focused on patients with the earlier, most common, relapsing-remitting stage of multiple sclerosis. Our goals were to examine, with high-spatial-resolution multivoxel 3D proton MR spectroscopy, whether all T1-hypointense lesions are metabolically equivalent or whether their degree of hypointensity correlates with any or all of the local metabolic abnormalities.
Methods
Study Participants
Four patients with relapsing-remitting multiple sclerosis (three women and one man) were included in the study. All patients were white and ranged in age from 27 to 43 years. Their disease durations, measured from the time of diagnosis, ranged from 5 to 10 years (average duration, 8 years). Four age-, race-, and sex-matched control volunteers underwent the same 3D proton MR spectroscopic procedure in the same brain regions, to provide reference metabolite values. All participants were briefed on the procedure, and all provided written Institutional Review Board-approved consent.
MR Imaging and 3D Proton MR Spectroscopy
All MR imaging measurements were performed by using a 1.5-T system (Magnetom 63SP; Siemens AG, Erlangen, Germany). T1-weighted spin-echo axial, sagittal, and coronal MR images (450/15 [TR/TE]) and T2-weighted spin-echo axial MR images (2500/90) were obtained with 240 × 240 mm2 fields of view and 256 × 256 matrices. Section thickness was 7.5 mm in the axial and 10 mm in the coronal and sagittal directions. Automatic shim was then applied to yield consistent 9.0 ± 1.0 Hz full width at half-maximum whole-head water line widths (19). A 3D proton MR spectroscopy hybrid with a TE of 135, consisting of 1D 8th order Hadamard with 2D 16 × 16 chemical shift imaging, was then performed (20). It excited image-guided 8LR × 10AP × 6IS cm3 left-right (LR) × anteroposterior (AP) × inferior-superior (IS) volumes of interest, as shown in Figures 1 and 2, and partitioned them into 8LR × 10AP × 8IS = 640 voxels of 1.0LR × 1.0AP × 0.75IS = 0.75 cm3 each. With a TR of 1.6 s, optimal for 1.3 to 1.4 s T1s of in vivo metabolites (21, 22), the entire session took <1.5 hours.
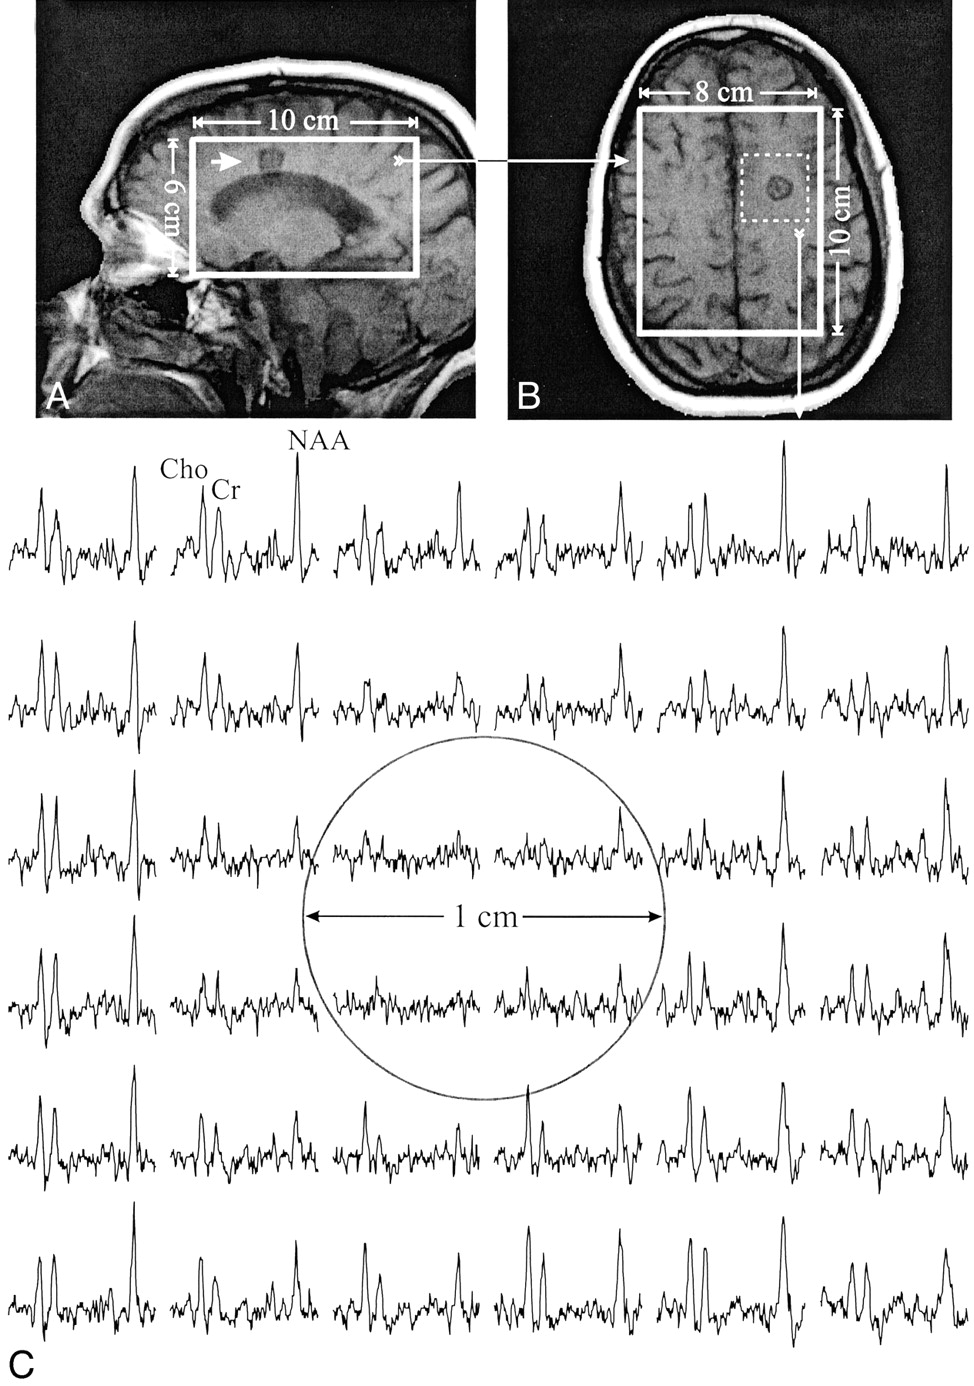
T1-weighted MR images of a 43-year-old female patient with multiple sclerosis, superimposed with the size and location of the 8LR ×10AP cm2 MR spectroscopy volumes of interest. The volumes of interest contained an approximately 1-cm diameter T1-hypointense lesion (arrow); the metabolite concentration ratios were NAA = 0.18, Cr = 0.21, and Cho = 0.25. The image contrast ratio was 0.76.
A, Sagittal view.
B, Axial view.
C, Real part (1.7–3.7 ppm range) of a 6 × 6 proton spectra matrix (0.2 cm3 voxels) from the 3 × 3 cm2 dashed box shown in B, containing the lesion (circle).

Corresponding T1-weighted MR images of a matched control participant, superimposed with the outline of the 8LR ×10AP cm2 proton MR spectroscopy volumes of interest.
A, Sagittal view.
B, Axial view.
C, Real part of a 6 × 6 proton spectra matrix (0.2 cm3 voxels) from the 3 × 3 cm2 dashed box shown in B. Circle indicates the region corresponding to the lesion shown in Figure 1C. The spectra span the same chemical shift (1.7–3.7 ppm) and intensity range as those in Figure 1C.
The MR imaging and 3D proton MR spectroscopy data were processed off-line. Residual water and lipid signals were removed in the time domain (23, 24), and the data were apodized with a 1-Hz Lorentzian filter and were zero-filled to 2048 points. No spatial filters were applied. The axial 16 × 16 chemical shift imaging matrix was zero-filled to 32 × 32, rendering a nominal voxel size of 0.19 cm3, and was voxel-shifted to align the chemical shift imaging grid with the volumes of interest (25). Additional small voxel shifts were made for the patients, to optimize the chemical shift imaging grid over each lesion when necessary (see Fig 1). The data were then Fourier transformed along the left-right, anteroposterior, and spectral directions and were Hadamard transformed along the inferior-superior direction (20). Finally, automatic frequency and 0 (and 1st) order phase corrections were made, referencing N-acetylaspartate (NAA) (and choline [Cho]) peaks in voxels where either (or both) were present.
Metabolite Quantification
The relative concentrations of NAA, creatine (Cr), and Cho were calculated from their peak areas by using the parametric spectral modeling and least-squares optimization presented by Soher et al (26). It uses a priori spectral information, automatic phasing, nonparametric baseline characterization, and Lorentz-Gauss line shape assumption. A previous analysis showed that for 5-Hz line widths, similar to those in this study, the mean errors of the fit were NAA = 3 .4%, Cr = 3%, and Cho = 2.8% (27).
Relative levels were converted into absolute concentrations by repeating the same experiment in a reference 3-L sphere of 10.9 mmol/L NAA in water. Because phantom and head experience the same RF and magnetic field imperfections, correction for neither was necessary.
The absolute concentration of the jth metabolite (j = NAA, Cr, or Cho) in the ith voxel, Qji, was scaled simply and similarly to the scale used by Soher et al (22) from the 10.9 mmol/L reference phantom by using the following equation:  1) where Sj0i(V) and Sj0i(P) are the metabolites’ equilibrium signals in the participants and the phantom, respectively. The voltages into the coil required for a nonselective, 1-ms, 180-degree inversion pulse on the participant and 3-L phantom, VV180° and VP180°, reflect the relative “receive” sensitivities.
Sj0i(V) in equation 1 was obtained by accounting for the different longitudinal T1 and transverse T2 values of the phantom (NAA only) and those reported in vivo, as shown in the following equation:  2) where Sji is the jth metabolite’s peak area in the ith voxel. The in vivo T1/T2 values used were NAA = 1.5/0.43 s, Cr = 1.6/0.21 s, and Cho = 1.2/0.36 s (21, 22), similar to those reported for multiple sclerosis lesions and normal-appearing white matter (15, 28, 29). Note that, although the use of one T1/T2 value ignores possible regional variations (21, 30), it does not adversely affect the consistency of the analysis, because voxels in similar anatomies were compared between patients and control volunteers.
Lesion Selection and Characterization
Because acute hypointensity on T1-weighted MR images could also be transient (6, 31), to ensure that only persistent lesions were studied, only those that also presented on T2-weighted MR images obtained at least 3 months earlier were chosen, as suggested by Barkhof et al (6). The ratio of the average image intensity across a lesion to its proximal normal-appearing white matter on axial T1-weighted MR images gave its contrast ratio. Because “hypointense” was defined as “darker than the normal-appearing white matter by more than 2 SD of the intensity distribution of the latter,” only lesions with contrast ratios ≤0.95 were selected. Absolute NAA, Cr, and Cho levels in the voxel(s) containing each lesion were divided by the matched control values in corresponding voxels (see Figs 1 and 2) to yield a normalized metabolite concentration ratio for which “normal” is 1.0.
Statistical Analyses
Pearson correlation (r) was used to test for significant (two-tailed P value ≤.05) relationships between each metabolite concentration ratio and the contrast ratio and among the metabolite concentration ratios of different metabolites. The number of lesions with significantly abnormally low metabolite levels for all three metabolites was also counted. “Significant” abnormality was defined as >2 SD from levels obtained from corresponding anatomy in the control participants: >30% for NAA, >46% for Cr, and >48% for Cho (32).
Results
In all, 14 T1-hypointense lesions (six in the male patient, three in each of two female patients, and two in the third female patient) with an average volume of two voxels (range, one to five voxels) (ie, approximately 0.4 cm3 [range, 0.2–1.0 cm3]) satisfied the lesion selection criteria outlined above for our patients. None of these lesions were enhancing on contrast-enhanced T1-weighted MR images. These lesions fell into two categories of hypointensity: severe, defined by van Walderveen et al (15) as iso- or hypointense to normal-appearing gray matter, and moderate otherwise. Consequently, the average “cutoff” contrast ratio of the normal-appearing gray matter-normal-appearing white matter was 0.83, which rendered five lesions severely hypointense and nine more moderate, as indicated in Figure 3.

Contrast ratio (CR) of the lesions’ signal intensity versus metabolite concentration ratios (MCR) of NAA, Cr, and Cho for A, the 14 persistent T1-hypointense lesions in all patients, and B, six persistent T1-hypointense in the same 41-year-old male patient in whom images and spectra were obtained during the MR imaging–MR spectroscopy session. In both figures, hypointensity was characterized as severe if it was darker than the contrast ratio of normal-appearing gray matter (< 0.83), in accordance with van Walderveen et al (15).
Plots of the contrast ratio versus the metabolite concentration ratio of NAA, Cr, and Cho for all 14 lesions are shown in Figure 3A. Moderate (r = 0.56) correlation was found only between the contrast ratio and the metabolite concentration ratio of NAA. A moderate trend (P = .066, r = 0.52), which did not reach significance, was detected between the metabolite concentration ratio of Cho and contrast ratio. A moderate, r = 0.53, relationship was also found between the metabolite concentration ratios of Cho and NAA (Fig 4). Of the 14 lesions examined, only the one shown in Figure 1 had significantly low metabolite concentration ratio of all three metabolites.

Cho versus NAA metabolite concentration ratios (MCR) for the 14 T1-hypointense lesions from all patients. Shaded oval highlights a region with a narrow 50% range (1.0–1.5) of elevated Cho levels, corresponding to a broad ±450% range (0.2–0.9) of low NAA levels.
One patient had six T1-hypointense lesions within the volumes of interest; images of all these lesions were obtained in a single MR imaging and MR spectroscopy session, and each had the localization grid individually optimized over it separately, by voxel shifting, in postprocessing. These six lesions were also analyzed as a separate group, and plots of their contrast ratio versus NAA, Cr, and Cho metabolite concentration ratios are shown in Figure 3B. None of these correlations were statistically significant.
Discussion
A few studies have investigated the metabolic behavior of T1-hypointense lesions, most recently those presented by van Walderveen et al (15) and Bitsch et al (17). At a high (<0.2 cm3) spatial resolution, our approach offers several advantages. Three-dimensional imaging is the most efficient way in signal-to-noise per unit-time ratios to study multiple lesions in the same patient. Voxel shifts can optimize the grid over each lesion during postprocessing. Single-voxel MR spectroscopy inspects large (typically 1.5–2 cm) elements (3). Because a typical lesion is <1 cm3 (33), partial volume from normal-appearing white matter can be severe (>70%) when using single voxels, potentially confounding the interpretation.
T1-hypointense lesion loads have been advocated as metrics of unrecoverable damage based on the notion that all black holes represent the same pathologic finding (14). Our results indicate, however, that the metabolite concentration ratios of NAA, Cr, or Cho can exhibit large (≤350%) variations in the T1-hypointense lesions of patients with relapsing-remitting multiple sclerosis (Fig 3A). Consequently, hypointensity does not usually correspond to any characteristic metabolic “fingerprint.” For example, NAA metabolite concentration ratio ≅0.45 corresponds to >20% range of contrast ratio in Figure 3A. This observation is consistent with that of a recent study in which MR imaging hypointensity correlated neither with axonal loss nor with histologically determined de- or remyelinating activity (17). In our study, even lesions in the same person from the same MR imaging-MR spectroscopy session were not metabolically equivalent and none of their metabolite concentration ratios correlated with the contrast ratio (Fig 3B). Therefore, it seems that the specificity of the notion of “hypointense T1-weighted lesion load” might need to be critically reexamined.
Furthermore, it was suggested, on the basis of metabolite deficiencies revealed by MR spectroscopy and histopathologic analysis, that T1-hypointense lesions might reflect substantial irreversible tissue destruction and axonal loss (6, 11–13). Specifically, a recent single-voxel proton MR spectroscopy study reported significant correlations between the contrast ratio and all three metabolites (NAA, r = 0.49; Cr, r = 0.37; Cho, r = 0.33) in 24 T1-hypointense lesions (15), in contrast with our finding of such a relationship at a similar r value for only the NAA in 14 such lesions. However, patient population was a major difference between the two studies. Their study included predominantly patients with secondary progressive multiple sclerosis (12 of 14 patients), whereas our study included exclusively patients with relapsing-remitting multiple sclerosis. This perhaps led to three disparate observations, as follows.
First, of 14 lesions, only the one shown in Figure 1 exhibited significantly abnormal low levels for all three metabolites. No correlation was found between either the Cr or the Cho and the contrast ratio, consistent with recent reports presented by Bitsch et al (17) and Lassmann et al (34). Cr/phosphocreatine represents high-energy phosphate reserves in the cytosol of neurons and glial cells, providing for homeostasis and energy needs (35). Its elevation has been attributed to synergetic effects of oligodendrocytic remyelination and astrocytic microgliosis in lesions (36). Cho, which is found in all cell membranes, is considered an index of phospholipid metabolism (37) and increases after inflammation and demyelination in lesions and normal-appearing white matter in animals and humans (38–40). Present in both neurons and glial cells, the levels of both Cho and Cr were shown to be several times higher in astrocytes and oligodendrocytes in cell culture extracts (41).
Second, although 12 (86%) of 14 lesions exhibited lower NAA (metabolite concentration ratio <1.0), 10 (71%) of 14 had increased Cho (metabolite concentration ratio >1.0), as shown in Figure 3A. This indicates that although neuronal damage has already occurred (lower NAA), possibly explaining the correlation of T1-weighted lesion load with disability (15, 16), these lesions are still “smoldering” with active membrane turnover (high Cho). Consequently, relapsing-remitting hypointense lesions represent neither final-stage nor static pathologic findings.
Third, the intermediate correlations between the metabolite concentration ratio of NAA and the contrast ratio (r = 0.56) in Figure 3A, and between metabolite concentration ratios of Cho and NAA (r = 0.53) in Figure 4 may indicate where the smoldering is leading. Over time, perhaps past the relapsing-remitting to the secondary progressive transition, demyelination and destructive processes prevail, and these currently “active” lesions would become true black holes, deficient in all metabolites (15). Histopathologic evidence for this pathway (17, 42) might explain why disability correlates better with the T1-weighted hypointense lesion load in patients with secondary progressive multiple sclerosis than in patients with relapsing-remitting multiple sclerosis (9).
Because both de- and remyelination would lead to elevation of Cho, whereas either remyelination or gliosis could lead to elevation of Cr, it cannot be drawn from the data shown in Figure 3 or from the MR images which process is responsible (43). Note, however, that a 450% metabolite concentration ratio range of NAA (0.2–0.9) corresponds to only 50% (1.0–1.5) variation in the metabolite concentration ratio of Cho (Fig 4, shaded region). If lower NAA reflects axonal dysfunction or loss from demyelination only, then for the fewer remaining intact axons, the high Cho level from demyelination activity should decline proportionally, contrary to the observation. Furthermore, if Cho and Cr represented the same process, either inflammation or demyelination or remyelination alone, correlation between their metabolite concentration ratios would have been expected. However, such a relationship was not found. This contradiction might indicate a second, parallel, Cho-involving but axonal-sparing process (eg, remyelination), as suggested recently by Lassmann et al (34). With intensity proportional to the number of demyelinated axons, the net result, depending on the individual rate of each process, could be a nearly constant Cho metabolite concentration ratio. Furthermore, competing damage and repair processes, especially early in the lesion’s evolution, could extend the remaining axons’ viability (17, 34). Because current treatments for multiple sclerosis are anti-inflammatory, identifying such processes in an attempt to shift their balance toward repair is clearly of high clinical significance (17).
Finally, we offer a cautionary note. In contrast to the low NAA in 86% and high Cho in 71% of the T1-hypointense lesions, the Cr levels display high variability, with seven of 14 lesions having metabolite concentration ratios <1.0 and the other 50% having metabolite concentration ratios >1.0 (Fig 3). Because constant Cr level is commonly assumed when using metabolite ratios, NAA/Cr and Cho/Cr, in lieu of quantification (44–46), such ratios could be misleading, exacerbating the extent and even direction of NAA and Cho changes.
Conclusion
This study shows that even lesions with the same T1 hypointensity in patients with relapsing-remitting multiple sclerosis are neither metabolically equivalent (ie, having the same metabolite levels and relationships among them) nor do they constitute static end points. Therefore, despite MR imaging contrast similarity, they probably do not represent a unique type of pathologic finding but rather varying stages, types, activities, and dynamics of axonal dysfunction, damage, or (partial) recovery.
Footnotes
Supported by National Institutes of Health grants NS33385, NS37739, NS29029, and EB00207.
References
- Received May 21, 2002.
- Accepted after revision July 30, 2002.
- Copyright © American Society of Neuroradiology