Abstract
BACKGROUND AND PURPOSE: Cerebral microbleeds are thought to have potentially important clinical implications in dementia and stroke. However, the use of both T2* and SWI MR imaging sequences for microbleed detection has complicated the cross-comparison of study results. We aimed to determine the impact of microbleed sequences on microbleed detection and associated clinical parameters.
MATERIALS AND METHODS: Patients from our memory clinic (n = 246; 53% female; mean age, 62) prospectively underwent 3T MR imaging, with conventional thick-section T2*, thick-section SWI, and conventional thin-section SWI. Microbleeds were assessed separately on thick-section SWI, thin-section SWI, and T2* by 3 raters, with varying neuroradiologic experience. Clinical and radiologic parameters from the dementia investigation were analyzed in association with the number of microbleeds in negative binomial regression analyses.
RESULTS: Prevalence and number of microbleeds were higher on thick-/thin-section SWI (20/21%) compared with T2*(17%). There was no difference in microbleed prevalence/number between thick- and thin-section SWI. Interrater agreement was excellent for all raters and sequences. Univariate comparisons of clinical parameters between patients with and without microbleeds yielded no difference across sequences. In the regression analysis, only minor differences in clinical associations with the number of microbleeds were noted across sequences.
CONCLUSIONS: Due to the increased detection of microbleeds, we recommend SWI as the sequence of choice in microbleed detection. Microbleeds and their association with clinical parameters are robust to the effects of varying MR imaging sequences, suggesting that comparison of results across studies is possible, despite differing microbleed sequences.
ABBREVIATIONS:
- CMB
- cerebral microbleed
- KIDS
- Karolinska Imaging Dementia Study
- TSWI
- thick-section SWI
- tSWI
- thin-section SWI
- WMH
- matter hyperintensities
Cerebral microbleeds (CMBs) have lately become a focus of growing interest. Mainly related to small-vessel disease and seen as a result of hypertensive arteriopathy and cerebral amyloid angiopathy, CMBs have been proposed to have potentially important clinical implications.1⇓–3 Theories have proposed that CMBs have a possible important role in the dementia pathophysiology, and additionally, CMBs have shown associations with intracerebral hemorrhage.4
Intracerebral hemorrhage and dementia share common characteristics with CMBs. The incidence of cerebral amyloid angiopathy in patients with Alzheimer disease is up to 98%,5 and hypertension has been related to the development of dementia.6 Additionally, cerebral amyloid angiopathy and hypertension are the 2 main pathologies behind spontaneous intracerebral hemorrhage, and CMBs are thereby hypothesized to be a possible predictor for intracerebral hemorrhage.7
Correct and validated detection is essential to determine and understand CMBs and their associated clinical implications. CMBs are, due to their microscopic appearance, not visualized on CT or conventional MR imaging.1 Detection has, up until now, been with hemosiderin-sensitive sequences, T2* and SWI. Hemosiderin is a paramagnetic substance, causing inhomogeneity in the magnetic field surrounding the CMB, leading to quick decay of the MR imaging signal, called the “susceptibility effect.” T2* is a gradient recalled-echo sequence, without a refocusing 180° radiofrequency pulse, thus making it sensitive to the susceptibility effect.8 The SWI sequence, in turn, is a technique that has recently been increasingly incorporated in clinical MRI protocols. SWI maximizes the susceptibility effect by combining a long TE, fully flow-compensated 3D gradient echo, and using both the magnitude and filtered phase information.9,10 On sequences sensitive to the susceptibility effect, CMBs are represented by round hypointense dots. Factors of importance in increasing the sensitivity of CMB detection include higher spatial resolution and field and increased TE, with a longer TE increasing the susceptibility effect.3 However, this increased sensitivity may come at a cost, possibly contributing to an increased number of false-positive CMBs. Mimics of CMBs include both calcium and iron deposits, flow voids in blood vessels, and cavernomas and partial volume artifacts.3 Other reasons for CMBs may be trauma, such as diffuse axonal injury.3
While both T2* and SWI have demonstrated good histopathologic correlation,11⇓–13 the use of the 2 different CMB sequences in CMB detection has complicated the comparison of results across studies. SWI has been shown to increase the number of CMBs detected,3,14,15 and studies using the SWI sequence rather than T2* show a higher number and, in some cases, prevalence of CMBs.14,16,17 The conventional SWI sequence has a thinner section thickness than the T2* sequence. A thin section thickness has been shown to increase CMB detection15; thus, this might contribute to the increased CMB detection seen with SWI. Furthermore, higher field strengths have been shown to increase the number of CMBs detected.15 However, whether the increased sensitivity for CMBs with SWI on 3T increases the association of CMBs with clinical parameters remains unknown.
In this study, we aimed to disentangle the effect of sequence from that of section thickness by comparing CMB detection on the conventional thick-section T2*, a reconstructed thick-section SWI (TSWI), and the conventional thin-section SWI (tSWI) at 3T. By doing so, we aimed to determine the impact on CMB rating of the different MR imaging sequences and their various effects on clinical associations.
Materials and Methods
Patients
This study is part of the Karolinska Imaging Dementia Study (KIDS), a prospective cross-sectional study on the impact of CMBs on dementia. Patients were consecutively and prospectively recruited, and the inclusion criterion for this study was a dementia investigation or follow-up at the memory clinic, Karolinska University Hospital, Stockholm, Sweden. The exclusion criterion for recruitment was any contraindication to undergoing MR imaging. For this study, 246 patients (53% women; mean age, 62 ± 10 years) were recruited and had their brain scan performed on a 3T MR imaging scanner with both T2* and SWI added to the general dementia MR imaging protocol. The exclusion criterion for this study during image analysis was insufficient quality of the MR image; however, no patient was excluded for this reason. All patients underwent routine dementia assessment, including medical history; physical, neurologic, and cognitive examinations; laboratory tests; and MR imaging of the brain with CMB sequences. Diagnosis was based on the International Classification of Diseases-10 criteria, by an experienced memory clinic team, consisting of geriatricians, neuropsychologists, neurophysiologists, and neuroradiologists after all aspects had been considered.
Clinical parameters were obtained during the dementia investigation. The presence of hypertension, hyperlipidemia, and diabetes was determined on the basis of prior medical history, diagnosis, and medications. The presence of anticoagulant medication was determined by the routine clinical assessment of each patient's current medications. Each patient was asked about current smoking or alcohol consumption and known hereditary dementia. Body mass index was calculated at the time of dementia investigation and was registered for 177 patients. Cognition was graded by the Mini-Mental State Examination and was registered for 239 patients. The status of hereditary dementia was unknown in 71 patients; current smoking and alcohol consumption status was unknown or missing in 60 and 54 patients, respectively.
Patients included in this study were divided in 4 subgroups, with the following accompanying International Classification of Diseases-10 codes: Alzheimer disease (n = 62): early onset, F00.0 (n = 20), late onset, F00.1 (n = 16), atypical disease with vascular components, F00.2 (n = 24), unspecified Alzheimer disease, F00.9 (n = 2); mild cognitive impairment (n = 80): F06.7; subjective cognitive impairment (n = 71): Z03.2A, Z03.3, and R41.8A; other dementias (n = 33): alcohol-related dementia, F10.6, F10.7a (n = 2), asymptomatic hereditary dementia (n = 4), Z31.5, frontotemporal lobe dementia (n = 4), F0.70, Parkinson dementia (n = 6), G31.8a, unspecified dementia (n = 10), F03.9, vascular dementia (n = 7), F01.2, F01.3.
Informed consent was obtained from each patient, and approval was obtained from the regional ethics review board.
MR Imaging Protocol
All patients (n = 246) underwent MR imaging on a 3T Magnetom Trio scanner (Siemens, Erlangen, Germany) with a 12-channel head coil at the radiology department, Karolinska University Hospital, Stockholm, Sweden. For each patient, axial tSWI and T2* sequences and conventional MR imaging sequences, such as T1, T2, and FLAIR, were performed. tSWI was reconstructed to TSWI, by performing a minimum-intensity-projection, by using postprocessing software in the PACS system, making it possible to adjust section thickness and setting it to the same section thickness as that in T2*. Parameters for the sequences in this study were the following: tSWI: TE, 20 ms; TR, 28 ms; flip angle, 15°; section thickness, 1.6 mm; intersection gap, 0.3 mm; FOV, 172 × 230 mm; in-plane voxel size, 0.8 × 0.7 mm; total acquisition time, 5 minutes; TSWI: TE, 20 ms; TR, 28 ms; flip angle, 15°; section thickness, 4.0 mm; intersection gap, 1.2 mm; FOV, 172 × 230 mm; in-plane voxel size, 0.8 × 0.7; T2*: TE, 20 ms; TR, 620 ms; flip angle, 20°; section thickness, 4.0 mm; intersection gap, 1.2 mm; FOV, 220 × 220 mm; in-plane voxel size, 1.1 × 0.9; FLAIR: TE, 89 ms; TR, 9000 ms; flip angle, 130°; TI, 2500 ms; section thickness, 4.0 mm; FOV, 199 × 220 mm; total acquisition time, 5.5 minutes.
Image Analysis
For image analysis, 3 raters were chosen on the basis of prior neuroradiologic experience. At the initial time of rating, the raters had the following background experience: Rater 1 was an MD/PhD student, with 2 years of training and experience in neuroradiology/MR imaging. Rater 2 had been a neuroradiologist for 10 years. Rater 3 had been a neuroradiologist for 21 years.
All CMB image analysis was performed according to the Microbleed Anatomical Rating Scale,18 with the number and topography of CMBs assessed, as reported before.19 Minor modifications were made to the scale to increase the accuracy of the CMB rating: CMBs were not rated as probable, only as definitive. Hypointensities in the globus pallidus were not rated, to reduce the risk of calcifications and physiologic iron deposition mimicking CMBs. Furthermore, if the patient had a deep venous anomaly in the vicinity of a CMB, the CMB was not rated as definitive because deep venous anomalies increase the risk of adjacent cavernomas that, in turn, can mimic a CMB. The T2-weighted images and the CMB sequences were analyzed simultaneously to better distinguish vessels and flow voids, which might mimic CMBs. The Microbleed Anatomical Rating Scale and the modifications to it were thoroughly discussed by all raters before analysis. A test cohort of patients (n = 20) from the original KIDS cohort, with CMBs varyingly on T2* or SWI, imaged with the same 3T scanner, was assessed by all raters to establish consensus, before initiating the real rating session.
Rater 1 first analyzed all patients (n = 246) for CMBs, as part of the original KIDS CMB analysis.19 Interrater agreement analysis with Rater 2 was reached on the initial CMB rating, on 50 patients with CMBs and an additional 50 patients without CMBs, showing an intraclass correlation coefficient of 0.988 for all patients with CMBs, and 0.987 when the 50 patients without CMBs were added to the analysis.19 Of all patients, 55 were designated as having CMBs. The 55 patients with CMBs and 20 randomly chosen patients without CMBs were then analyzed by Raters 1, 2, and 3 six months later. The rating procedure was the same for all raters: First CMBs on the T2* sequence were rated continuously on a single day. Three days later CMBs on the tSWI sequence were rated, continuously on a single day. Six months later the TSWI sequence was rated continuously on a single day. The MR images were mixed for each rating session, to randomize the order of CMB interpretation. The raters were blinded to all patient and clinical data; the CMB sequences were not supposed to be used for rating each other's ratings and their own previous ratings.
White matter hyperintensities (WMH) were graded according to the Fazekas scale, from 0 to 3 (none or single punctate; multiple punctate; early confluent; large confluent).11 All images were rated with the rater blinded to clinical data, and other ratings performed. Rater 1 graded all images for WMH on axial FLAIR sequences. Rater 2 graded 50 of the images rated by Rater 1 for interrater agreement analysis. All images rated were randomly chosen with broad representation of the different WMH scores. The weighted κ value obtained was 0.94, which equals excellent agreement.
All radiologic ratings were performed on a PACS workstation with 2 radiologic monitors.
Statistical Analysis
McNemar and Wilcoxon signed rank tests were used to determine the difference between the prevalence and number of CMBs between sequences; analysis was performed separately between T2* and TSWI, T2* and tSWI, and TSWI and tSWI. Intraclass correlation analysis was made on the interrater agreement for CMB detection on the different sequences. κ-weighted analysis was performed on the interrater agreement on WMH and is presented under “Image Analysis.” The limits for intraclass correlation and κ statistics were the following: 0.4–0.6, moderate agreement; 0.6–0.8, good agreement; >0.8, excellent agreement. All data were nonparametric; thus, for the univariate analysis of clinical data, χ2 was used for categoric values and Mann-Whitney U tests, for continuous values. Due to the number of patients with zero CMBs, negative binomial regressions were performed to analyze the association between clinical parameters and the number of CMBs. Univariate negative binomial regression analysis was performed with the number of CMBs as a dependent variable and the clinical parameters separately added to the model as independent variables. Subsequently, each regression model was adjusted for age and sex. The univariate comparisons and the regression analyses were performed, as decided a priori, on the median value of CMBs, by all 3 raters. General values given represent the median value on all separate ratings, from all 3 raters for all patients, unless otherwise specified. Likewise, for general values on the prevalence of CMBs, the median prevalence was chosen (ie, if ≥2 raters considered a CMB present/absent, that became the value representing the median of all raters). The whole cohort (n = 246) was included in all statistical analyses. SPSS 22.0 (IBM, Armonk, New York) was used for statistical analysis. All P values presented were post hoc Bonferroni-corrected, and P < .05 was set as the threshold of statistical significance.
Results
CMB Detection
The prevalence of CMBs for the whole cohort was 17% (n = 43) on T2*, 20% (n = 50) on TSWI, and 21% (n = 51) on tSWI (Table 1). tSWI (P = .02) led to a significant rise in CMB prevalence compared with T2*, but there was no significant difference between TSWI and T2* and TSWI and tSWI. Similarly, the increase in the number of CMBs detected was significant between T2* and TSWI (P < .001) and T2* and tSWI (P < .001), but not between TSWI and tSWI. All raters detected most CMBs on tSWI. Table 1 shows the CMB detection for the different sequences and raters.
CMBs for each sequence and ratera
The increase in CMB prevalence on TSWI and tSWI, compared with T2*, held true across the different dementia diagnoses (Table 2). There was no difference in prevalence between TSWI and tSWI. The number of CMBs detected increased with TSWI in Alzheimer disease (P = .006) and on tSWI in Alzheimer disease (P = .006) and mild cognitive impairment (P = .006), compared with T2*. There was no significant difference between TSWI and tSWI (Table 2). Table 2 shows the results of CMB detection in the different dementia diagnoses.
CMBs on T2*, TSWI, and tSWI in the separate dementia diagnosesa
Interrater Agreement and Reasons for Disagreement
Interrater agreement was excellent throughout all sequences and raters (Table 3). Analysis of multiple CMBs (defined as >1 CMB) still equaled excellent agreement across sequences and raters. The 20 patients without CMBs were classified as not having CMBs by all 3 raters on all sequences. Analyzing the agreement regarding the number of CMBs across all CMB sequences, for the median value of all raters, gave an intraclass correlation value of 0.897, which equals excellent agreement.
Interrater agreement for CMBs on T2*, TSWI, and tSWIa
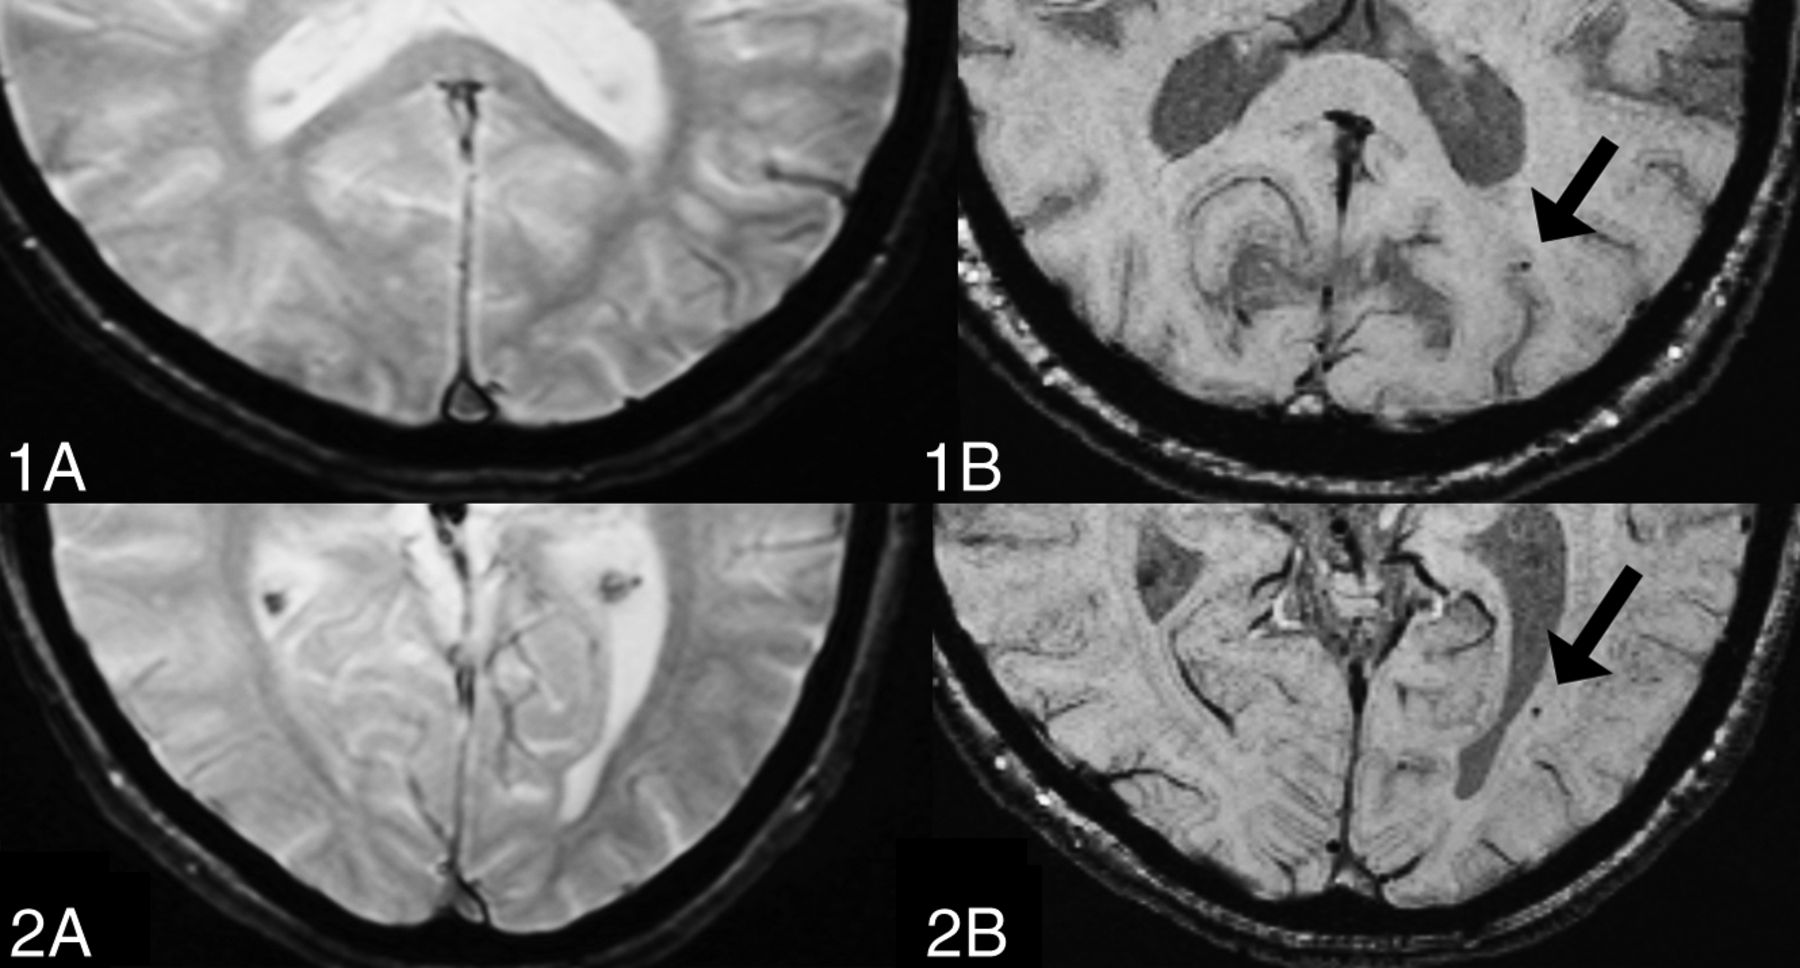
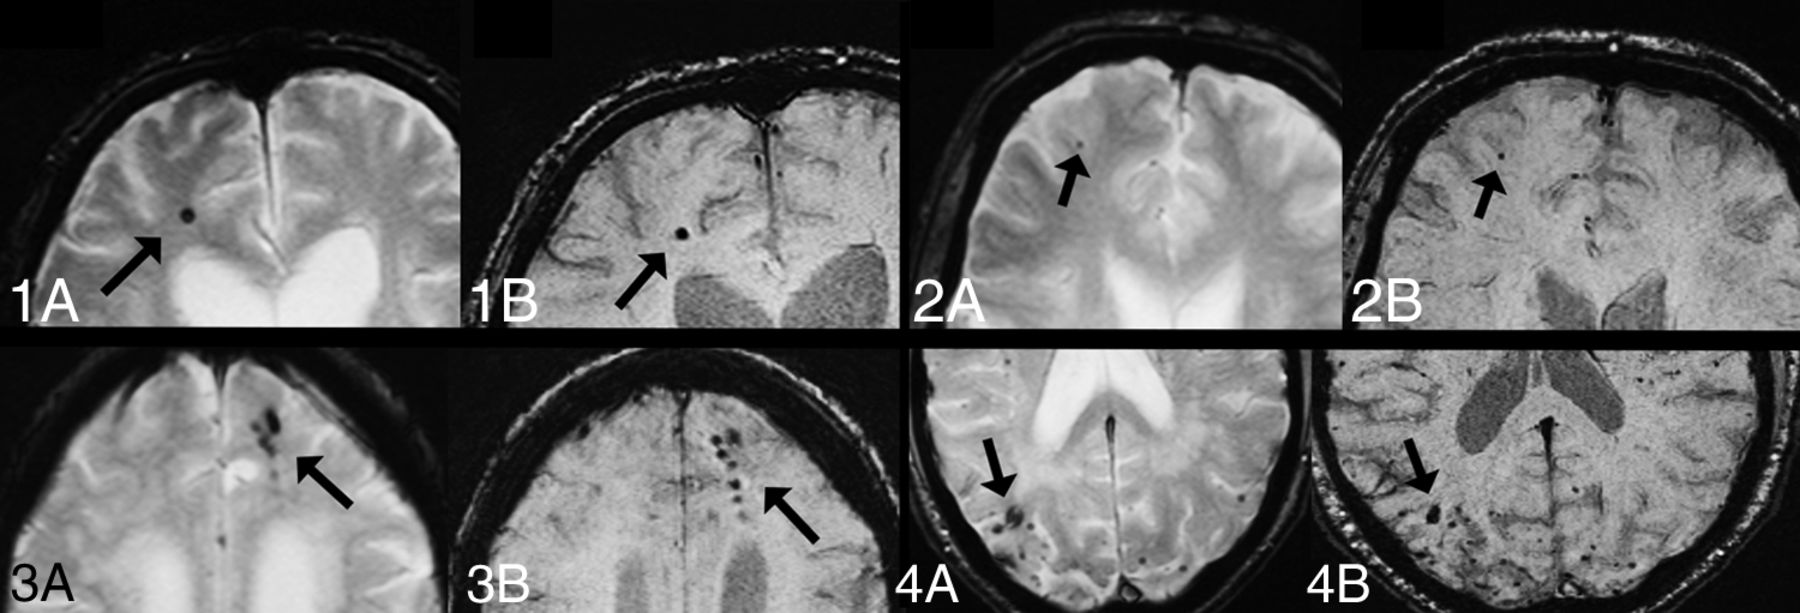
Throughout all ratings, 5 reasons for disagreement were identified. Multiple, pale, and small CMBs were the most frequent reason for disagreement. CMBs close to vessels and obvious CMBs not detected by 1 rater, explained as lack of attention, were other minor reasons for disagreement. Most disagreement was noted between T2* and TSWI/tSWI, with minor disagreement between TSWI and tSWI. Figure 1 includes CMBs present on tSWI but not on T2*. Figure 2 shows CMBs present on tSWI and T2* with accompanying disagreements.
CMBs on tSWI but not T2*. For all images: A, T2*. B, tSWI. 1, Only Rater 1 identified the CMBs on tSWI. 2, Raters 1 and 2 identified the CMBs on tSWI.

CMBs on both T2* and tSWI. For all images: A, T2*. B, tSWI. 1, All raters identified the single CMB on both T2* and tSWI. 2, The pale CMB on T2* was only identified by Rater 2. On tSWI, the CMB was clearly delineated and was identified by all raters. 3 and 4, Disagreement on the exact number of CMBs occurred on T2*. On tSWI, the CMBs are more clearly outlined.
Clinical Relevance
For univariate comparisons between patients with and without CMBs on T2*, tSWI, and TSWI, there was an association between CMBs and older age (T2*, P = .03; TSWI, P = .01) and higher WMH scores (≥1: T2*, P = .006; TSWI, P < .001; tSWI, P = .04) (≥2: T2*, TSWI, and tSWI, P < .0001) (3: T2*, TSWI, and tSWI, P < .0001) (Table 4).
Clinical parameters and association with CMBs depending on sequencea
Analyzing the number of CMBs and the relationship to clinical parameters in regression models for each of the MR imaging sequences showed that patients with a higher number of CMBs more often had Alzheimer disease, mild cognitive impairment, other dementias, higher age, male sex, higher alcohol consumption, hereditary dementia, and higher WMH scores. These associations were seen for T2*, TSWI, and tSWI (On-line Table). Patients who smoked and had anticoagulant therapy had fewer CMBs, as seen separately on T2*, tSWI, and TSWI (On-line Table). Further regression coefficients and analyses are shown in the On-line Table.
Discussion
SWI, both tSWI and TSWI, increased the prevalence and number of CMBs detected, compared with T2*. However, the difference between tSWI and TSWI was minor. Interrater agreement for all sequences was excellent. There were minor differences in clinical parameters among T2*, TSWI, and tSWI when only considering the presence of CMBs. Taking the number of CMBs in account showed further clinical associations with CMBs in the whole cohort and only minor differences between the sequences.
To the best of our knowledge, this is the first study on the impact of MR imaging sequences on CMB detection and accompanying clinical associations in dementia at 3T. Goos et al17 examined the effect of T2*, TSWI, and tSWI at 1.5T, showing a higher number and prevalence of CMBs detected on SWI and no difference in clinical associations among the sequences, after adjustment for age and sex. The higher prevalence and number of CMBs detected with SWI are in accordance with our results and suggest that the increase in CMB detection on SWI across 1.5T–3T is associated with the intrinsic processing of the SWI sequence. However, compared with Goos et al, we present more clinical associations with a high number of CMBs, even after adjustment for age and sex. This result may be due to our use of a higher field strength, further sharpening the diagnostic accuracy.
Previous studies investigating the impact of MR imaging sequences on CMB ratings, especially taking clinical parameters into account, are scarce. The prevalence of CMBs has been shown to be around 18% to 32% in Alzheimer disease, versus 3% to 11% in healthy aging populations.1 The number and prevalence of CMBs have been shown to increase on SWI compared with T2*.1 Regarding interrater agreement, Goos et al17 showed excellent interrater agreement for both T2* and SWI, which is in line with findings in our study, whereas Cheng et al14 showed better agreement for SWI. We also noted that our CMB ratings differed slightly between Raters 1/3 and 2. In contrast to Raters 1 and 3, Rater 2 detected fewer CMBs on TSWI than on tSWI. This finding may be due to the thinner section thickness of the tSWI, facilitating CMB detection.
We demonstrate that TSWI and tSWI both increase CMB detection, compared with T2*. tSWI leads to the largest increase in CMBs, possibly reflecting the impact of section thickness on CMB detection.15 The significant increase in CMB detection with both TSWI and tSWI is probably due to the innate properties of the SWI sequence. Furthermore, we show that TSWI and tSWI increase the prevalence/number of CMBs, with a minor impact on clinical associations, compared with T2*. This finding is of importance for future studies on CMBs and for the interpretation of studies regarding CMBs. Our results suggest that studies with T2* and/or SWI are comparable in clinical associations, implying that the exact number of CMBs may not be of major importance. However, further research is needed to outline the importance of the exact numbers of CMBs, especially in clinical routine neuroradiologic analysis, and until then, the most sensitive sequence in CMB detection, the SWI, is recommended. Patients with multiple CMBs have been shown to demonstrate lower levels of CSF amyloid β 42 levels compared with patients without CMBs; thus, differentiating patients with single and multiple CMBs with the SWI sequence may provide additional information on the CSF biomarker level of patients.20 The advantage of higher sensitivity may further contribute to increasing the power of studies, with possibly fewer subjects needed for analysis. Using SWI compared with T2* is of additional benefit due to its shorter acquisition time on our scanner, though the time difference when compared with T2* was minor.
In addition, we corroborate the known relationship between CMBs and small-vessel disease, by showing an increase in the number of CMBs with increased WMH. Most interesting, other further associations with CMBs, such as alcohol, smoking, and hereditary dementia, were discovered when considering the number of CMBs. This might imply the multifactorial existence of CMBs. The inverse relationship of a high number of CMBs with anticoagulants is surprising and warrants further research.
The strengths of our study include a large cohort, raters with variable neuroradiologic experience, and the use of rating scales for radiologic analyses, contributing to the generalizability of our results. In addition, we compared T2* and TSWI with the same section parameters, and tSWI; this comparison makes it possible to further disentangle the effects of sequence from that of section thickness. For additional clarification, T2* with thin-section thickness could have been used. The CMB rating was performed on the SWI and T2* sequences only, in accordance with other similar studies,14,17 and with the use of the Microbleed Anatomical Rating Scale.18 To minimize calcification mimics of CMBs, we excluded CMBs in the globus pallidus from the rating. However, the use of the phase or quantitative susceptibility maps would have provided additional information and could have helped in differentiating calcifications from CMBs.9,10
Conclusions
On the basis of the increased number of CMBs detected, we recommend SWI as the sequence of choice for CMB detection. The difference in CMB prevalence/numbers between T2* and SWI does, however, not affect the association with clinical parameters, suggesting that studies with T2* and SWI are comparable.
Acknowledgments
We would like to thank Helena Forssell and Karin Kjellsdotter for their administrative and technical assistance and Seyed-Mohammad Fereshtehnejad and Xiaozhen Li for their engagement in this project.
Indicates open access to non-subscribers at www.ajnr.org
References
- 1.
- 2.
- 3.
- 4.
- 5.
- 6.
- 7.
- 8.
- 9.
- 10.
- 11.
- 12.
- 13.
- 14.
- 15.
- 16.
- 17.
- 18.
- 19.
- 20.
- Received September 30, 2014.
- Accepted after revision December 16, 2014.
- © 2015 by American Journal of Neuroradiology