Abstract
BACKGROUND AND PURPOSE: Patients with aneurysmal SAH and good clinical status at admission are considered at a lower risk for delayed cerebral ischemia. Prolonged MTT may be associated with an increased risk. It is unclear whether this is dependent on clinical status. Our purpose was to determine whether increased MTT within 3 days of aneurysmal SAH compared with baseline is associated with a higher risk of delayed cerebral ischemia in patients with good (World Federation of Neurosurgical Societies I–III) versus poor (World Federation of Neurosurgical Societies IV–V) admission status.
MATERIALS AND METHODS: This prolonged MTT was a multicenter, prospective cohort investigation of 87 patients with aneurysmal SAH. MTT was measured at admission before aneurysm treatment (MTT1) and following repair (MTT2) within 3 days of admission; MTTdiff was calculated as the difference between MTT2 and MTT1. Changes in MTT across time were assessed with repeated measures analyses. Risk of delayed cerebral ischemia or death was determined with multivariate logistic regression analysis.
RESULTS: In patients with a good grade (n = 49), MTT was prolonged in patients who developed delayed cerebral ischemia, with MTTdiff significantly greater (0.82 ± 1.5) compared with those who did not develop delayed cerebral ischemia (−0.14 ± 0.98) (P = .03). Prolonged MTT was associated with a significantly higher risk of delayed cerebral ischemia or death (OR = 3.1; 95% CI, 1.3–7.4; P = .014) on multivariate analysis. In patients with poor grades (n = 38), MTTdiff was not greater in patients who developed delayed cerebral ischemia; MTT1 was significantly prolonged compared with patients with a good grade.
CONCLUSIONS: Patients in good clinical condition following aneurysmal SAH but with increasing MTT in the first few days after aneurysmal SAH are at high risk of delayed cerebral ischemia and warrant close clinical monitoring.
ABBREVIATIONS:
- aSAH
- aneurysmal SAH
- DCI
- delayed cerebral ischemia
- GCS
- Glasgow Coma Scale
- ICP
- intracranial pressure
- MTT1
- MTT before aneurysm treatment
- MTT2
- MTT after repair
- MTTdiff
- the difference between MTT before aneurysm treatment and after repair
- WFNS
- World Federation of Neurosurgical Societies
Identifying patients at high risk of delayed cerebral ischemia (DCI) after aneurysmal subarachnoid hemorrhage (aSAH) is important for guiding medical and endovascular management and could help improve disposition planning. Management algorithms are largely based on admission clinical status and the volume of SAH.1,2 The World Federation of Neurosurgical Societies (WFNS) has a commonly used scale to assess presentation clinical status.3 Higher WFNS grades (IV–V) are associated with a higher risk of DCI and death,3–4 while a good grade (WFNS I–III) at admission indicates lower risk.5
Early perfusion abnormalities before DCI symptoms could help identify patients at risk.6 Specifically, delayed MTT measured with CTP may be associated with higher risk.7 Absolute thresholds have been cited but depend on physiologic variability between individuals and technical aspects of acquisition and postprocessing.8 Hence, early changes in cerebral perfusion within individuals may be a more accurate marker.
The purpose of this study was to determine whether prolonged MTT within 3 days of aSAH is associated with a higher risk of DCI in patients with good (WFNS I–III) and poor (WFNS IV–V) clinical status on admission. Secondarily, we assessed the pattern of MTT changes before and after aneurysm treatment in patients with good and poor grades.
Materials and Methods
Study Population
This was a prospective multicenter cohort investigation of patients with aSAH between 2015 and 2017. Power analysis performed for logistic regression analysis with DCI as a binary response variable showed that 83 patients were required to achieve 80% power at .05 significance. Inclusion criteria were aSAH and age older than 18 years. Exclusion criteria were the following: no aneurysm, prior aneurysm treatment, poor scan quality, no baseline CTP, severe renal dysfunction, or contrast allergy. Consecutive patients presenting with aSAH at 2 institutions (St. Michael's Hospital and Sunnybrook Hospital, Toronto, Ontario, Canada) were screened. Institutional ethics approval and informed consent were obtained.
Clinical Data
Patient demographics, WFNS grade (good grade = I–III; poor grade = IV–V), Glasgow Coma Scale (GCS) score, hypertension, and smoking status were recorded at admission. The type of aneurysm treatment (clipping or coiling) was documented. Intracranial pressure (ICP) measurements were obtained at scanning when available.
DCI was defined according to a previously published consensus statement and considered present with new focal neurologic impairment or a decrease of at least 2 points in the GCS score not apparent immediately after aneurysm treatment and not attributed to other causes.9 Death within 2 weeks of admission was additionally noted. Timing of medical and endovascular treatment for DCI was reviewed to confirm occurrence after the onset of symptoms.
CT
Each patient had a noncontrast CT, CTA, and CTP on admission (before aneurysm treatment) and within 3 days of admission (after aneurysm treatment). Admission noncontrast CT images were assessed to determine the Modified Fisher Scale grade10 and for hydrocephalus and intraparenchymal hematoma. CTAs were assessed for angiographic vasospasm (the presence of large-artery vessel narrowing at baseline or on a subsequent study compared with baseline).
CTP was performed on either 256-slice or 64-slice scanners (Revolution or VCT; GE Healthcare, Milwaukee, Wisconsin) (256-slice: 14 cm of coverage with 80 kV; 75–150 Smart mA dose modulation; noise index, 8; rotation time, 1 second; and Adaptive Statistical Iterative Reconstruction (ASIR), 50%; 64-slice: shuttle mode, 16 × 5 mm slices [8 cm of coverage] with 80 kV and 100 milliampere second (mAs)).
CTP cine images were analyzed on CT Perfusion 5 (Prototype of CTP 4D; GE Healthcare) by research assistants with expertise in CTP analysis blinded to clinical data. Arterial input ROIs were chosen to maximize the slope of the arterial time-density curve, usually the anterior cerebral artery or MCA. Venous ROIs were placed on the superior sagittal sinus to maximize the area under the venous time-density curve.11 CTP functional maps for each slice, including MTT, CBF, and an average map (average of all the cine images of the same slice), were generated.
Slices with extensive coil artifacts were excluded. ROIs were drawn to define the anterior cerebral artery, MCA, and posterior cerebral artery vascular territories and the basal ganglia and thalamus on each slice, avoiding hematomas and External ventricular drain (EVD) tracts (Fig 1). Segmentation of gray and white matter was achieved using a threshold range of Hounsfield units. Blood flow and blood volume thresholding was performed to exclude vascular structures by eliminating pixels with blood flow of >100 mL/min/100 g and blood volume of >8 mL/100 g from the segmented gray and white matter masks.12 The ROIs were automatically propagated to MTT maps, and MTT was calculated as the weighted average of the gray matter volume from all ROIs on all slices. MTT on the CTP performed at admission before aneurysm treatment was MTT1, and at 3 days after treatment, it was MTT2.

Example of cortical vascular territory ROIs drawn on the average map before gray-white matter segmentation.
Statistical Analysis
Characteristics of the study population were compared using an independent t test for continuous variables or χ2 analysis for categoric variables.
To study the interaction between MTT changes associated with DCI and clinical grade, we dichotomized patients into 2 groups (good grade, WFNS I–III; and poor grade, WFNS IV–V) at presentation. Repeated measures linear regression analysis was performed to assess differences between MTT1 and MTT2 and the interaction between temporal changes in MTT and grade. Post hoc analysis was performed with paired t tests for patients with good and poor grades. The difference between MTT before aneurysm treatment and after repair (MTTdiff) was calculated. Differences between groups were assessed with independent t test analysis.
Logistic regression analysis was used to assess predictors of DCI or death. First, univariate analysis was used to identify significant clinical predictors. Multivariate analysis was then performed to assess the risk of DCI or death associated with MTTdiff for patients with good and poor grades, in combination with clinical factors identified as significant on independent univariate analysis. Receiver operating characteristic curve analysis with calculation of the Youden Index was performed to determine optimal thresholds of MTT1, MTT2, and MTTdiff. Statistical analysis was performed with the SPSS statistics package, Version 24 (IBM, Armonk, New York). Results were considered significant at P < .05.
Results
Characteristics of Study
Eighty-seven patients were included. One hundred two were screened, and 15 were excluded for the following indications: no baseline CTP (n = 6), rebleed of previously coiled aneurysm (n= 2), nonaneurysmal SAH (n = 5), CTP of insufficient quality (n = 1), and no SAH on baseline (n = 1) (Table 1).
Characteristics of the study population
Forty-nine of 87 (56%) had good grades on admission, and 38/87 (44%) had poor grades. Patients with poor grades had lower GCS scores, higher Modified Fisher Scale scores, higher ICP, and higher incidences of intraparenchymal hematoma, hydrocephalus, and untreated aneurysm. Death within 2 weeks occurred in 12 patients, all of whom had poor grades. While the rate of DCI was similar between patients with good and poor grades, patients with poor grades had significantly higher rates of death and DCI when considered together.
Temporal Trends in MTT
There was a significant interaction between MTT and clinical grade (P = .009), indicating that changes between MTT1 and MTT2 are different for patients with poor and good grades. MTT1 was significantly higher in patients with a poor grade compared with patients with a good grade with and without DCI or death (P < .05). There was no difference in MTT2 (Table 2 and Figs 2 and 3).
Mean MTT values

Average MTT values in patients with good (A) and poor (B) grades with and without DCI. Note that the displayed y-axis MTT has been truncated (4–8 seconds in A and 5–7.5 seconds in B) to physiologic ranges to allow better visualization of the trends. Error bars represent the SDs (reflecting interindividual variation in MTT).

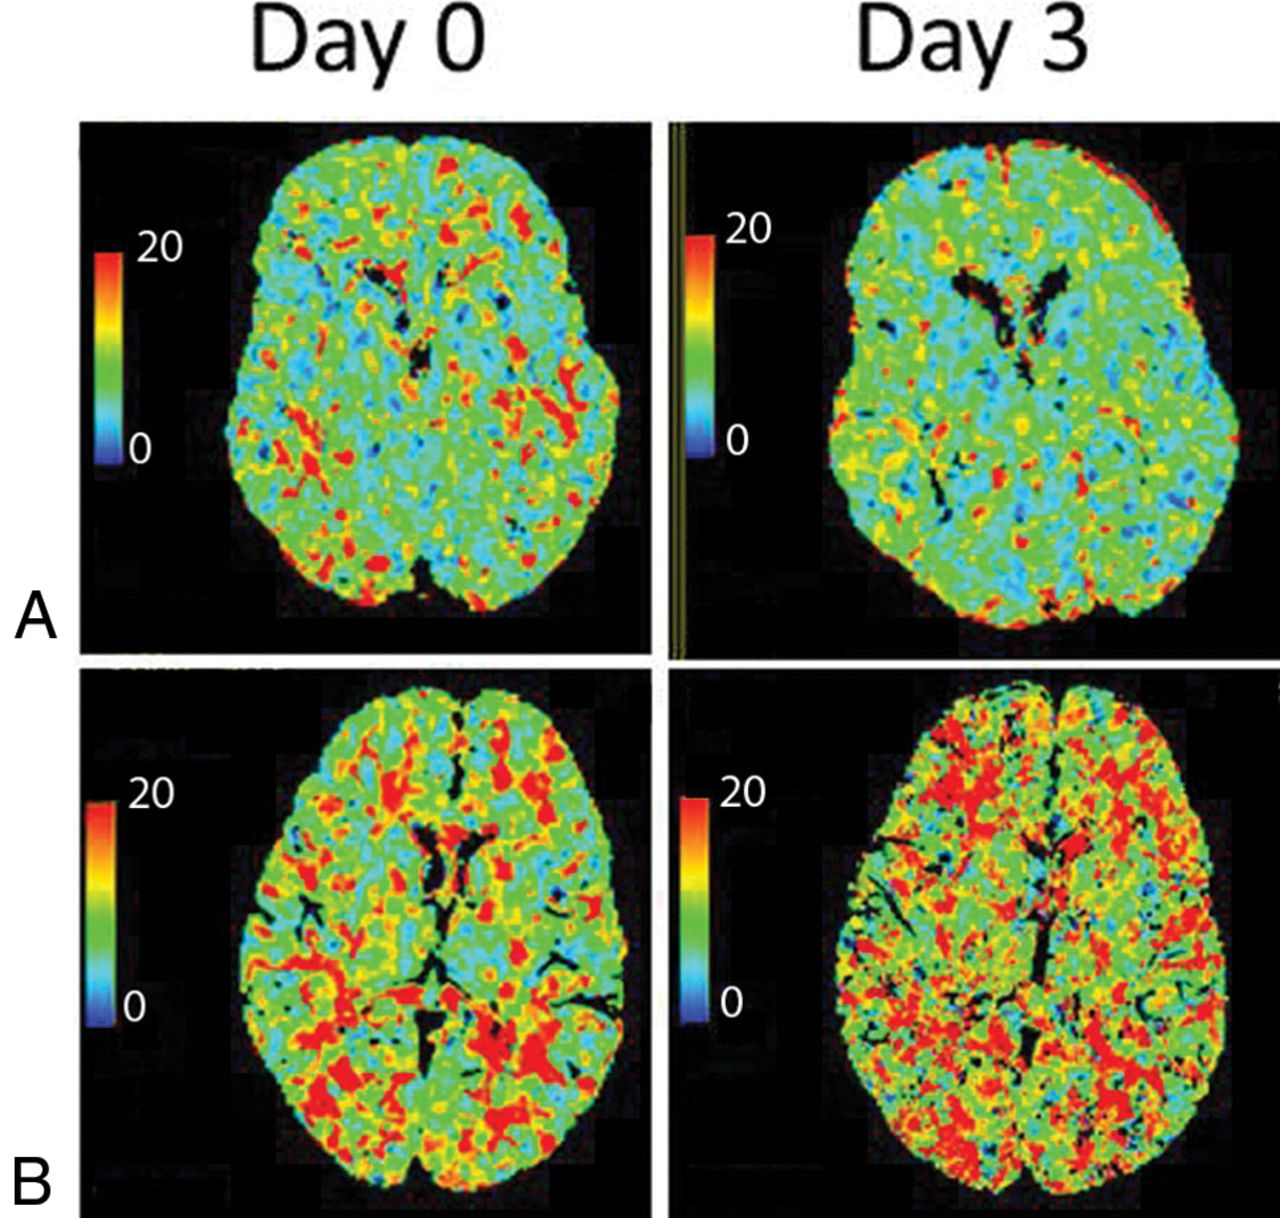
Representative MTT maps at days 0 and 3. A, Patient with good grade (WFNS I) who did not develop DCI. MTT on day 0 = 6.8 second; MTT on day 3 = 6.8 second. B, Patient with good grade (WFNS I) who developed DCI on day 5. MTT on day 0 = 7.4 second; MTT on day 3 = 10.2 second.
In patients with a good grade, different trends were observed between MTT1 and MTT2 in patients with and without DCI (P = .03) (Table 2). The mean difference between MTT2 and MTT1 was positive in patients who developed DCI (0.82 ± 1.6), indicating increasing (worsening) MTT in the first few days after aSAH. This difference was significantly greater than the MTTdiff in patients without DCI (−0.14 ± 0.98, P = .03), which showed an average decrease (improvement) in MTT.
In patients with a poor grade, similar trends were observed between MTT1 and MTT2 in patients with and without DCI (P = .969). MTT significantly decreased between MTT1 and MTT2 in patients who developed DCI or death and those who did not (MTT1, 8.3 ± 3.0 seconds, versus MTT2, 6.0 ± 0.8 seconds; P = .03). In pooled analysis combining patients with good and poor grades, we did not find a statistically significant trend in the change in MTT between patients who did or did not develop DCI.
Univariate Analysis: Predictors of DCI or Death
Univariate analysis showed that WFNS, ICP, GCS, and intraparenchymal hematoma were significant predictors of DCI or death (Table 3). In patients with a good grade, MTTdiff was associated with a higher risk of DCI (OR = 2.1; 95% CI, 1.0–4.1; P = .04). Patients with poor grades had no significantly increased risk of DCI or death with increasing MTT (OR = 0.99; 95% CI, 0.6–1.6; P = .97).
Univariate analysis
Multivariate Analysis: Predictors of DCI or Death
Increasing MTT between MTT1 and MTT2 (higher MTTdiff), intraparenchymal hematoma, and higher WFNS scores remained significant predictors of DCI or death on multivariate analysis (Table 4). Subgroup analysis of patients with good and poor grades showed that higher MTTdiff (worsening MTT between MTT1 and MTT2) was significantly associated with an increased risk of DCI in patients with a good grade (OR = 3.1; 95% CI, 1.3–7.4; P = .014).
Multivariate analysis
MTT Thresholds
In patients with a poor grade, there was a higher baseline MTT threshold (MTT1, >9.6 seconds) compared with patients with a good grade (MTT1, >6.5 seconds), whereas the MTT2 thresholds are similar regardless of clinical grade. MTTdiff thresholds also differed depending on the clinical grade, with patients with a good grade showing a positive threshold (MTTdiff, >0.2) and patients with a poor grade showing a negative threshold (MTTdiff, more than −0.33) (Table 5).
Optimal MTT thresholds and sensitivity and specificity (determined by the Youden Index) for DCI/deatha
Discussion
In this study, we showed that increasing (worsening) MTT in the first few days after aSAH was associated with an increased risk of DCI or death in patients with a good grade. Roughly every 1-second increase in global MTT was associated with a 3× greater risk of DCI in patients with a good clinical status, and this risk remained significant on multivariate analysis. In contrast, patients with a poor grade (WFNS IV–V) tended to show decreasing (improving) MTT in the first few days after aSAH in those with and without subsequent DCI or death.
Some management algorithms rely on clinical status for triaging patients to high or low risk for DCI and poor outcome.2,13 Patients in good clinical condition may undergo less frequent neurologic monitoring and may be transferred out of intensive care units earlier.1 Consensus statements have identified CTP as a potential screening tool, though specific recommendations for its integration are lacking.14,15 Our data support the use of CTP in the first few days after aSAH before the typical onset of DCI, to identify patients who, despite good clinical status, remain at an elevated risk of DCI. Multivariate analysis showed that increasing MTT remained a significant risk factor for DCI in patients with a good grade.
MTT changes that we observed occurred before DCI symptoms. This “therapeutic window” could allow optimization of therapy in high-risk patients. Effective options for the prevention of DCI are currently limited to nimodipine and maintenance of euvolemia.16 Once DCI has been established, hypertensive therapy is considered first-line treatment in many centers, though there is a lack of evidence showing clinical benefit.16⇓–18 Targeted application of therapies in individuals at higher risk might improve the clinical efficacy, though currently evidence is lacking. In addition, new prophylactic treatment studies might incorporate MTTdiff as a biomarker for imaging selection or for monitoring treatment efficacy.13,19,20
While MTT on admission was significantly higher in patients with a poor-versus-good grade, it was not a significant predictor of DCI or death in either univariate or multivariate models. This finding may reflect the limitations of a single-measurement MTT,22 compared with temporal changes of MTT in an individual. Technical differences may also have an impact.22 In our study, CTP data were acquired at 2 different tertiary care centers with different CT scanners, though all postprocessing was performed at the same core laboratory with standardized methodology.
We chose to analyze MTT because it has been previously shown to be a sensitive perfusion parameter for prediction and detection of DCI,23⇓–25 and it takes into account fluctuations in both CBF and CBV (MTT = CBV / CBF as per the central volume principle). Prolonged MTT may be reflective of vasospasm in both proximal vessels surrounding the circle of Willis (angiographic vasospasm) or distal parenchymal arterioles (microcirculation). Autoregulatory disturbances likely have a role in the development of DCI (or are precursors to DCI) and may occur independent of large-artery vasospasm.26 In this cohort, very few patients showed angiographic vasospasm at MTT1 or MTT2; the incidence was similar between patients with good and poor grades and unlikely to be a significant cause of early MTT elevation (Table 1).
Elevations in MTT during the first few days after aSAH potentially reflect an element of early brain injury, a global brain injury that occurs in the first few days following aSAH and may be associated with DCI. The underlying etiology of early brain injury may involve inadequate physiologic compensation for acute ICP elevations from aneurysm rupture, with cellular injury, edema, blood-brain barrier disruption, and microvascular disturbances.27,28 Clinical manifestations may not be clear on early physical examination until abrupt changes in neurologic status are manifested as DCI. We showed a significant interaction between clinical grade and MTT, indicating that MTT changes are different between patients with good and poor grades. While MTT generally worsened in patients with a good grade who subsequently went on to DCI, it improved in patients with a poor grade with DCI. This seemingly paradoxical result might be accounted for by the effects of early brain injury or the effects of untreated ICP/hydrocephalus, both of which could result in prolonged MTT1.29 In our cohort, EVDs were present in 60% of patients with a poor grade at MTT1, and an additional 8 patients (21%) had interval EVD insertion before MTT2. In both groups, we observed improving MTT between MTT1 and MTT2, suggesting that corrected hydrocephalus is not the only explanation for MTT improvement in these patients.
In patients with a poor grade, high MTT at admission of >9.6 seconds (as determined by the Youden Index threshold analysis; Table 5) portends increased risk of subsequent DCI or death. Elevated ICP can lead to delayed MTT. As ICP normalizes (for example, following CSF diversion), MTT decreases as cerebral perfusion improves; this change could lead to improvement or reperfusion injury that exacerbates early brain injury.
With respect to early within-individual changes in MTT, there are other limited published data. In a study by Rogriguez-Régent et al,30 CTP between day 0 and day 4 was analyzed in 47 patients with aSAH. Early deterioration in perfusion parameters was significantly correlated with an increased risk of delayed infarct burden on CT/MR imaging. However, their study focused on imaging outcome, whereas ours focused on clinical deterioration of DCI. Because therapeutic maneuvers may prevent patients with DCI from developing infarction, we think that our study provides important evidence about the relationship of early deterioration in MTT to the development of clinical DCI, which is the current target for clinical intervention. Our study also included a larger cohort of patients and explored the influence of clinical grade on early perfusion changes.
Limitations include a relatively low percentage of DCI in this cohort compared with the literature, which, in the context of the sample size, could influence the power of the results. In addition, the clinical teams were not blinded to the results of CTA/CTP; however, they did not have access to quantitative CTP data, only qualitative color maps. This is mitigated by the fact that this study included strict clinical definitions of DCI, which were not influenced by imaging results. There was a relatively high rate of patients with poor grades in this study, likely due to the prospective study design in which patients with poor presentation of clinical status were not excluded. Clinical detection of DCI in patients with poor grades is challenging, and this issue could introduce errors in the diagnosis of DCI in these patients. We chose to include death in combination with DCI in patients with a poor grade because this is a measurable outcome in patients with a comatose or nearly comatose state, but this could also introduce error. Finally, CT perfusion includes iodinated contrast (risks for renal injury and allergic reaction) and ionizing radiation (risk of radiation injury and induced cancer); however, these risks are low using optimal imaging protocols.
Conclusions
In patients with a good grade (WFNS I–III), increased MTT in the early period after SAH (around day 3) compared with a baseline study performed at presentation is associated with a significantly higher risk of subsequent development of DCI. Patients with a poor grade (WFNS IV–V) did not show an increased risk of DCI with increasing MTT. Early changes in MTT may be a useful imaging biomarker for the risk of DCI in patients with a good grade.
Acknowledgments
The authors thank the following individuals for their contributions to this investigation: Kyle Burgers, Elton Law, Feng Su, Marjorie Ho, Rita Vittorino, Vy Nguyen, Yang-mei Li, Pascal Tyrrell, Kuan Liu, and Yaeesh Randeree.
Footnotes
Disclosures: Amanda Murphy—RELATED: Grant: RSNA Research Fellow Grant.* Ting-Yim Lee—UNRELATED: Grants/Grants Pending: GE Healthcare, Comments: research study on dual-energy CT scanning of metal objects in the extremities*; Royalties: GE Healthcare, Comments: for the CT perfusion license agreement*. Thomas R. Marotta—UNRELATED: Consultancy: Medtronic, Comments: proctor for the Pipeline Embolization Device; Patents (Planned, Pending or Issued): eCLIPS; Stock/Stock Options: Evasc. Robert L. Macdonald—UNRELATED: Board Membership: Brain Aneurysm Foundation, Canadian Institutes of Health Research; Employment: Edge Therapeutics; Stock/Stock Options: Edge Therapeutics. Richard I. Aviv—RELATED: Grant: Sunnybrook Alternate Funding Plan. Comments: grant is for 46,000, grant was peer reviewed.* Aditya Bharatha—RELATED: Grant: Ontario Alternate Funding Plan Innovation Grant.* *No money paid to the institution.
A.M. was supported by an RSNA Research Fellow Grant. Portions of this work were supported by the Innovation Fund of the Alternative Funding Plan for the Academic Health Sciences Centres of Ontario (St. Michael's Hospital, Sunnybrook Hospital) to A. Bharatha and R.I.A.
References
- 1.
- 2.
- 3.
- 4.
- 5.
- 6.
- 7.
- 8.
- 9.
- 10.
- 11.
- 12.
- 13.
- 14.
- 15.
- 16.
- 17.
- 18.
- 19.
- 20.
- 21.
- 22.
- 23.
- 24.
- 25.
- 26.
- 27.
- 28.
- 29.
- 30.
- Received March 25, 2018.
- Accepted after revision July 26, 2018.
- © 2018 by American Journal of Neuroradiology