
Abstract
BACKGROUND AND PURPOSE: Intravoxel incoherent motion imaging, which simultaneously measures diffusion and perfusion parameters, is promising for brain tumor grading. However, intravoxel incoherent motion imaging has not been tested in children. The purpose of this study was to evaluate the correlation between intravoxel incoherent motion parameters and histology to assess the accuracy of intravoxel incoherent motion imaging for pediatric intracranial tumor grading.
MATERIALS AND METHODS: Between April 2013 and September 2015, 17 children (11 boys, 6 girls; 2 months to 15 years of age) with intracranial tumors were included in this retrospective study. Intravoxel incoherent motion parameters were fitted using 13 b-values for a biexponential model. The perfusion-free diffusion coefficient, pseudodiffusion coefficient, and perfusion fraction were measured in high- and low-grade tumors. These intravoxel incoherent motion parameters and the ADC were compared using the unpaired t test. The correlations between the intravoxel incoherent motion parameters and microvessel density or the MIB-1 index were analyzed using the Spearman correlation test. Receiver operating characteristic analysis was used to evaluate diagnostic performance.
RESULTS: The perfusion-free diffusion coefficient and ADC were lower in high-grade than in low-grade tumors (perfusion-free diffusion coefficient, 0.85 ± 0.40 versus 1.53 ± 0.21 × 10⁻³ mm2/s, P < .001; ADC, 1.04 ± 0.33 versus 1.60 ± 0.21 × 10⁻³ mm2/s, P < .001). The pseudodiffusion coefficient showed no difference between the groups. The perfusion fraction was higher in high-grade than in low-grade tumors (21.7 ± 8.2% versus 7.6 ± 4.3%, P < .001). Receiver operating characteristic analysis found that the combined perfusion-free diffusion coefficient and perfusion fraction had the best diagnostic performance for tumor differentiation (area under the curve = 0.986).
CONCLUSIONS: Intravoxel incoherent motion imaging reflects tumor histology and may be a helpful, noninvasive method for pediatric intracranial tumor grading.
ABBREVIATIONS:
- D
- perfusion-free diffusion coefficient
- D*
- pseudodiffusion coefficient
- f
- perfusion fraction
- IVIM
- intravoxel incoherent motion
- MVD
- microvessel density
- ROC
- receiver operating characteristic
- WHO
- World Health Organization
Brain tumors are the second most common tumors in the pediatric population.1 Each year, approximately 2500 children are diagnosed with brain tumors in the United States.2 Pediatric brain tumors are different from those of adults, with specific infantile subtypes and pathologic features that are widely heterogeneous.1 Accurate preoperative diagnosis is beneficial for determining the appropriate therapeutic strategy; however, this remains challenging because of tumor variability and heterogeneity.
MR imaging plays an important role in the accurate diagnosis of brain tumors. Many attempts have been made to identify biomarkers on DWI3,4 and PWI5,6 that can be used to grade pediatric brain tumors and those found in adults.7,8 In clinical practice, the ADC is usually calculated using 2 b-values (0 and 1000 s/mm2) and serves as a useful biomarker, reflecting cellular density.4,9 Similar to the ADC, CBV and CBF are also useful biomarkers.5,6,10 Measuring DSC-derived CBV requires an intravenous gadolinium-based contrast agent. Thus, this method can be difficult to implement in children.5 DSC imaging often requires high-flow contrast injection by power injectors requiring large-bore intravenous access, which presents challenges in young children and infants.5 In contrast, measuring CBF with arterial spin-labeling does not require a contrast agent; this feature is beneficial for children.5,6
In 1988, Le Bihan et al11 reported on an imaging technique depicting the molecular motion of water in tissue and used for distinguishing diffusion and perfusion components on the basis of the intravoxel incoherent motion (IVIM) model. The ADC contaminates contributions from capillary microcirculation because it cannot inherently separate the coherent motion of microperfusion with small b-values.11 Therefore, the ADC is influenced by perfusion and could be overestimated, especially in hypervascular tumors. IVIM imaging fits the signal decay to a biexponential function using multiple b-values and then discriminates perfusion-free diffusion from capillary perfusion, allowing the simultaneous evaluation of diffusion and perfusion parameters. Furthermore, the perfusion-free diffusion coefficient (D) can reveal the state of diffusion more accurately than the ADC because it is based on a model that does not rely on the influence of perfusion. IVIM imaging has been used to evaluate malignant tumors in adults (eg, glioma or head, neck, rectal, or breast cancers),12⇓⇓–15 and the IVIM perfusion parameter correlates with tumor histology in animals.16,17 However, to date, few studies have evaluated IVIM imaging in children. The purpose of this study was to evaluate the correlation between IVIM parameters and histology to assess the accuracy of IVIM imaging for pediatric intracranial tumor grading.
Materials and Methods
This retrospective study was approved by our institutional review board, and the informed consent requirement was waived.
Patients
The inclusion criteria for this study are outlined in On-line Fig 1. Twenty-one consecutive pediatric patients with intracranial tumors who underwent IVIM imaging examinations between April 2013 and September 2015 were identified. On the basis of the exclusion criteria (On-line Fig 1), 1 patient with an inadequate histologic specimen and 3 patients with non-neuroectodermal tumors were excluded. Therefore, data from 17 patients (11 boys, 6 girls; median age, 4 years; range, 2 months to 15 years) with 7 high-grade (World Health Organization [WHO] grades III and IV; 5 boys, 2 girls; median age, 4 years; range, 2–11 years) and 10 low-grade (WHO grades I and II; 6 boys, 4 girls; median age, 4.5 years; range, 2 months to 15 years) tumors were available for analysis.
Histopathologic Diagnosis
Patient demographics and pathologic diagnoses based on the 2016 WHO classification18 are shown in Table 1.
Patient demographics and tumor characteristics
IVIM MR Imaging
IVIM imaging was performed as previously described12,19 using a 3T MR imaging scanner (Achieva 3T TX; Philips Healthcare, Best, the Netherlands) with an 8-channel head coil. The IVIM scans were obtained in the axial plane using a 2D single-shot spin-echo EPI diffusion sequence. We used 13 b-values (0, 10, 20, 30, 50, 80, 100, 200, 300, 400, 600, 800, and 1000 s/mm2) in 3 orthogonal directions. The other IVIM imaging parameters were as follows: TR/TE, 2500/82 ms; matrix, 128 × 126 (reconstructed to 256 × 256); NEX, 1; section thickness/gap, 5/1 mm; FOV, 230 × 230 mm; number of sections, 11; sensitivity encoding factor, 1.5; and total scan time, 2 minutes 10 seconds. IVIM imaging was acquired before contrast agent injection. Several standard MR images (T1WI, T2WI, FLAIR, and contrast-enhanced T1WI) were also obtained for diagnostic purposes.
Image Analysis
The IVIM parameters from each map with 13 b-values were generated using a commercially available workstation (SYNAPSE VINCENT; Fujifilm Medical, Tokyo, Japan).20 For IVIM data analysis, the biexponential model was defined by the following equation:
 where SI0 corresponds to the signal intensity without diffusion weighting (b = 0 s/mm2) and SIb is the SI acquired with different b-values. First, the D was determined from data with higher b-values (b = 300, 400, 600, 800, and 1000 s/mm2). When high b-values were used and the IVIM component was negligible, we used the following least-squares curve fit:
 Second, the segmented method was used to calculate perfusion fraction (f) according to the following equation:
 Here, SIinter is the intersection point of the y-axis and a line through loge SI300 and loge SI1000. Third, the pseudodiffusion coefficient (D*) was derived from the monoexponential fit to Equation (1). The ADC was also calculated with b-values of 0 and 1000 s/mm2 using the following equation:
 Two board-certified neuroradiologists (K.K. and D.M., with 13 and 7 years of experience, respectively) evaluated each tumor using nonoverlapping ROIs (area, >10 mm2). Three or more circular ROIs were placed on each tumor map. When placing the ROIs, we carefully avoided areas containing necrosis, hemorrhage, calcification, or blood vessels by referring to other sequences. The average ROI values were used as representative values for each parameter. D-map ROIs were copied to the corresponding ADC maps for comparison. Similarly, f-map ROIs were copied to the corresponding D* maps.
Histopathologic Evaluation
Histologic microvessel density (MVD) was evaluated as previously described.6 Briefly, tissue sections were immunostained with anti-CD31 (Dako Japan, Tokyo, Japan). Stained vessels were viewed under a microscope using a ×20 objective field. The MVD was calculated using the following equation:
 Three different fields were evaluated, and a mean representative value was calculated.
MIB-1 is a monoclonal antibody to the Ki-67 antigen, which is expressed in proliferating and dividing cells during all active phases of the cell cycle (ie, G1, S, G2, and M phases), but not during the G0 phase.21 The MIB-1 index is a marker of cell proliferation.22 All specimens were evaluated by the Department of Neuropathology using this index.
Statistical Analysis
We assessed the distribution of the data using the Shapiro-Wilk test. Each IVIM parameter (ie, D, D*, and f) and the ADC, MVD, and MIB-1 index were compared between high- and low-grade tumors using the unpaired t test. The D and ADC values were also compared within the high- and low-grade tumor groups by a paired t test. The Mann-Whitney U test was used when these data deviated from a normal distribution.
The relationships between the MIB-1 proliferation index and diffusion parameters (ie, D and ADC) were evaluated by the Pearson correlation test, and those between the MVD and IVIM perfusion parameters (ie, D* and f) were evaluated by the Spearman correlation test.
The diagnostic performances of each IVIM parameter and the ADC were evaluated by receiver operating characteristic (ROC) curve analysis.
All the statistical analyses were performed using commercial software programs (JMP, Version 11.0.0; SAS Institute, Cary, North Carolina; GraphPad Prism 7.0, GraphPad Software, San Diego, California; MedCalc for Windows, Version 15.10.0, MedCalc Software, Mariakerke, Belgium). A P value < .05 was considered statistically significant.
Results
Differentiation of High- and Low-Grade Tumors Using IVIM Parameters
Figure 1 and Table 2 summarize the parameter measurements for pediatric intracranial neuroectodermal tumor grading. The D and ADC were lower in high-grade than in low-grade tumors (D, 0.85 ± 0.40 versus 1.53 ± 0.21 × 10⁻³ mm2/s, P = .0003; ADC, 1.04 ± 0.33 versus 1.60 ± 0.21 × 10⁻³ mm2/s, P = .0007; Fig 1A and Table 2). The D* showed wide variability and no significant differences between tumor grades (P = .8337; Fig 1B and Table 2). The f was higher in high-grade than in low-grade tumors (21.7 ± 8.2% versus 7.6 ± 4.3%, P = .0003; Fig 1C and Table 2).
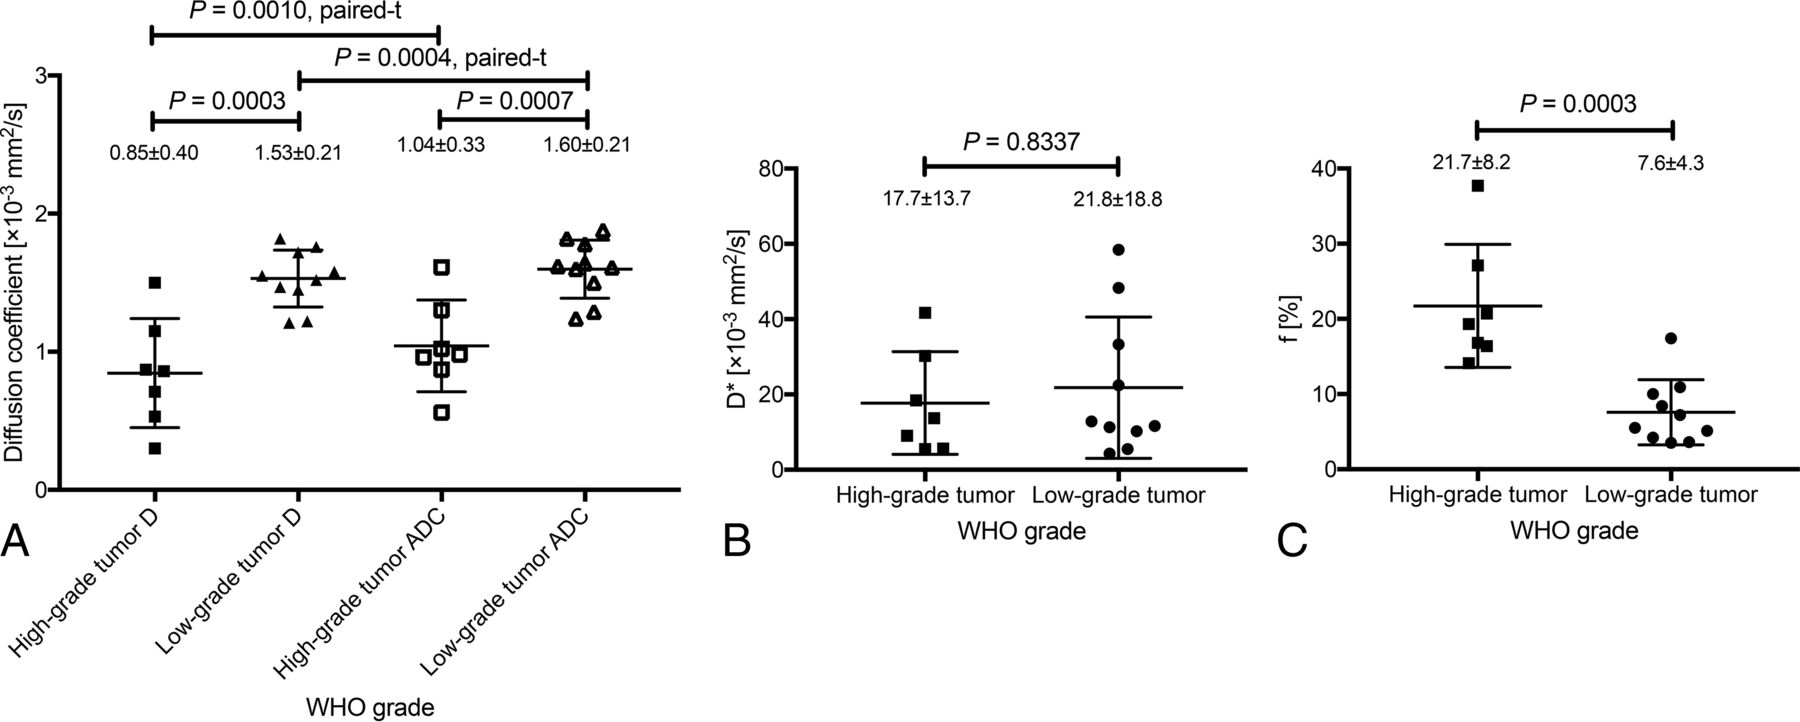
Comparison of the IVIM parameters of high- (WHO grades III and IV) and low-grade (WHO grades I and II) tumors. D and ADC were lower in high-grade than in low-grade tumors (D, 0.85 ± 0.40 versus 1.53 ± 0.21 × 10⁻³ mm2/s, P = .0003; ADC, 1.04 ± 0.33 versus 1.60 ± 0.21 × 10⁻³ mm2/s, P = .0007; A). D was significantly lower than the ADC in high- (P = .0010) and low-grade (P = .0004; A) tumors. D* showed wide variability and no significant differences between the high- and low-grade groups (P = .8337; B). The f was higher in high- than in low-grade tumors (21.7 ± 8.2% versus 7.6 ± 4.3%, P = .0003; C).
Comparison of parameters between high- and low-grade tumorsa
Comparison of the D and ADC Values
The D was significantly lower than the ADC in high- (P = .0010) and low-grade (P = .0004; Fig 1A) tumors. The percentage difference between the D and ADC was 23.3% ± 22.0% in the high-grade tumors and 4.4% ± 18.9% in the low-grade tumors.
Relationship between the IVIM Parameters and MVD
On-line Figure 2 shows the relationship between each IVIM parameter and histology. There were strongly negative correlations between the MIB-1 proliferation index and D (r = −0.577, P = .0154; On-line Fig 2A) and ADC (r = −0.517, P = .0334; On-line Fig 2B). Notably, the correlation value of the D was higher than that of the ADC (−0.577 versus −0.517; On-line Fig 2A, -B). There was a strongly positive correlation between the f and MVD (ρ = 0.832, P < .0001; On-line l Fig 2D). There was no significant correlation between the D* and MVD (ρ = –0.088, P = .7380; On-line Fig 2C).
ROC Analysis of Each IVIM Parameter for Grading Pediatric Intracranial Tumors
Table 3 and On-line Fig 3 show the ROC analysis results for the diagnostic performance of each IVIM parameter in differentiating high- and low-grade tumors. The combined D and f showed the best diagnostic performance (area under the curve = 0.986). The D, ADC, and f also showed robust diagnostic performance (area under the curve = 0.943, 0.907, and 0.957, respectively). The D* showed low diagnostic performance (area under the curve = 0.536). The optimal diagnosis cutoff values for discriminating high- and low-grade tumors were ≤1.50 and >16.4 for the combined D and f, respectively (≤1.15 for the D, ≤1.02 for the ADC, and >14.1 for the f).
Diagnostic performance of parameters in differentiating high- and low-grade tumors
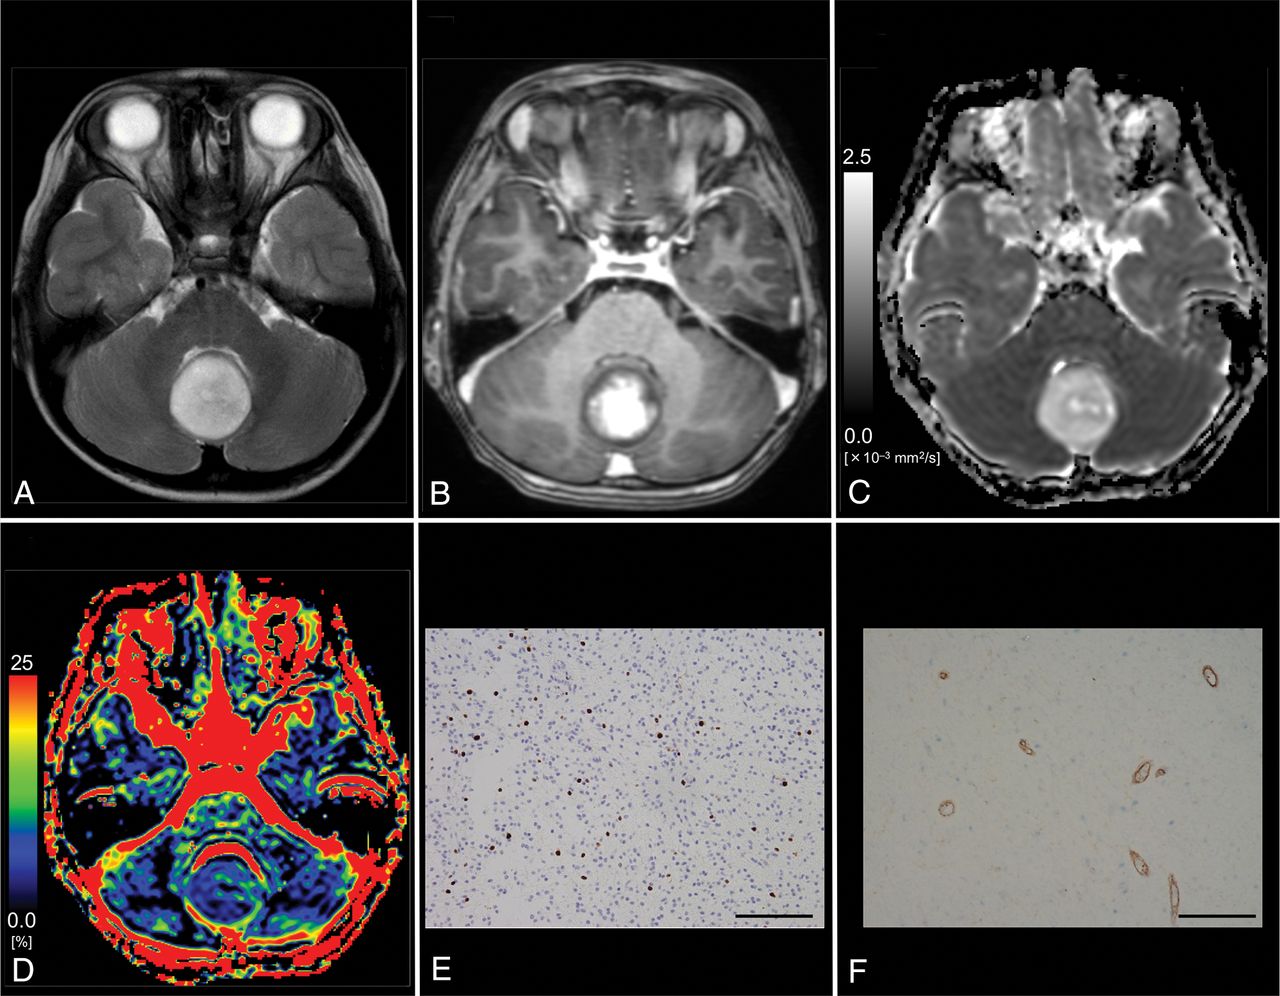
Figures 2 and 3 show representative patients with grades IV (medulloblastoma) and I (pilocytic astrocytoma) tumors, respectively.

Images from an 11-year-old boy with histologically defined classic medulloblastoma (WHO grade IV). A, T2WI shows a heterogeneous, hyperintense mass in the vermis. B, Contrast-enhanced T1WI shows heterogeneous enhancement of the tumor. C, The D map shows the low D value (0.53 × 10⁻³ mm2/s) of the lesion, which is lower than the cutoff value (≤1.15 × 10⁻³ mm2/s; Table 3). D, The f map shows the f value (27.1%) of the lesion, which is higher than the cutoff value (>14.1%; Table 3). E, MIB-1 staining reveals a high MIB-1 index (72.6%). F, Immunohistochemical staining for anti-CD31 shows a high MVD (10.2%). Bar = 100 μm.
Images from a 6-year-old boy with pilocytic astrocytoma (WHO grade I). A, T2WI shows a homogeneous, hyperintense mass in the vermis. B, Contrast-enhanced T1WI shows mild, heterogeneous enhancement of the tumor. C, The D map shows the high D value (1.72 × 10⁻³ mm2/s) of the lesion, which is higher than the cutoff value (≤1.15 × 10⁻³ mm2/s; Table 3). D, The f map shows the low f value (4.2%) of the lesion, which is lower than the cutoff value (>14.1%; Table 3). E, MIB-1 staining reveals a low MIB-1 index (6.0%). F, Immunohistochemical staining for anti-CD31 reveals a low MVD (3.2%). Bar = 100 μm.
Discussion
We found significant correlations between the histology and IVIM parameters of different pediatric intracranial tumors. These results suggest that IVIM imaging reflects cell density and vascularity across different types of pediatric brain tumors. Our findings are consistent with those of previous studies showing a significant correlation between histology and IVIM parameters in animal models16,17 and human patients.6,12,16,17 To our knowledge, no previous study has evaluated the correlation between the IVIM parameters and the histology of intracranial tumors in children. Furthermore, we demonstrated that both the diffusion and perfusion parameters measured on IVIM imaging are useful for grading intracranial neuroectodermal tumors in pediatric patients.
Both of the diffusion parameters (ie, D and ADC) demonstrated good sensitivity and specificity for grading pediatric intracranial tumors. Diffusion parameters reflect the movement of water molecules, which is hindered in some pathologic states (eg, intracellular edema). The ADC has been reported to have high sensitivity in detecting cell density.23⇓–25 The increased number of cell membranes in tumors leads to narrowing of the interstitial space as well as the reduction in the size of the intracellular space, which results in decreased water movement. Thus, the ADC has been used to evaluate cell density in many types of cancer. In previous studies, the ADC was typically calculated using 2 b-values (ie, 0 and 1000 s/mm2).3,4,24 However, in the present study, the D values were significantly lower than the ADC values in both tumor groups. Moreover, there was a 23.3% difference between the D and ADC in high-grade tumors. This difference most likely reflects the increased perfusion fraction of malignant tumors.12 With small perfusion fractions, the following relationship applies: (ADC − D) ∼ f/b. Applying the ADC and D values of low- and high-grade tumors found in this study to this relationship (ie, ADC − D) produces values of 1.9 × 10⁻⁴ mm2/s (high-grade tumors) and 0.6 × 10⁻⁴ mm2/s (low-grade tumors). These values are very close to the f/b (b = 1000 s/mm2) values of 2.2 × 10⁻⁴ mm2/s and 0.8 × 10⁻⁴ mm2/s for high- and low-grade tumors, respectively.
These findings provide strong support for the results and validate the method. Furthermore, the correlation value for the MIB-1 proliferation index and D was higher than for the MIB-1 proliferation index and ADC. This result indicates that D more precisely reflects the tumor cell density than the ADC. We also demonstrated that D had better diagnostic performance than the ADC for differentiating high- and low-grade tumors. In this study, the ADC derived using a pair of b-values had acceptable diagnostic performance for grading; however, the diagnostic performance accuracy using D was an improvement over the conventional ADC.
Of the perfusion parameters, f may reflect tumor vascularity. In general, malignant tumors, in particular gliomas, are hypervascular. Hypervascularity is another important consideration for the histopathologic diagnosis of tumors because malignancy progression is accompanied by neoangiogenesis.26 We demonstrated that the MVD reflects neoangiogenesis progression and its measured values correlated closely with those of f. The f was higher in high-grade than in low-grade tumors, a finding consistent with previous IVIM studies in adults.12,13 Our study may be the first to demonstrate the value of IVIM imaging in pediatric patients with intracranial neuroectodermal tumors. Many researchers have used arterial spin-labeling to grade pediatric tumors because this method can evaluate cerebral blood flow without a contrast agent. Similar to arterial spin-labeling, f can also be measured without contrast agent. This noninvasive feature is useful for children. However, D* was not helpful for tumor grading. This finding has been previously reported in adult IVIM studies.12,19 Moreover, other studies have suggested that D* is poorly reproducible27,28 and could be substantially affected by cardiac motion.29 The cardiac-gating technique may improve D* assessment in tumors.30
The combined D and f had the best diagnostic performance of all parameters investigated in our study. Combining D and f increased the area under the curve compared with each parameter alone. In combination, these 2 parameters can be used to evaluate different pathologic features of intracranial tumors. For example, some infantile tumors have high vascularity and low cell density (ie, hemangioblastoma or choroid plexus papilloma). IVIM imaging can simultaneously evaluate both diffusion and perfusion parameters in the same anatomic space; this feature improves diagnostic accuracy in such tumors. However, it is still difficult to differentiate high-grade tumors, such as medulloblastoma and atypical teratoid/rhabdoid tumor, which have the same pattern of high vascularity and cell density. In such cases, basic information (ie, tumor location and patient age) is essential.
A strength of this study was that histologic diagnoses were available for all patients. However, this study also had some limitations. First, the sample size was very small, especially for patients with grade II glioma (n = 1). Second, the ROI analyses were subjective, which may have introduced selection bias. However, in clinical practice, ROI analysis is often used for diagnosis.6,12,19 Automatic tumor segmentation, which involves computer-aided segmentation and histogram analysis, could help address this issue. Third, the IVIM model used in this study does not account for non-Gaussian diffusion effects, which may lead to the overestimation of f.15 Non-Gaussian fitting may improve the accuracy of f, especially with very high b-values. Fourth, we used only 3 perpendicular directions for diffusion encoding. In anisotropic tissues, (eg, white matter), anisotropic analysis via the diffusion tensor imaging method requires the use of at least 6 directions; however, in clinical practice, DWI averaged over 3 directions is often used during the diagnostic process.
Conclusions
IVIM imaging reflected histology, which suggests that it may be a helpful noninvasive diagnostic method for intracranial neuroectodermal tumor grading in children.
Footnotes
Disclosures: Kazufumi Kikuchi—RELATED: Grant: Japan Society for the Promotion of Science KAKENHI, Comments: grant No. JP 18H06164.
This work was supported by JSPS KAKWNHI Grant Number 18H06164.
Paper previously presented, in part, at: Scientific Assembly and Annual Meeting of Radiological Society of North America, November 29 to December 4, 2015; Chicago, Illinois: No. VSPD11-03.
Indicates open access to non-subscribers at www.ajnr.org
REFERENCES
- Received December 19, 2018.
- Accepted after revision March 27, 2019.
- © 2019 by American Journal of Neuroradiology


Jump to section
Related Articles
Cited By...
- Interobserver Reliability on Intravoxel Incoherent Motion Imaging in Patients with Acute Ischemic Stroke
- Grading of Pediatric Intracranial Tumors: Are Intravoxel Incoherent Motion and Diffusional Kurtosis Imaging Superior to Conventional DWI?
- Radiomics of Pediatric Low-Grade Gliomas: Toward a Pretherapeutic Differentiation of BRAF-Mutated and BRAF-Fused Tumors