
Abstract
BACKGROUND AND PURPOSE: Fully automatic quantification methods of spinal cord compartments are needed to study pathologic changes of the spinal cord GM and WM in MS in vivo. We propose a novel method for automatic spinal cord compartment segmentation (SCORE) in patients with MS.
MATERIALS AND METHODS: The cervical spinal cords of 24 patients with MS and 24 sex- and age-matched healthy controls were scanned on a 3T MR imaging system, including an averaged magnetization inversion recovery acquisition sequence. Three experienced raters manually segmented the spinal cord GM and WM, anterior and posterior horns, gray commissure, and MS lesions. Subsequently, manual segmentations were used to train neural segmentation networks of spinal cord compartments with multidimensional gated recurrent units in a 3-fold cross-validation fashion. Total intracranial volumes were quantified using FreeSurfer.
RESULTS: The intra- and intersession reproducibility of SCORE was high in all spinal cord compartments (eg, mean relative SD of GM and WM: ≤ 3.50% and ≤1.47%, respectively) and was better than manual segmentations (all P < .001). The accuracy of SCORE compared with manual segmentations was excellent, both in healthy controls and in patients with MS (Dice similarity coefficients of GM and WM: ≥ 0.84 and ≥0.92, respectively). Patients with MS had lower total WM areas (P < .05), and total anterior horn areas (P < .01 respectively), as measured with SCORE.
CONCLUSIONS: We demonstrate a novel, reliable quantification method for spinal cord tissue segmentation in healthy controls and patients with MS and other neurologic disorders affecting the spinal cord. Patients with MS have reduced areas in specific spinal cord tissue compartments, which may be used as MS biomarkers.
ABBREVIATIONS:
- AMIRA
- averaged magnetization inversion recovery acquisitions
- bSSFP
- balanced steady-state free precession
- DSC
- Dice similarity coefficient
- EDSS
- Expanded Disability Status Scale
- HC
- healthy control
- HD
- Hausdorff distance
- MDGRU
- multidimensional gated recurrent units
- RSD
- relative SD (also known as coefficient of variation)
- SC
- spinal cord
- SCWM
- spinal cord WM
- SCGM
- spinal cord GM
- SCORE
- automatic spinal cord compartment segmentation
- TIV
- total intracranial volume
The spinal cord (SC) is an important part of the CNS, and SC involvement is seen in various neurologic disorders of diverse pathophysiology (eg, genetic, inflammatory, demyelinating, degenerative, infectious, and so forth).1,2 In MS, focal SC lesions are the result of inflammatory demyelinating events,3,4 whereas diffuse tissue volume loss (also known as atrophy) also occurs and reflects an independent neurodegenerative process.5,6 This heterogeneous SC injury is seen to various extent with nonuniform involvement of the SC GM and WM with regard to both lesions and atrophy.7⇓-9 Therefore, structural measures of the SC compartments can improve our understanding of SC pathology in MS and may contribute substantially to patient management in the future.
MR imaging is the principal tool for the evaluation of SC damage in research settings and clinical routine.10 However, accurate volumetric measurements of SCGM and SCWM have been challenging using “conventional” SC MR imaging. To that end, the averaged magnetization inversion recovery acquisitions (AMIRA) approach was suggested for morphometry-dedicated MR imaging of the cervical SC, which allows excellent SCGM/WM contrast in clinically feasible acquisition times of 51 seconds/slice.11 Moreover, fully automatic segmentation methods using different approaches were able to reliably segment SCGM and WM in healthy subjects in the past few years.12⇓⇓⇓-16 Most recently, multidimensional gated recurrent units (MDGRU) neural segmentation networks17 of SCGM/WM have demonstrated highly accurate and reproducible results in healthy cervical SC AMIRA images.18 However, an accurate and reproducible segmentation method in patients with MS is more challenging due to the presence of SC lesions.16
In this study, we developed a fully automated cervical SC compartment segmentation (SCORE) method for quantification of the SCGM (as well as its subdivisions: anterior/posterior horns and gray commissure), WM, and lesions in patients with MS and healthy controls (HCs). Our approach used MDGRU neural segmentation networks for postprocessing of AMIRA images. We then validated the reproducibility and accuracy of SCORE and did an explorative analysis of SC measurements in patients with MS.
MATERIALS AND METHODS
Subjects and MR Imaging Acquisition
Twenty-four patients with MS from an ongoing prospective multicenter cohort study19 (14 women; 15 relapsing-remitting, 6 secondary-progressive, and 3 primary-progressive MS cases; mean age, 41.2 [SD, 11.9] years; mean disease duration, 12.0 [SD, 8.6] years); and 24 sex- and age-matched HCs with no history of neurologic, psychiatric, or other medical disorders (15 women; mean age, 40.2 [SD, 10.8] years) were recruited from July 2017 until October 2018. The diagnosis of MS was made in accordance with the established criteria of an international panel,20 and patients underwent a clinical examination including the Expanded Disability Status Scale (EDSS; median score, 2.25 [SD, 1.84]; relapsing-remitting MS, 1.5; progressive MS, 4.0, P < .01). Experimental procedures conformed to the Declaration of Helsinki, and the local ethics committee approved the study (EKNZ-BASEC 2016–01461). All participants signed an informed consent.
All participants were scanned in two 3T whole-body MR imaging systems: Cervical SC MR imaging was performed on a Magnetom Prisma (Siemens) system, whereas brain images were acquired on a Magnetom Skyra (Siemens) system (as part of the above-mentioned prospective multicenter cohort study19). HCs enrolled in this study were scanned 3 times in a test-retest fashion. The first 2 MR images were obtained back-to-back without repositioning to allow intrasession comparisons. The third scan was obtained after subject repositioning to allow intersession comparisons. Patients with MS underwent a single MR imaging scan.
In each scan, we acquired 12 axial AMIRA slices (FOV = 128 × 128 mm2, slice thickness = 8 mm, 4-mm slice overlap, in-plane resolution = 0.67 × 0.67 mm2, TE bSSFP = 2.14 ms, TR bSSFP = 5.13 ms, no signal averaging, acquisition time = 51 seconds per slice, total acquisition time = 10 minutes 12 seconds) over a 52-mm SC segment, extending approximately from the C2 to C5 vertebral level.11,16,18 The most rostrally acquired slice was placed with its lower surface adjacent to the most rostral surface of the C2/C3 intervertebral disc. For precise positioning of each individual slice and its orthogonal angulation to the course of the SC, a strongly T2-weighted TSE sequence with high contrast between CSF and SC was used as a reference. For each slice, the AMIRA approach acquired 8 images of considerably different tissue contrast among SCGM, WM, and CSF with effective TIs = 97.1, 158.7, 220.2, 281.8, 343.3, 404.9, 466.5, and 528.0 ms (Fig 1). Averaging of the first 5 images yielded MR images with an enhanced GM/WM contrast-to-noise ratio, whereas averaging of the last 3 images generated MR images with a high WM/CSF contrast-to-noise ratio.

Schematic illustration of the automatic SCORE method using AMIRA images and subsequent segmentation of all SC compartments using MDGRU in HCs and patients with MS. A, Median slice of a TSE sequence with indications of the acquired AMIRA slices in green. B, Stack of AMIRA slices; each slice constitutes an average of all inversion images. C, AMIRA inversion images of 1 representative slice acquired at different inversion times. D, Different averages of selected inversion images. Manual segmentations were performed using the 1–5 AMIRA average for the SC GM/WM and MS lesion borders, and the 6–8 AMIRA average for the SC/CSF borders. These manual segmentations were used to train MDGRU neural networks for automatic segmentation of the SC/CSF borders (gold), SC GM/WM (dark brown), SCGM subdivisions (anterior horns, red; posterior horns, dark blue; gray commissure, dark green) and SC MS lesion borders (purple). MDGRU always used all 8 inversion images simultaneously without averaging.
The cervical SC protocol also included a TSE sequence and a high-resolution 3D MPRAGE sequence. Brain MR imaging protocol also included a high-resolution 3D MPRAGE sequence (Online Supplemental Data).
Postprocessing of MR Images
The SCORE method was developed as follows: Three experienced raters segmented the SC/CSF, SCGM/WM, as well as lesional/nonlesional SC tissue borders in all AMIRA slices of the HCs (only the first of 3 scans) and patients with MS. Interrater reproducibility of manual segmentations is shown in and the Online Supplemental Data. One rater also segmented all HC AMIRA slices to allow intrasession and intersession agreement comparisons between manual and automatic segmentations (Online Supplemental Data). A manual consensus from the 3 raters was reached using majority voting for each segmentation.
Subsequently, as proposed in a previous study,18 manual segmentations were used to train MDGRU neural segmentation networks for SCGM and WM as well as MS lesions. In short, MDGRU is a generalization of a bidirectional recurrent neural network that can process medical images in multiple dimensions. It achieves this task by treating each direction along each of the spatial dimensions independently as a temporal direction. MDGRU is fed by individual 2D AMIRA slices without stacks of consecutive slices. MDGRU processed each 2D image using 2 convolutional gated recurrent units for each image dimension, 1 in a forward and 1 in a backward direction, and then combined all individual results. The MDGRU framework offers on-the-fly data augmentation. A model diagram regarding network architecture as well as detailed analysis of MDGRU was published previously by Andermatt et al.17 Furthermore, the manual hyperparameter search for the MDGRU framework was described in detail in a previous conference article reporting a preliminary version of our method.18 All hyperparameters are used unchanged for all models in this work. Each MDGRU neural network was trained by the manual segmentations of a single rater.
To prevent “inverse crime,” we applied 3-fold cross-validation in the following manner: During training of MDGRU neural networks for SC GM-WM as well as MS lesions, our manual segmentations were separated into 3 mutually disjointed subsets; then, two-thirds of our manual segmentations were used as training data sets, and the “left-out” one-third, as test data sets. For the networks trained on the HC data, all 3 acquisitions of each subject were used, but all 3 scans of each HC were used within only 1 subset. This process was repeated for each combination of subsets (3 times in total). By means of this method, AMIRA images from all patients with MS and HCs were automatically segmented once as “unseen” or independent test data sets, and no subject or slice of the test data set was ever used for the training of an MDGRU network during the entire development of SCORE. This process was performed separately for segmentations of each SC compartment, as well as separately for HCs and patients with MS. In the end, SC compartments in each AMIRA slice from all patients with MS and HCs were automatically segmented as test data sets 3 times, 1 for each trained neuronal network originating from each of the 3 raters performing manual segmentations. A validation step for tuning parameters was performed as described previously.18 Finally, a MDGRU consensus of these 3 segmentations was then reached using majority voting (Fig 1), which was then used as the final SCORE segmentation.
In a second step, using the SCORE SCGM segmentations, one experienced rater delineated the borders of the spinal canal area as well as between the anterior horns (approximately laminae VI–IX), posterior horns (approximately laminae I–V), and gray commissure (approximately lamina X), as proposed before in manual delineations of the SCGM (Fig 1, right image in the lower row).21,22 Again, these manual segmentations (in combination with SCORE SCGM segmentations) were used to train neural segmentation networks with MDGRU in a 2-fold cross-validation fashion (Fig 1). The full code of MDGRU is available on https://github.com/zubata88/mdgru (Horvath et al18). No manual corrections of SCORE segmentations were performed. SCORE segmentations were visually inspected for quality, and segmentation failures were excluded from our analysis.
The estimated total intracranial volume (TIV) was extracted from brain MPRAGE image in an automatic fashion using the longitudinal stream in FreeSurfer (Version 6.0.0; http://surfer.nmr.mgh.harvard.edu) (Online Supplemental Data)23 for further use as a normalization factor for SC measurements.
Statistical Analysis
Relative SDs (RSDs) (also known as coefficients of variation), Dice similarity coefficients (DSCs), and Hausdorff distances (HDs) were used for assessment of the intra- and intersession reproducibility in manual and SCORE consensus segmentations as well as accuracy (SCORE versus manual) (Online Supplemental Data). Because of non-normally distributed data, we performed a Tukey ladder of powers transformation in RSD, HD, and DSC values before further statistical analysis.
Comparisons between SCORE and manual reproducibility measures, between intra- and intersession measures, between SC compartments among the axial slice levels (1–12), and between accuracy measurements in HCs and patients with MS were investigated using multivariate analysis of variance with an additional Tukey post hoc analysis of variance, as well as with paired, 2-sided t tests corrected for multiple comparisons using the false discovery rate approach. Correlations between areas of SC compartments and TIV as well as spinal canal areas, age, and sex were investigated using linear mixed-effects regression models using 2 random intercepts to allow variance among slice levels and subjects. TIV, spinal canal areas, age, and sex were evaluated as normalization factors for measurements of SC compartments, as proposed in previous studies.24,25 The statistical formulas used for normalization are shown in the Online Supplemental Data. The normalization effect of a single or combination of normalization factors was evaluated by comparing the RSD of the raw and normalized values using the Feltz and Miller asymptotic test.26 By means of linear mixed-effects regression models, differences between patients with MS and HCs were evaluated and corrected with multiple comparisons using the false discovery rate approach. Hierarchic multiple linear regression analysis was performed to investigate the associations between mean cross-sectional areas of cervical SC compartments (calculated using linear mixed-effects regression models) and the EDSS, using a backward elimination procedure.
RESULTS
Each scan was performed a total of 3 times for each HC and once for each patient with MS, and 12 slices were acquired per scan. Hence, in total, 3 × 12 × 24 = 864 slices from 24 HCs and 12 × 24 = 288 slices from 24 patients with MS were acquired. Nine of 864 and 1/288 axial cervical SC slices acquired in HCs and patients with MS, respectively, were excluded from further analysis because of severe image artifacts. Subsequently, SCORE successfully segmented 96% (817/855) and 94% (271/287) of the remaining slices in HCs and patients with MS, respectively (Fig 2). In HCs, 4% of all SCORE segmentations (34/855) failed because of poor image quality (2/855) or contact of the cervical SC with the posterior vertebral arch (32/855), which reduced the contrast between the SC and the CSF. In patients with MS, 6% of all SCORE segmentations failed because of mild image artifacts (5%, 14/287) and misclassification of SC lesions (1%, 3/287) either as CSF or as SCGM (Online Supplemental Data.). These failed SCORE segmentations involved images of 5/24 (21%) HCs and 4/24 patients with MS (17%) included in our study. Failed SCORE segmentations were excluded from further statistical analysis. Reproducibility and accuracy measurements including SCORE segmentation failures are shown in the Online Supplemental Data.

Cross-sectional areas of all SC compartments in HCs and patients with MS. Representative SCORE segmentations of all AMIRA slices acquired in one HC and one patient with MS. The SC/CSF borders are depicted in gold; the SC GM/WM borders, in dark brown; the anterior horn borders, in red; the posterior horn borders, in dark blue; the gray commissure borders, in dark green; and the lesion borders, in purple.
Reproducibility
Individual intra- and intersession reproducibility measurements of SCORE and manual segmentations as well as comparisons between the 2 approaches and also between intra- and intersession reproducibility in HCs are displayed in Fig 3 and the Online Supplemental Data.

Reproducibility of SCORE and manual segmentations in all SC compartments of HCs. A, Representative SCORE segmentations of respective AMIRA slices acquired in a scan-rescan fashion on a single HC. The SC/CSF borders (gold) are shown on the average of the last 3 TI AMIRA images of each slice, whereas the SC GM/WM (dark brown) and SC GM subdivision borders (anterior horns, red; posterior horns, dark blue; gray commissure, dark green) are shown on the average of the first 5 TI AMIRA images. The first 2 MR images were obtained back-to-back without repositioning to allow intrasession comparisons. The third scan was obtained after patient repositioning to allow intersession comparisons. Note the high agreement of SCORE segmentations between scans. Intra- and intersession reproducibility of manual (blue) and SCORE (red) was measured by DSC (B).
In HCs, both intra- and intersession reproducibility of SCORE segmentations was high in all SC compartments except for the gray commissure (all mean RSD ≤ 5.54%, DSC ≥0.87, HD ≤ 0.60 mm). Reproducibility of SCORE segmentations was higher compared with manual segmentations (all, P < .001). Both intra- and intersession reproducibility generally increased in the following order: gray commissure < posterior horns < anterior horns ∼ GM < WM < total SC, as measured by RSD and DSC (all, P < .001). Intra- and intersession reproducibility also slightly decreased in more caudally acquired SC slices (all, P < .001).
In SCORE segmentations, intersession reproducibility was slightly lower compared with intrasession reproducibility in all SC compartments except for the anterior horns (total SC and GM, P < .001; gray commissure, P < .01; WM and posterior horns, P < .05).
Accuracy
Individual accuracy measurements of SCORE compared with manual segmentations in HCs and patients with MS, comparisons between patients with MS and HCs, and comparisons between normal-appearing and total SC compartments are shown in the Online Supplemental Data and Fig 4. Most analyzed AMIRA slices in patients with MS (198 of 271; 73%) demonstrated SC lesions. No lesions were found in any analyzed AMIRA slices in a total of 3/24 patients with MS (13%). Examples of MS lesion SCORE segmentations are shown in the Online Supplemental Data.

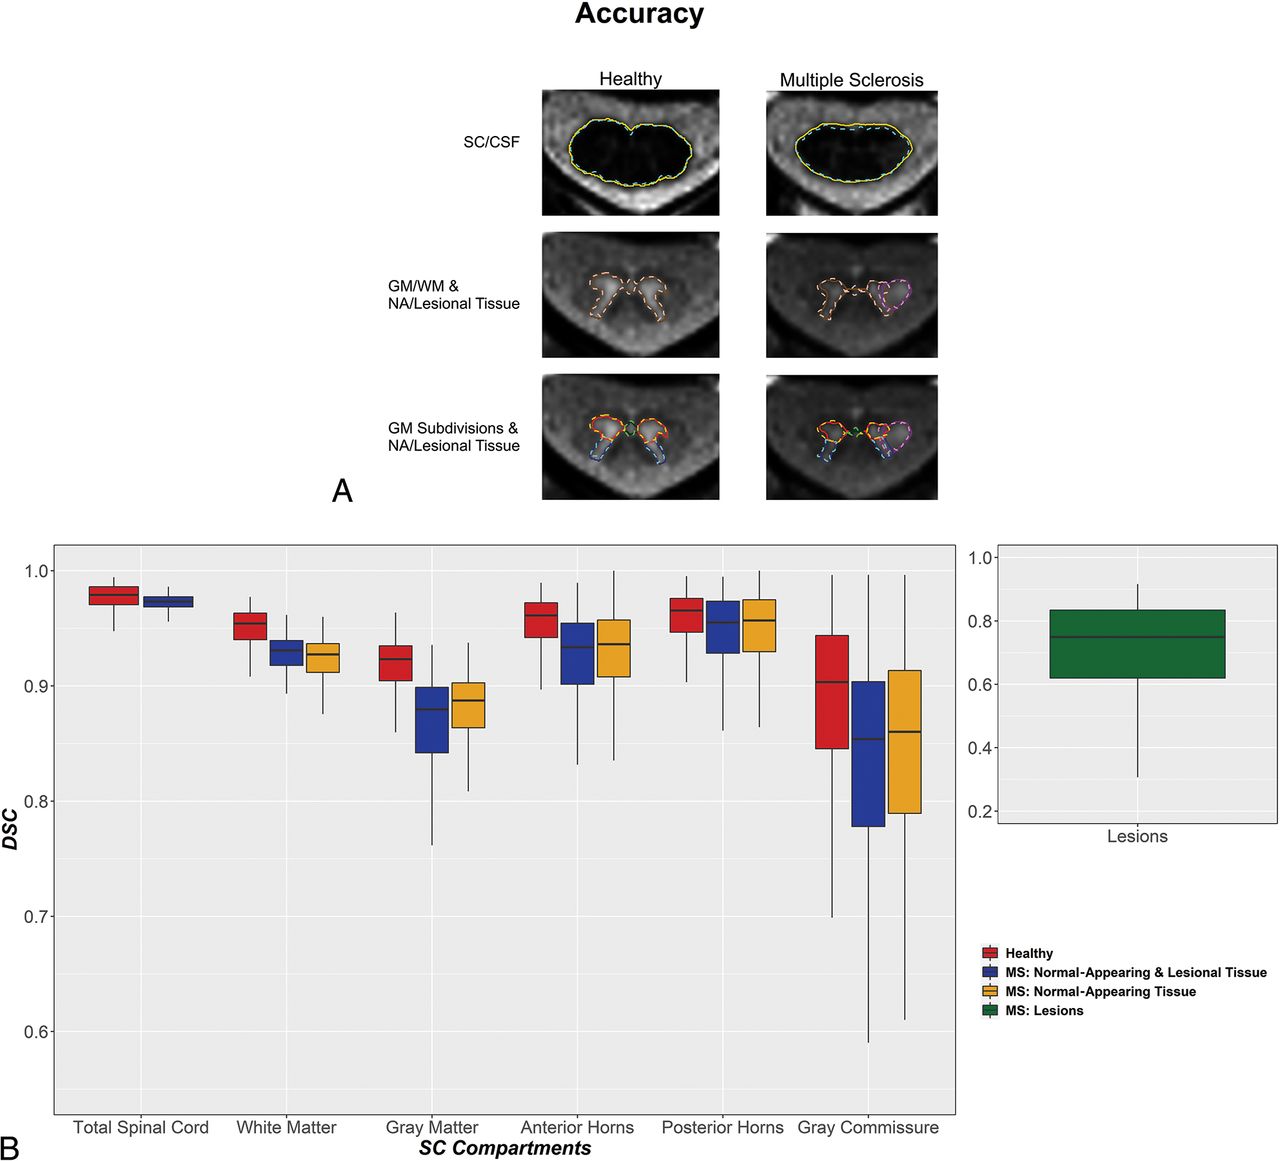
Accuracy of SCORE versus manual segmentations in all SC compartments of HCs and patients with MS. A, Representative SCORE and manual segmentations of AMIRA slices acquired in 1 HC and 1 patient with MS. The SC/CSF borders of manual and SCORE segmentations are shown in aqua (dashed line) and gold, respectively. The SC GM/WM borders of manual and SCORE segmentations are shown in coral (dashed line) and dark brown, respectively. The SC anterior horns, posterior horns, and gray commissure of manual and SCORE segmentations are shown in orange, turquoise, lime (dashed lines), red, navy blue, and dark green, respectively. Finally, the lesion borders of manual and SCORE segmentations are shown in violet (dashed line) and dark purple, respectively. Note the high agreement between manual and SCORE segmentations. The accuracy of SCORE versus manual segmentations was measured by DSC (B) and was generally high. Healthy, normal-appearing and lesional tissue and normal-appearing tissue are shown separately for each SC compartment in red, blue, and yellow, respectively. SC MS lesions are shown separately in green. Note the high accuracy of SCORE compared with manual segmentations in all SC compartments except for the gray commissure and lesions in both HCs and patients with MS.
In HCs and patients with MS, the accuracy of SCORE compared with manual segmentations was high in all SC compartments except for the gray commissure and lesions (HCs/patients with MS: all, mean DSC ≥ 0.89/0.85, HD ≤ 0.56/1.12 mm, RSD ≤ 6.29%/11.09%, respectively). Accuracy was slightly lower in patients with MS compared with HCs in all homologous SC compartments except for the total SC and the normal-appearing posterior horns (total posterior horns, P < .01; all other comparisons, P < .001). In addition, the accuracy of SCORE compared with manual segmentations varied between SC compartments. In HCs, accuracy generally increased in the following order: GM < WM < total SC (all, P < .001). In patients with MS, accuracy generally increased in the following order: lesions < GM < WM ∼ total SC (all, P < .001). Because the borders between SCGM subdivisions were delineated on SCORE SCGM segmentations, comparisons between these SC compartments were evaluated separately. Accuracy in the SCGM subdivisions of HCs generally increased in the following order: gray commissure < posterior horns ∼ anterior horns (all, P < .001), and in MS in the following order: gray commissure < posterior horns < anterior horns (all, P < .001, except for posterior-versus anterior horns, P < .01). Moreover, in both HCs and patients with MS, accuracy also slightly decreased in more caudally acquired SC slices (both, P < .001).
Furthermore, in patients with MS, accuracy was similar for normal-appearing and total areas of all SC compartments, except for lower accuracy in the normal-appearing WM compared with total WM (P < .01). Accuracy also decreased in patients with MS, with higher EDSS scores (P < .001, Online Supplemental Data). Finally, accuracy was similar in patients with relapsing-remitting and progressive MS, except for the total GM (higher in relapsing-remitting) and normal-appearing posterior horns (higher in progressive MS, P < .001) (Online Supplemental Data).
Areas of SC Compartments and Normalization Strategies
SCORE versus Manual Segmentations.
Areas of SC compartments as measured by SCORE and manual segmentations as well as comparisons between the 2 approaches in HCs and patients with MS are shown in the Online Supplemental Data. Compared with manual segmentations, SCORE slightly overestimated normal-appearing SCGM areas as well as normal-appearing and total anterior horn areas and underestimated normal-appearing as well as total posterior horn areas, normal-appearing gray commissure areas, and lesion areas in patients with MS (all, P < .001). No other significant differences between manual and SCORE segmentations were found in HCs and patients with MS.
Patients with MS versus HCs.
In view of the results of the normalization analysis (Online Supplemental Data), total SC and WM areas were normalized using TIV. After multiple-comparison correction, patients with MS had measures lower than controls in total SC (P < .05), total WM (P < .001 and P < .05), and the total anterior horn (P < .01) (Online Supplemental Data). Total GM areas and total gray commissure areas were similar between groups. Patients with progressive MS had lower total GM and anterior horn areas compared with those with relapsing-remitting MS (P < .05), but areas of all other SC compartments were similar between these groups (Online Supplemental Data).
Correlation with Clinical Outcomes
Lower total WM and larger lesion areas were the most significant independent predictors of higher EDSS scores in a multivariate analysis (βwm = −0.38, βlesion = 0.40). Together with disease duration and disease type as covariates, the final model accounted for 81% of the EDSS variance.
DISCUSSION
In this work, we propose a novel method, called SCORE, for fully automatic quantification of cervical SC compartments in HCs and patients with MS, combining the exquisite properties of the AMIRA sequence to image the spinal cord and MDGRU neural networks to segment GM/WM and MS lesions. We show that this method is capable of accurate quantification of both the normal-appearing and lesional SCWM and GM as well of the different regions of the SCGM in MS. Moreover, we evaluated demographic and skull- and spine-derived metrics that could be used in normalization strategies to reduce intersubject variability in cervical SC cross-sectional measures and then applied the best normalization strategy to compare cervical SC compartments between patients with MS and HCs.
The 2D AMIRA sequence provides a unique contrast as well as low motion and flow sensitivity in 51 seconds/slice.11,16 In fact, only <1% of the slices in this study were discarded due to motion artifacts, and generally, the scans were well-tolerated, even by patients with MS with serious disability. Previously, we had also shown that it was possible to provide reliable and reproducible segmentations of the SC GM and WM using MDGRU in healthy subjects.18
Our method demonstrated high reproducibility and accuracy in HC data (Online Supplemental Data). Intra- and intersession reproducibility in HC data was markedly higher in SCORE compared with a reference of 3 expert manual segmentations. Moreover, the new framework increased the quantification reproducibility by approximately 50% in HCs compared with a previous approach using a different segmentation method.16 SCORE segmentations showed slightly better intra- than intersession reproducibility for most spinal cord compartments. This finding points to a marginal effect of patient repositioning in the MR imaging scanner on our measurements, also possibly related to our 2D imaging approach. However, because both intra- and intersession reproducibility was high in all SC compartments, our pipeline for quantification of SC compartments is promising for longitudinal measurements in both research settings and clinical routine. Pitfalls such as misclassification of lesions as CSF did not occur, as was the case in the past.16 Furthermore, the current algorithm demonstrated slightly higher intra- and intersession reproducibility as well as accuracy in HC data (eg, mean DSC in total SC: 0.98 versus 0.95; WM: 0.95 versus 0.90; GM: 0.92 versus 0.86) compared with a preliminary algorithm version applied in the same HC MR imaging data,18 possibly due to the addition of further raters for training of MDGRU neural networks.
A head-to-head comparison of previously published methods with ours using the same data set is currently not possible due to technical limitations. However, considering the raw numbers, our method showed higher intersession reproducibility in HCs (eg, RSD for SCGM in Prados et al12 = 7.4% [SD, 4.9%], currently proposed = 3.50% [SD, 2.61%]; intraclass correlation coefficient in Datta et al13 = 0.88, currently proposed = 0.89, not shown in the analysis). In addition, accuracy was quite high when SCORE segmentations were compared with the manual agreement by 3 experienced raters. Indeed, our method showed higher accuracy compared with the established iterative nonlocal simultaneous truth and performance level estimation (STAPLE) algorithm by Asman et al,27 even with additional “tuning” of this algorithm to our HC AMIRA data, as shown previously.28 Furthermore, preliminary work using MDGRU18 already showed remarkable accuracy in HCs when tested on a different cohort (40 training data sets and 40 test data sets acquired at 4 different sites) and compared with 8 methods for in vivo quantification of SCGM including the 6 methods used in a recent SCGM segmentation challenge.18,29⇓-31 In addition, the current version of our automatic segmentation method shows higher accuracy in HCs, though tested in a different data set and with a different imaging approach (eg, Perone et al,29 currently integrated in the Spinal Cord Toolbox (https://spinalcordtoolbox.com/), for SCGM in HCs: mean DSC = 0.85 [SD, 0.04], mean HD = 2.61 [SD, 2.15] mm; currently proposed: mean DSC = 0.92 [SD, 0.03], mean 0.53 [SD, 0.32] mm. Finally, our current method also demonstrated accuracy results comparable with those of a recent study evaluating the accuracy of SCGM segmentations using the deep, dilated convolutions approach of Perone et al on an ex vivo acquired image data set.29 However, these comparisons should be considered with caution due to differences in the data sets, the number of participants, MR imaging sequences, MR imaging scanners, and study design included in these studies.
Regarding the performance of SCORE in cervical SC images of patients with MS, accuracy was high in all SC compartments despite the fact that the presence of lesions, the atrophic involution of GM and WM tissues, as well as difficulties to sustain prolonged scans could be challenging aspects for SC segmentation in patients with MS (Online Supplemental Data). In addition, SCORE demonstrated higher accuracy than a previously proposed fully automatic segmentation algorithm applied in patients with MS, though in a different patient cohort with a different imaging approach (Prados et al12 for SCGM in patients with clinically definite MS: mean DSC = 0.74–0.79, mean HD = 1.61–1.44 mm; currently proposed mean DSC = 0.84, mean HD = 0.89 mm). However, agreement with manual segmentations was lower compared with that of HCs. The reason for this finding probably lies, at least in part, in the presence of SC lesions affecting both the SCGM and WM, diminishing the contrast between the 2 SC compartments and posing additional challenges for exact delineation of SCGM and WM. Moreover, the GM/WM contrast reduction in lesions led to lower precision and higher variability of the manual segmentations, which were then used for subsequent algorithm training; this issue also possibly contributed to a worse SCORE performance in lesions. Another explanation for this reduction of accuracy in patients with MS compared with HCs is the smaller slice number used to train MDGRU neural segmentation networks in patients with MS because data from 3 MR imaging scans (acquired back-to-back for reproducibility measurements) were available in HCs, whereas a single scan was used in patients with MS. This notion is also supported by the fact that the accuracy of spinal canal area SCORE segmentations was also lower in patients with MS compared with HCs.
SCORE segmentations of cervical SC lesions demonstrate significantly lower accuracy compared with other SC compartments with a mean DSC of 0.69, and they underestimated SC lesion areas compared with manual segmentations. However, these results show higher accuracy compared with a recently developed automated SC lesion-segmentation approach based on a sequence of 2 convolutional neural networks using T2-weighted and T2*-weighted SC images of patients with MS, which reached a median DSC of 0.60, albeit on another patient cohort.32 These findings should also be seen in the light of the big interrater variability in manual segmentations of SC lesions, as previously reported.32
In previous MR imaging and histopathologic studies, controversial results were shown with regard to whether GM and/or WM atrophy drives SC volume loss in MS.7⇓-9,33 Our patients with MS showed a similar reduction in SCWM and GM (10% and 8%, respectively) compared with HCs. Besides, both normal-appearing as well as total SCWM and anterior horn areas were found to be reduced in patients with MS. This finding indicates neuronal injury that is, at least partially, not related to focal SC lesions and possibly reflects the aftermath of a distinct neurodegenerative pathomechanism. Most surprising, patients with MS had lower anterior horn (14% reduction) but similar posterior horn areas compared with HCs, especially at the cervical SC enlargement (Fig 2 and Online Supplemental Data), a result that is in line with a previous pathologic study demonstrating loss of interneurons and lower motor neurons in the normal-appearing and lesional anterior horns.34 Future studies should further investigate the origin of this finding. However, in our small MS cohort, smaller SCWM areas and larger SC lesions were the most important independent predictors of more neurologic deficits. Although SC lesions are a well-established correlate of physical disability in MS,7,35,36 the greater importance of SCWM, and not GM, contradicts findings of previous studies in this field.7,9,33 However, this contradiction may be caused by the small sample size of the present MS cohort. Nevertheless, from the neuroanatomic standpoint, the correlation between SCWM atrophy and clinical disability is most probably related to demyelination and axonal loss occurring in WM tracts related to sensorimotor functions.
Some limitations of our study should be mentioned. Reproducibility was assessed only in HCs and not in patients with MS because of the burden of repetitive spinal cord MR imaging on our patients. Moreover, SCORE was trained in a relatively small number of participants. However, in total, 1088 slices were analyzed for algorithm development, whereas the 3-fold cross-validation during the development of SCORE should have increased the robustness of the method. In addition, SCORE is currently capable of reliably segmenting only AMIRA images of the cervical SC. Due to the distinct shape of the SCGM in different regions of the SC (eg, cervical versus thoracic), SCORE might not perform with the same reproducibility and accuracy demonstrated in the current work. Hence, for segmentation of other SC regions, separate MDGRU neural networks should be trained and validated. Moreover, our results concerning differences between patients with MS and HCs in areas of SC compartments should be considered with caution because of our small sample size. To that end, further larger cross-sectional and longitudinal analyses are required to confirm the presented findings. The current study did not include a direct comparison between our segmentation method and other established segmentation algorithms (eg, the Spinal Cord Toolbox15) because this would require training of separate neural networks of other algorithms in our AMIRA data set. However, the comparison of a previous version of our SC segmentation algorithm with multiple other approaches on an independent imaging data set of HCs (including images originating from different imaging protocols with different FOVs, size, and resolution) indicated a remarkable performance of MDGRU neural networks.18 In addition, our patients were recruited at a single institution and imaged on a single scanner, which may limit the generalizability of our results. Thus, a comparison of different segmentation algorithms on a common multicentric MR imaging data set of patients with MS including different imaging techniques should be considered in the future. Finally, AMIRA is currently not fully available in clinical routine, limiting the use of the proposed quantification method to research settings for now.
CONCLUSIONS
In this work, we demonstrate a novel, reliable quantification method in patients with MS and HCs for SC GM and WM, as well as for subdivisions of the SCGM and MS lesions. This method will allow future investigation of SC compartments in a number of neurologic disorders, including MS, in both research and clinical settings. As motivation for future scientific effort on this matter, our patients with MS were found to have reduced areas in specific SC compartments, which may be used as imaging biomarkers in this disease.
Acknowledgments
We would like to thank all participants of our study as well as all medical and nonmedical staff of the Neurology Department at the University Hospital Basel for assistance during subject recruitment.
Footnotes
C. Tsagkas and A. Horvath-Huck contributed equally to this work.
C. Tsagkas was supported by the Swiss National Science Foundation (grant No. 320030_156860), the Stiftung zur Förderung der Gastroenterologischen und Allgemeinen Klinischen Forschung, as well as the University of Basel (grant No. 3MS1020 and 3MS1049). C. Granziera is funded by the Swiss National Science Foundation (grant No. PP00P3_176984), the Stiftung zur Förderung der Gastroenterologischen und Allgemeinen Klinischen Forschung, and the Eurostar Program of Horizon 2020 (grant No. E!113682). M. Weigel was supported by the Swiss National Science Foundation (SNSF, grant number: 320030_156860), the Swiss Multiple Sclerosis Society, and the Stiftung zur Förderung der Gastroenterologischen und Allgemeinen Klinischen Forschung. He is currently funded by the Swiss National Science Foundation (grant No. PP00P3_176984) and Biogen.
Disclosure forms provided by the authors are available with the full text and PDF of this article at www.ajnr.org.
Indicates open access to non-subscribers at www.ajnr.org
References
- Received January 5, 2022.
- Accepted after revision December 5, 2022.
- © 2023 by American Journal of Neuroradiology


Jump to section
Related Articles
Cited By...
- No citing articles found.