
Abstract
BACKGROUND AND PURPOSE: MR imaging characteristics of gliomatosis cerebri reiterate the diffuse nature of this tumor but are nonspecific and thus may pose a diagnostic challenge. Because perfusion MR imaging can provide a physiologic map of the microcirculation, we compared the measured relative cerebral blood volume (rCBV) at perfusion imaging with histopathologic findings in gliomatosis cerebri. MR spectroscopic findings were also reviewed.
METHODS: Retrospective analysis was performed of conventional and perfusion MR images from seven patients with proved gliomatosis cerebri. The conventional MR images were evaluated for the presence or absence of contrast enhancement, necrosis, and extent of T2-weighted signal intensity abnormality. Dynamic contrast-enhanced T2*-weighted gradient-echo echo-planar images were acquired during the first pass of a bolus injection of gadopentetate dimeglumine. The rCBV was calculated by using nondiffusible tracer kinetics and expressed relative to normal-appearing white matter. Pathologic findings were reviewed in all patients and compared with the MR perfusion data. Multivoxel 2D chemical shift imaging proton MR spectroscopic data were available for three patients and single-voxel data for one patient.
RESULTS: Conventional MR images showed diffuse abnormality in all cases and absence of contrast enhancement in all but one case. Average rCBV range was 0.75–1.26 (mean, 1.02 ± 0.42 [SD]). MR spectroscopic data revealed spectra consistent with presence of tumoral disease. Histopathologic review showed absence of vascular hyperplasia in all specimens.
CONCLUSION: The low MR rCBV measurements of gliomatosis cerebri are in concordance with the lack of vascular hyperplasia found at histopathologic examination; thus, perfusion MR imaging provides useful adjunctive information that is not available from conventional MR imaging techniques.
Gliomatosis cerebri was first described in a case report by Nevin (1) in 1938 as a glial neoplasm with diffuse infiltration throughout the brain yet with relative preservation of underlying neuronal architecture. Clinically, patients with gliomatosis cerebri usually have relatively minor neurologic or intellectual deficits at presentation (2). These deficits may include dementia, headache, altered mental status or psychosis, as well as sensory or motor deficits, visual disturbances, and cranial nerve signs. At histopathologic examination, gliomatosis cerebri is characterized by a diffusely infiltrative tumor composed of neoplastic glial cells with variable cellularity and cytologic composition. Features such as vascular proliferation and necrosis are typically absent (2–4).
Conventional MR imaging typically demonstrates a diffusely infiltrative process with minimal or no mass effect and absence of necrosis. Focal parenchymal enhancement is present only in a minority of cases, presumably because there is relative preservation of the blood-brain barrier (2, 5–7). Although conventional MR imaging is considered superior to CT in characterizing this entity, MR findings are nonspecific and can pose a diagnostic challenge (8, 9).
Dynamic contrast material–enhanced T2*-weighted perfusion MR imaging has proved to be beneficial in characterizing brain tumors (10, 11) by providing a noninvasive assessment of vascularity. This information is not available from conventional contrast-enhanced MR imaging, which relies largely on breakdown of the blood-brain barrier. Gliomatosis cerebri is a tumor that is known to be pathologically indolent despite its otherwise aggressive, widespread presentation on conventional MR images. Because a physiologic map of the microcirculation can be constructed with perfusion MR imaging, this technique can noninvasively characterize the distinct lack of vascularity found in this entity.
The purpose of this study was to compare measured relative cerebral blood volume (rCBV) with histopathologic findings in gliomatosis cerebri. We retrospectively reviewed perfusion MR imaging findings in patients with histopathologically proved gliomatosis cerebri in conjunction with conventional MR imaging findings. In addition, MR rCBV measurements were compared with assessment of tumor vascularity in histologic specimens. We also reviewed results of MR spectroscopy.
Methods
Imaging
Retrospective analysis of conventional and perfusion MR images from seven patients with pathologically proved gliomatosis cerebri was performed. The studies used were acquired from February 1998 to May 2001. The ages of the patients ranged from 11 to 75 years. There were four male and three female patients. Among the seven patients, histologic confirmation of the diagnosis was obtained with stereotactic biopsy in five patients at our institution, and histopathologic confirmation of the diagnosis was performed at outside institutions in two patients.
In five of the seven cases, conventional and perfusion MR imaging examinations were performed as part of the diagnostic workup of the patient before biopsy and histologic diagnosis. In two of the seven cases, an 11-year-old boy and an 18-year-old woman, the histologic diagnosis was known, and the patient was referred to our institution for treatment. In these cases, our observations were based on images and data obtained after surgical biopsy.
The conventional MR images were evaluated for the presence or absence of contrast enhancement, necrosis, and extent of signal-intensity abnormality on T2-weighted images. Histopathologic specimens were reviewed with attention to the degree of mitotic activity and presence of vascular hyperplasia.
MR imaging was performed with a 1.5-T unit (Magnetom Vision/Symphony; Siemens Medical Systems, Iselin, NJ). A localizing sagittal T1-weighted image was obtained, followed by nonenhanced axial T1-weighted (600/14/1 [TR/TE/excitations]), intermediate-weighted (3400/17/1), and T2-weighted (3400/119/1) images. With use of the T2-weighted images to plan the dynamic acquisition, dynamic contrast material–enhanced T2*-weighted gradient-echo echo-planar images were acquired during the first pass of a standard dose (0.1 mmol/kg) bolus of gadopentetate dimeglumine (Magnevist; Berlex Laboratories, Wayne, NJ). The methods for acquiring perfusion data from a set of dynamic contrast-enhanced echo-planar images have been previously described (10).
Data processing was performed with a SPARC station 5 postprocessing workstation (Sun Microsystems, Santa Clara, CA) with analytic programs developed in-house by using C and IDL programming languages. The precise algorithm for calculating rCBV has been previously described (10). A standardized region of interest (ROI) averaging approximately 23 mm2 was used in most measurements, with some adjustments made on a case-specific basis to conform to the morphology of the lesion in question. The rCBV values were normalized to white matter because, in most cases, the region of signal intensity abnormality on T2-weighted images was mostly white matter. Ten representative ROIs were chosen on the basis of visualized areas of T2-weighted signal intensity abnormality. The mean value reported in the study was the mean value of the calculated rCBV of the data set of 10 ROIs within the abnormality. Regions of maximal abnormality were not specifically searched for. ROIs were chosen by a fellowship-level neuroradiologist (S.Y.), and results were verified for accuracy by two attending level neuroradiologists (S.W., S.C.).
Three patients, a 42-year-old man, a 21-year-old woman, and a 18-year-old woman, also underwent multivoxel MR spectroscopy, and one patient, a 75-year-old man, underwent single-voxel MR spectroscopy, and these results were reviewed. In two cases, MR spectroscopy was performed as part of the diagnostic, prebiopsy workup. In two others, the diagnosis was known and MR spectroscopy was performed as much as 2 years after biopsy.
Multivoxel 2D chemical shift imaging proton MR spectroscopy was performed after the administration of gadopentetate dimeglumine. The volume of interest (VOI) was confirmed by obtaining half-Fourier acquisition single-shot turbo-spin-echo images (15/6/1; inversion time, 500 ms). Ten sections with 5-mm section thickness were obtained in 1 minute 15 second imaging time in the axial, coronal, and sagittal planes. A volume-selective 2D chemical shift imaging sequence (1500/144/2) was used for MR spectroscopy. The hybrid multivoxel chemical shift imaging technique uses a point-resolved spectroscopy (PRESS) double spin-echo scheme for the preselection of a VOI that was usually defined to include the abnormality, as well as normal brain tissue, when possible. To prevent strong contribution to the spectra from subcutaneous fat signal, the VOI was completely enclosed within the brain and positioned at the center of the phase-encoded field of view, which was large enough to prevent wrap-around artifact. A typical VOI consisted of an 8 × 8-cm region placed within a 16 × 16-cm field of view on a 1.5–2-cm transverse section. A 16 × 16 phase-encoding matrix was used to obtain the 8 × 8 array of spectra in the VOI with an in-plane resolution of 1 × 1 cm and a voxel size of 1 × 1 × 1.5 cm or 1 × 1 × 2 cm, depending on the section thickness. The heights of selected metabolite peaks such as choline-containing compounds (Cho), total creatine (Cr), N-acetylaspartate (NAA), lactate, and lipids were estimated. The metabolite peaks were assigned as follows: Cho, 3.21 ppm; Cr, 3.04 ppm; NAA, 2.02 ppm; mobile lipids, 0.5–1.5 ppm. Lactate was identified at 1.3 ppm by its characteristic doublet that is caused by J modulation and inverted at TE of 144 ms.
Single-voxel MR spectroscopy (PRESS, TE 136 ms) was performed with a 2-cm voxel overlying a region of abnormality in the right thalamus. This same patient (75-year-old man) also underwent unilateral conventional angiography of the internal carotid artery. These images were also reviewed.
Representative Cases
Patient 4.—
A 27-year-old man with a family history of multiple sclerosis presented with a 6–8-month history of left lower extremity paresthesia. After a course of physical therapy primarily directed at symptoms in his back, his lower extremity symptoms continued to persist, and he consulted a neurologist. An MR image of the brain revealed a left frontoparietal and centrum semiovale lesion without enhancement. A low-grade neoplasm was suggested. Stereotactic biopsy of the left frontal lobe revealed a diffusely infiltrating fibrillary process, without visible mitotic activity or vascular hyperplasia, resembling gliomatosis cerebri. The patient underwent surgical resection of the lesion.
Patient 5.—
A 35-year-old woman presented to the emergency department with a several-month history of severe migraine culminating in an acute episode of migraine, vomiting, and loss of consciousness. Initial CT scans of the head demonstrated left frontal hypoattenuation, and the diagnosis of hyperacute infarct in the left anterior cerebral artery distribution was suggested. Follow-up conventional MR imaging was performed and demonstrated extensive bifrontal signal intensity abnormality on T2-weighted images without abnormal enhancement; primary glioblastoma was suggested (Fig 1). Stereotactic biopsy of the left frontal lobe was performed, and the diagnosis of infiltrating poorly differentiated glial tumor consistent with gliomatosis cerebri was made.
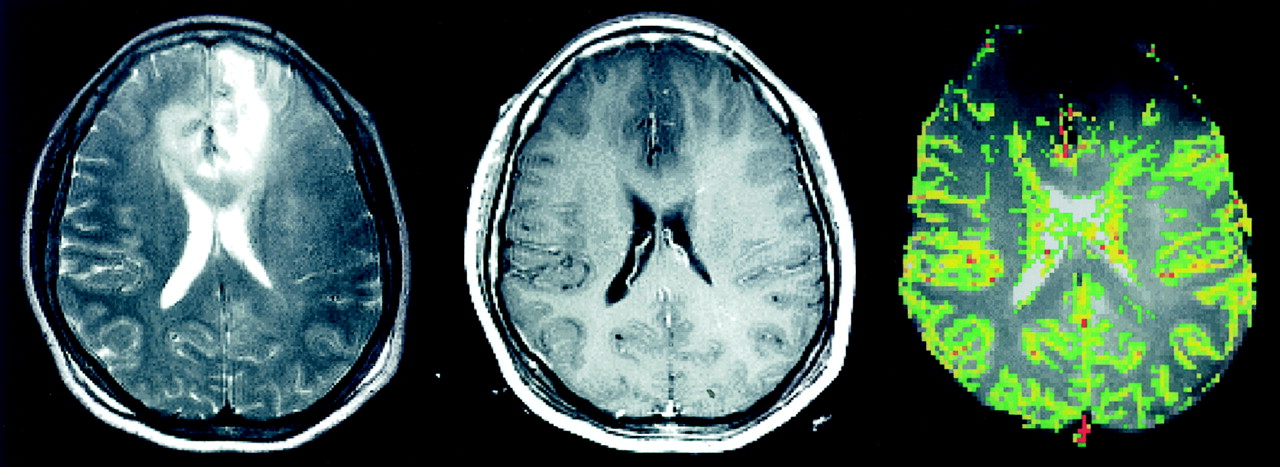
Images in a 35-year-old woman with pathologically confirmed gliomatosis cerebri.
Left, T2-weighted (3400/119) MR image demonstrates diffuse bilateral frontal signal intensity abnormality.
Middle, Contrast-enhanced axial T1-weighted (600/14) image demonstrates no evidence of contrast enhancement.
Right, Color overlay rCBV map demonstrates no evidence of increased perfusion in the region of signal intensity abnormality on the T2-weighted image.
Patient 6.—
A 42-year-old man presented with a several-month history of progressively worsening headaches, fatigue, somnolence, and deterioration in short-term memory. MR imaging of the brain revealed hydrocephalus and a diffuse T2 signal abnormality predominantly in the right hemisphere, involving the basal ganglia, frontal lobe, and thalamus, with extension into the contralateral basal ganglia (Fig 2). Stereotactic biopsy of the right hemisphere revealed a diffusely infiltrating anaplastic astrocytic process, consistent with gliomatosis cerebri.

Images in a 42-year-old man with pathologically confirmed gliomatosis cerebri.
Left, T2-weighted (3400/119) MR image demonstrates a region of signal intensity abnormality in the right periventricular white matter.
Middle, Contrast-enhanced axial T1-weighted (600/14) image demonstrates subtle evidence of contrast enhancement.
Right, Color overlay rCBV map reveals that the areas corresponding to signal intensity abnormality on the T2-weighted image do not demonstrate increased perfusion.
Patient 7.—
A 75-year-old man presented with a 3-month history of mood disturbance and depression, concentration difficulties, and a vague gait disturbance, with occasional falls. The patient initially underwent CT scanning; findings were normal. The neurologic examination revealed a mild tetraspasticity with brisk tendon reflexes. The differential diagnosis at that time was cord compression from cervical spondylosis or mass versus diffuse white matter disease. An initial MR imaging examination performed at a community imaging center revealed subtle sulcal effacement in the right hemisphere but no enhancing mass to suggest tumor. A month later, this time at a tertiary hospital, a second MR imaging examination was performed with additional spectroscopy. MR imaging revealed extensive T2-weighted signal intensity abnormality in the white matter of the right frontoparietal lobe with extension into both thalami, as well as the pons and medulla. MR spectroscopy revealed an abnormally increased Cr/Cho ratio and decreased NAA/Cr ratio. There was no abnormal lactate peak. The spectroscopic findings were considered nonspecific, and although low-grade neoplasm was suggested, the findings were considered primarily inflammatory in nature. A conventional cerebral angiogram was obtained to rule out vasculitis and was interpreted as normal. After the MR images were reviewed among several consultants, a consensus was reached: Although encephalitis was possible, the findings more likely represented low-grade neoplasm. Stereotactic biopsy was performed in the right hemisphere, and the results revealed infiltrating neoplasm consistent with gliomatosis cerebri.
Results
A summary of imaging and clinical data is presented in Table 1. Clinical findings in our series tended toward minor neurologic complaints occurring over several months, with headache being most prevalent. Two patients reported gait disturbance, two had memory deficits, and two had cranial nerve disturbances. Paresthesia was reported in one patient, and mood disturbance was found in one patient.
Perfusion characteristics of seven patients with gliomatosis cerebri
Radiologic findings were variable. Four of the seven patients had evidence of bilaterality, with extension into contralateral basal ganglia or thalami, or via the corpus callosum into adjacent frontal lobe. Although focal mass effect was observed in some cases, frank midline shift was absent. Evidence of enhancement on contrast-enhanced T1-weighted images was uncommon. All tumors showed extensive abnormality on T2-weighted images. Necrosis was not present in any of the tumors. The overall mean rCBV in the seven patients was 1.02 ± 0.42, compared with values in normal-appearing white matter.
Histopathologic analysis showed a diffusely infiltrating process with no evidence of vascular hyperplasia or necrosis in any of the specimens (Fig 3).

High-power view of histopathologic section of gliomatosis cerebri (hematoxylin-eosin with Luxol fast-blue stain, original magnification ×200). There are moderately pleomorphic glial cells in a diffusely infiltrating pattern with relative preservation of underlying cytoarchitecture. No evidence of vascular proliferation or necrosis is seen. A small collapsed vascular structure (arrow) is noted.
A summary of the multivoxel MR spectroscopic data is presented in Table 2. Three patients underwent multivoxel MR spectroscopy at variable points during their clinical course, ranging from immediately to 22 months after presentation. All had findings suggestive of tumoral disease, with a decrease in NAA and an increase in Cho metabolites within the areas of T2-weighted signal intensity abnormality (Fig 4). The mean Cho/Cr ratio was 1.86 ± 0.37 in abnormal voxels and 0.83 ± 0.15 in normal-appearing voxels, whereas the mean NAA/Cr was 0.79 ± 0.08 in abnormal voxels and 1.48 ± 0.04 in normal-appearing voxels.

Findings in a 21-year-old woman with gliomatosis cerebri.
A, Axial fluid-attenuated inversion recovery (9000/110) image with localizer (box).
B, Corresponding spectrum (chemical shift imaging, PRESS, 1500/144) reveals elevated Cho/Cr and depressed NAA/Cr ratios.
Multivoxel MR spectroscopic data in three patients with gliomatosis cerebri
Discussion
In the current World Health Organization classification of brain neoplasms, gliomatosis cerebri is included as a subgroup of neuroepithelial tumors of uncertain origin. It is characterized by diffuse overgrowth of glial elements with infiltration of at least two and sometimes three contiguous areas of brain (12). A distinction is made between gliomatosis and multicentric glioma. Gliomatosis refers to tumor with contiguous involvement of different regions, whereas mulicentric glioma is defined as distinct foci of tumor in different sites (13). Gliomatosis cerebri typically lacks features found in high-grade glial neoplasms, specifically vascular proliferation and necrosis (3, 4).
The distinction between gliomatosis cerebri and other diffuse infiltrating gliomas has been debated (14). Some believe that gliomatosis cerebri is not a distinct entity, but rather, an entity at the far end of a broad spectrum of diffuse infiltrating gliomas (15, 16). Others propose that a distinction should be made between truly diffuse lesions and those associated with a focal tumor mass; they believe that in the latter case the process should be termed diffuse glioma or secondary gliomatosis (8, 9).
The CT appeance of gliomatosis cerebri is variable, ranging from no abnormalities to widespread hypoattenuation (3, 5, 17). Shin et al (5) found MR imaging to be more sensitive than CT and described diffuse, at times bilateral, areas of high signal intensity on both proton density– and T2-weighted images. On T1-weighted images, the lesions were iso- or hypointense and demonstrated occasional focal parenchymal or meningeal enhancement (5, 7). Del Carpio–O’Donovan et al (17) also found MR imaging to be superior to CT in establishing the extent of lesions. Conventional MR images are suggestive of the diagnosis of gliomatosis when a lesion demonstrates diffuse infiltration, variable mass effect, and signal intensity abnormalities on T2-weighted images, as described above (8, 9); however, these findings are often nonspecific.
With conventional imaging techniques, the differential diagnosis of gliomatosis cerebri includes ischemic processes, demyelinating processes, encephalitis, and leukodystrohpies (5, 8, 18–20). Also, diffusely infiltrating astrocytomas can have similar features. Our conventional MR findings are consistent with past observations in the literature. All of the patients in our study had extensive regions of T2-weighted signal intensity abnormality with or without focal mass effect. In most cases, frank contrast enhancement on T1-weighted images was absent.
Our dynamic contrast-enhanced perfusion MR findings are in concordance with histopathologic findings of tumor vascularity in gliomatosis cerebri. The mean rCBV measurement in all of our cases was not elevated, compared with values in uninvolved white matter, which reflected the lack of vascular hyperplasia found at histolopathologic evaluation. Observations based on MR spectroscopy and 2-[fluorine-18]fluoro-2-deoxy-d-glucose (FDG) positron emission tomogrophy (PET) likewise nonivasively quantitate histopathologic findings. For example, Dexter et al (21), using FDG PET, demonstrated decreased FDG uptake in areas of involvement in a single patient with gliomatosis cerebri; this finding implies a low metabolic demand in affected areas. These are features more often found in a low-grade process (22).
MR spectroscopic analysis of gliomatosis cerebri was reported by Bendszus et al in 2000 (23). They observed reversal of NAA/Cho ratios. The patients in our series with complementary MR spectroscopic data had similar findings; however, we included patients who underwent imaging at variable intervals in their clinical courses. Factors such as progression of tumor grade and possible effect of treatment such as radiation or chemotherapy may influence the spectra in those patients that were imaged later in their clinical course (24).
Increased Cho levels, which suggest increased cellular turnover, have been found in both low-grade and high-grade neoplasms; however, diagnoses such as encephalitis, metabolic disturbance, or other low-grade neoplasms remain in the differential. Bendzus et al (23) suggest, however, that MR spectroscopy may be beneficial in reflecting the true extent of neoplastic infiltration, as compared with conventional imaging techniques, and that quantitative assessment of Cho/Cr and Cho/NAA ratios are important in grading tumors.
The role of perfusion MR imaging in clinical management of gliomatosis cerebri is as yet unproved, and the method remains investigational. However, we found reasonable correspondence between the rCBV and the degree or lack of microvascular angiogenesis in these lesions. The finding of normal rCBV in regions of widespread T2-weighted signal intensity abnormality may improve confidence in the diagnosis of gliomatosis cerebri, although it must be interpreted with equal weighting to the findings with conventional and other types of imaging, such as MR spectroscopy, and clinical factors. A potential use may be in monitoring for signs of malignant transformation during the treatment course (10), as secondary transformation to glioblastoma multiforme has been described (25, 26). In these limited situations, it can be a useful adjunctive tool. Prospectively, however, tissue sampling may be the only way to clinch the diagnosis.
Conclusion
Our data demonstrate that perfusion MR imaging noninvasively confirms the characteristic lack of vascular hyperplasia found in gliomatosis cerebri at histopathologic evaluation. As with FDG PET, perfusion MR imaging depicts physiologic information about tumor vascularity. FDG PET and perfusion MR imaging suggest a pathologically indolent nature, one with low metabolic and therefore low perfusion demands. In cases with widespread T2-weighted signal intensity abnormality in which the perfusion MR data demonstrate low rCBV values, the diagnosis of gliomatosis cerebri can be strongly considered.
References
- Received July 23, 2001.
- Accepted after revision October 26, 2001.
- Copyright © American Society of Neuroradiology
In this issue


Jump to section
Related Articles
Cited By...
- No citing articles found.