
Abstract
BACKGROUND AND PURPOSE: In cerebral gliomas, rCBV correlates with tumor grade and histologic findings of vascular proliferation. Moreover, ADC assesses water diffusivity and is inversely correlated with tumor grade. In the present work, we have studied whether combined rCBV and ADC values improve the diagnostic accuracy of MR imaging in the preoperative grading of gliomas.
MATERIALS AND METHODS: One hundred sixty-two patients with histopathologically confirmed diffuse gliomas underwent DWI and DSC. Mean rCBV and ADC values were compared among the tumor groups with the Student t test or ANOVA. ROC analysis was used to determine rCBV and ADC threshold values for glioma grading.
RESULTS: rCBV had significantly different values between grade II and IV gliomas and between grade III and IV tumors, but there were no significant differences between grade II and III gliomas (P > .05). Grade II and III tumors also did not differ when astrocytomas, oligodendrogliomas, and oligoastrocytomas were considered separately. ADC values were significantly different for all 3 grades. The ADC threshold value of 1.185 × 10⁻³ mm2/s and the rCBV cutoff value of 1.74 could be used with high sensitivity in the characterization of high-grade gliomas. The area under the ROC curve for the maximum rCBV and minimum ADC was 0.72 and 0.75, respectively. The combination of rCBV and ADC values increased the area under the ROC curve to 0.83.
CONCLUSIONS: ADC measurements are better than rCBV values for distinguishing the grades of gliomas. The combination of minimum ADC and maximum rCBV improves the diagnostic accuracy of glioma grading.
ABBREVIATIONS:
- DSC
- dynamic susceptibility-weighted contrast-enhanced perfusion MR imaging
- GBM
- glioblastoma multiforme
- GBM-O
- glioblastoma with oligodendroglial component
- IR
- inversion recovery
- rCBV
- relative cerebral blood volume
- ROC
- receiver operating characteristic analysis
- WHO
- World Health Organization
Gliomas are the most common primary neoplasms of the brain in adults,1,2 ranging in grade from low to high. Glioma grading is based on the histopathologic assessment of the tumor and is critical for planning therapeutic approaches and assessing prognosis and response to therapy.2 Advanced MR imaging techniques such as DSC and DWI provide physiologic information that complements the anatomic information obtained from conventional MR imaging.3⇓⇓–6 DWI quantifies cellularity on the basis of the premise that water diffusivity within the extracellular compartment is inversely related to the content and attenuation of the intracellular space.7 The higher the tumor cellularity and grade are, the lower the ADC is because of decreased water diffusivity.6⇓–8 However, other factors may be complicating this relationship: ADC increases with increased edema and increased edema is seen in high-grade tumors. DSC provides noninvasive assessment of tumor vascularity and angiogenesis3⇓⇓–6,9 through the examination of the degradation of signal intensity with time associated with the first pass of a bolus of paramagnetic contrast agent.9 Because higher vascularity corresponds to a higher tumor grade, as the grade of the astrocytoma increases, the maximum tumor CBV tends to increase.3,6,7
The aim of this study was to evaluate the diagnostic accuracy of combined ADC and CBV values in the preoperative differentiation of diffuse gliomas. Our objectives were the following: 1) to calculate CBV and ADC values for diffuse gliomas included in the study, 2) to establish whether there is any difference in rCBV and ADC values in gliomas classified by tumor grade and histology, 3) to estimate a cutoff CBV and ADC value for differentiation of high- and low-grade gliomas, and 4) to investigate whether combined CBV and ADC values improve the diagnostic accuracy of MR imaging.
Materials and Methods
Study Population and Histologic Analysis
We retrospectively reviewed data obtained during a 4-year period (December 2006–November 2010) from patients with a histopathologically proved diagnosis of diffuse glioma who underwent an MR imaging study at our hospital.
Diagnoses were histologically confirmed by surgical resection or biopsy. The tumor specimens obtained were examined by 2 experienced neuropathologists and graded as low-grade (grade II) and high-grade (grades III and IV) tumors according to the 2007 WHO Classification of Tumours of the Central Nervous System.10 Based on this classification, anaplastic oligoastrocytomas with necrosis are considered GBM-O, though some neuropathologists continue to prefer the term “grade IV oligoastrocytoma” (a term that we have used in this article).
Conventional MR Imaging
Imaging was performed with a 1.5T scanner (Signa Excite; GE Healthcare, Milwaukee, Wisconsin). We performed the following anatomic sequences: a 3-plane localizer sequence, sagittal T1-weighted with an IR technique (TR = 2400 ms, TE = 24 ms, IR = 750), axial T2-weighted fast spin-echo (TR = 4100 ms, TE = 85 ms), and FLAIR (TR = 8000 ms, TE = 120 ms, TI = 2000 ms). Postcontrast axial and coronal T1-weighted with an IR technique (TR = 2400 ms, TE = 24 ms, IR = 750) images were obtained after the acquisition of the perfusion MR imaging data. All data were obtained by using 4-mm-thick sections with a 1-mm skip, a 320 × 256 matrix, and an FOV of 24 × 24 cm.
Dynamic Contrast–Enhanced Perfusion MR Imaging
Dynamic contrast–enhanced T2*-weighted gradient-echo echo-planar images were acquired during the first pass of a bolus of gadobutrol (Gadovist, 1 mmol/mL; Berlex Laboratories, Wayne, New Jersey) at a dose of 0.1 mmol/kg. Nineteen sections were selected for perfusion MR imaging to cover the tumor on the basis of T2-weighted and FLAIR images. Imaging parameters were as follows: TR/TE = 2000/21.1 ms; FOV = 26 × 26 cm; section thickness = 4 mm with a 0.4-mm skip, a matrix of 128 × 128, and a flip angle of 90°. A series of 40 multisection acquisitions was acquired at 0.2-second intervals. The first 8 acquisitions were performed before the contrast agent was injected to establish a precontrast baseline. For the eighth acquisition, gadobutrol was injected at a rate of 5 mL/s with a power injector (Spectris Solaris EP; MedRad, Indianola, Pennsylvania) followed by administration of a 20-mL bolus of saline at 5 mL/s. Immediately before dynamic imaging, a prebolus dose (2 mL)11 of gadobutrol was administered to diminish any T1 effects that might result from agent extravasation.
DWI
DWI was performed before administration of contrast medium by using a single-shot spin-echo echo-planar imaging sequence with the following parameters: TR/TE = 8000/78.2 ms, image acquisition in the axial plane, 5-mm contiguous sections, number of sections = 26, FOV = 26 × 26 cm, acquisition matrix = 128 × 128, b-values of 0 and 1000 s/mm2, diffusion gradient encoding in 6 orthogonal directions, and a total scanning time of 1 minute 4 seconds.
Perfusion MR Imaging Data Evaluation
DSC images were processed on an Advantage Workstation by using FuncTool (GE Healthcare).
The beginning and the end of the first-pass bolus were determined through inspection of the time–signal-intensity curve and care was taken to exclude any recirculation-related signal intensity. Cerebral blood volume refers to the amount of blood in a given region of brain tissue at any time, commonly measured in milliliters per 100 g of brain tissue. Because the CBV must be expressed relative to an internal reference, we normalized it by expressing ratios relative to values measured in the normal white matter of the contralateral lobe. We have referred to these relative values as rCBV.
Color-coded rCBV maps were generated to target regions of maximum abnormality. Two neuroradiologists placed 3 ROIs within the tumor, on areas showing the highest intratumoral rCBV on the color-coded maps. The standardized ROI was 2–3 mm2, which was used for most of the tumor and white matter measurements. Care was taken not to include large intra- or peritumoral vessels because these can confound perfusion measurements. The maximum rCBV value in intratumoral ROIs was selected for quantitative analysis and correlated with corresponding specimen histopathology. This method has been demonstrated to provide the most optimal interobserver and intraobserver reproducibility.12
DWI Data Evaluation
ADC maps and values were calculated by using commercially available FuncTool software with the ROIs.
Five circular ROIs (areas ranging from 1 to 2 mm2) were manually constructed by each neuroradiologist and placed over the whole tumor to select the region of the maximum hypointensity corresponding to the solid portion of tumor. Afterward, the minimum ADC obtained was selected for the analysis (Fig 1). ROIs values were expressed as 10−3 mm2/s. The ROIs were carefully placed to avoid cystic, necrotic, and hemorrhagic regions that might influence ADC values.

A 62-year-old man with biopsy-proved grade IV glioma. An example of how the ROIs in which minimum ADC (A) and maximum rCBV (B) have been measured is provided.
Statistical Analysis
An Access data base (Microsoft, Redmond, Washington) was created to track maximum rCBV, minimum ADC, and tumor grade of diffuse gliomas. Using the Statistical Package for the Social Sciences Version 12 software (SPSS, Chicago, Illinois), we performed statistical analysis. Normality of distribution for all variables was determined by the Kolmogorov-Smirnov test. Mean rCBV and ADC values were compared among the tumor groups with the Student t test or ANOVA. A P value <.05 indicated a statistically significant difference. An ROC curve analysis was obtained to determine the cutoff rCBV and ADC values that had the best combination of specificity and sensitivity for differentiating high- and low-grade gliomas. In the ROC curve, the size of the area under the curve indicated the degree of the relationship between rCBV or ADC values and the grade of the gliomas: the closer to 1, the stronger the relationship.
Results
Patient Population
The group consisted of 162 patients (97 men and 65 women), with ages ranging from 23 to 79 years. We investigated 32 low-grade (19.8%) and 130 high-grade gliomas (80.2%). Among high-grade tumors, 17.9% were diagnosed as grade III and 62.3% as grade IV. In regard to the histologic types, we included 119 astrocytomas, 27 oligodendrogliomas, and 16 oligoastrocytomas. The histopathologic diagnoses are presented in Table 1.
Histopathologic diagnosis distributed by tumor grade
Evaluation of rCBV Values for Glioma Grading
In the high-grade gliomas, the maximum rCBV ranged between 0.87 and 14.60 (mean, 6.87 ± 3.10). In the low-grade-glioma group, rCBV values ranged between 0.85 and 7.02 (mean, 2.36 ± 1.44). rCBV measurements were significantly effective in grading glial tumors as low-grade and high-grade (P < .001).
If we consider grade II, III, and IV gliomas separately, rCBV values (mean) were 2.36 ± 1.44; 3.77 ± 2.82; and 6.87 ± 3.10, respectively. Although some overlap of distribution was shown between the values of the 3 groups, rCBV values were statistically different between grade II and grade IV gliomas (P < .001) and between grade III and IV gliomas (P < .001). However, there were no statistically significant differences between grade II and grade III gliomas (P = .157).
When only astrocytic tumors were considered, the rCBV values (mean) had statistically significant differences between high-grade (6.50 ± 3.28) and low-grade tumors (2.11 ± 1.58) (P < .001). If we investigated grade II, III, and IV astrocytomas separately, rCBV values were 2.11 ± 1.58; 2.15 ± 0.71; and 6.92 ± 3.12, respectively. rCBV values were significantly different between grade II and grade IV astrocytomas (P < .001) and between grade III and grade IV tumors (P < .001). However, rCBV values were not significantly different between grade II and grade III astrocytomas either (P = 1).
In the oligodendroglioma group, rCBV values (mean) were not significantly different between high-grade (4.36 ± 2.80) and low-grade tumors (2.98 ± 1.30) (P = .286).
In oligoastrocytomas, rCBV values (mean) showed statistically significant differences between high-grade (6.05 ± 3.44) and low-grade tumors (1.98 ± 0.63) (P = .03). When we analyzed grade II, III, and IV oligoastrocytomas individually, rCBV values were 1.98 ± 0.63; 5.30 ± 4.34; and 6.30 ± 2.97, respectively. There were no statistically significant differences between grade II and III (P = .573), between grade II and IV (P = .120), or between grade III and IV oligoastrocytomas (P = 1).
When we compared grade II astrocytomas, oligodendrogliomas, and oligoastrocytomas individually, rCBV values (mean) were 2.11 ± 1.58; 2.98 ± 1.30; and 1.98 ± 0.63, respectively. There were no statistically significant differences in the rCBV values between astrocytomas and oligodendrogliomas (P = .391), between astrocytomas and oligoastrocytomas (P = 1), or between oligodendrogliomas and oligoastrocytomas (P = .733).
We also separated grade III gliomas into astrocytomas, oligodendrogliomas, and oligoastrocytomas. rCBV values (mean) were 2.15 ± 0.71; 4.36 ± 2.80; and 5.30 ± 4.034, respectively. There were no statistically significant differences in the rCBV values between astrocytomas and oligoastrocytomas (P = .267), between oligodendrogliomas and oligoastrocytomas (P = 1), or between astrocytomas and oligodendrogliomas (P = .167).
On investigating grade IV astrocytomas and oligoastrocytomas, rCBV values (mean) were 6.92 ± 3.12 and 6.30 ± 2.97, respectively. Grade IV astrocytomas and grade IV oligoastrocytomas showed no statistically significant differences in rCBV values (P = .698) (Fig 2).

Boxplots show the range of maximum rCBV values determined by using DSC perfusion imaging in 162 patients with diffuse gliomas distributed by tumor histology and grade. The box represents the interquartile range (ie, 25%–75%); and black bar, the median. Th perfusion difference between grade II and III tumors was not statistically significant.
Evaluation of ADC Values for Tumor Grades
The ADC values (mean) of solid tumor portions of the high- and low-grade gliomas were 0.7523 ± 0.135 (× 10−3 mm2/s) and 1.2160 ± 0.274 (× 10−3 mm2/s), respectively. Minimum ADC values were significantly correlated in the discrimination of low- and high-grade gliomas (P < .001).
When grade II, III, and IV gliomas were separated, ADC values (mean) were 1.2160 ± 0.274 (× 10−3 mm2/s), 0.9707 ± 0.228 (× 10−3 mm2/s), and 0.7472 ± 0.131 (× 10−3 mm2/s), respectively. As we found in perfusion data analysis, some overlap of distribution was shown between the ADC values of grade II, III, and IV gliomas. Nevertheless, the difference in minimum ADC values was statistically significant among all 3 grades (P < .001).
When only astrocytomas were evaluated, ADC values (mean) were significantly different between high-grade [0.7750 ± 0.1779 (× 10−3 mm2/s)] and low-grade tumors [1.2731 ± 0.293 (× 10−3 mm2/s)] (P < .001). When grade II, III, and IV astrocytomas were studied separately, ADC values were 1.2731 ± 0.293 (× 10−3 mm2/s), 1.0673 ± 0.276 (× 10−3 mm2/s), and 0.7456 ± 0.135 (× 10−3 mm2/s), respectively. ADC values were significantly different between grade II and III astrocytomas (P = .019), between grade III and grade IV tumors (P < .001), and between grade III and IV astrocytomas (P < .001).
When we considered only oligodendroglial tumors, ADC values (mean) were not significantly different between high-grade [0.9326 ± 0.199 (× 10−3 mm2/s)] and low-grade tumors [1.0827 ± 0.195 (× 10−3 mm2/s)] (P = .135).
In oligoastrocytomas, ADC values (mean) showed statistically significant differences between high-grade [0.7803 ± 0.759 (× 10−3 mm2/s)] and low-grade tumors [1.2925 ± 0.300 (× 10−3 mm2/s)] (P = .002). When grade II, III, and IV oligoastrocytomas were analyzed separately, ADC values were 1.2925 ± 0.300 (× 10−3 mm2/s), 0.8410 ± 0.367 (× 10−3 mm2/s), and 0.7651 ± 0.768 (× 10−3 mm2/s), respectively. The ADC values were significantly different between grades II and III (P = .031) and between grades II and IV (P = .001). No statistically significant difference was found between the ADC values of grade III and IV oligoastrocytomas (P = 1).
We also studied grade II gliomas in astrocytomas, oligodendrogliomas, and oligoastrocytomas separately. ADC values (mean) were 1.2731 ± 0.293 (× 10−3 mm2/s), 1.0827 ± 0.195 (× 10−3 mm2/s), and 1.2925 ± 0.300 (× 10−3 mm2/s), respectively. There were no statistically significant differences in the ADC values between astrocytomas and oligodendrogliomas (P = .246), between astrocytomas and oligoastrocytomas (P = 1), or between oligodendrogliomas and oligoastrocytomas (P = .587).
When we compared grade III astrocytomas, oligodendrogliomas, and oligoastrocytomas separately, ADC values (mean) were 1.0673 ± 0.276 (× 10−3 mm2/s), 0.9326 ± 0.199 (× 10−3 mm2/s), and 0.8410 ± 0.367 (× 10−3 mm2/s), respectively. No statistically significant differences were found between the ADC values of astrocytomas and oligoastrocytomas (P = .630), between oligodendrogliomas and oligoastrocytomas (P = 1), or between astrocytomas and oligodendrogliomas (P = .490).
When grade IV astrocytomas and oligoastrocytomas were investigated, the ADC values (mean) were 0.7456 ± 0.135 (× 10−3 mm2/s) and 0.7651 ± 0.768 (× 10−3 mm2/s), respectively. Grade IV astrocytomas and grade IV oligoastrocytomas did not show any statistically significant differences in ADC values (P = .555) (Fig 3).

Boxplots show the range of minimum ADC values of 162 diffuse gliomas distributed by tumor histology and grade. The box represents the interquartile range (ie, 25%–75%); and the black bar, the median. Differences in minimum ADC values were statistically significant among grade II, III, and IV gliomas (P < .001). However, if we consider astrocytomas, oligodendrogliomas, and oligoastrocytomas separately, grades II and III oligodendrogliomas and grades III and IV oligoastrocytomas were not significantly different in ADC values.
Table 2 summarizes minimum ADC values and maximum rCBV values of different tumor types and grades.
Minimum ADC and maximum rCBV values of different tumor types and grades
Combination of rCBV and ADC Values in the Grading of Gliomas
According to the ROC curves, the rCBV cutoff value of 1.74 showed high sensitivity (100%) in the characterization of high-grade gliomas.
The ADC threshold value of 1.185 × 10⁻³ mm2/s generated the best combination of sensitivity (97.6%) and specificity (53.1%) in the discrimination of high- and low-grade gliomas.
If we want to study the data obtained by the combination of perfusion and diffusion MR imaging, ADC and rCBV values should be considered as dichotomic variables. In that setting, the area under the ROC curve was 0.72 and 0.75 for the maximum rCBV and minimum ADC, respectively. Combination of rCBV and ADC values increased the area under the ROC curve to 0.83 (Fig 4).
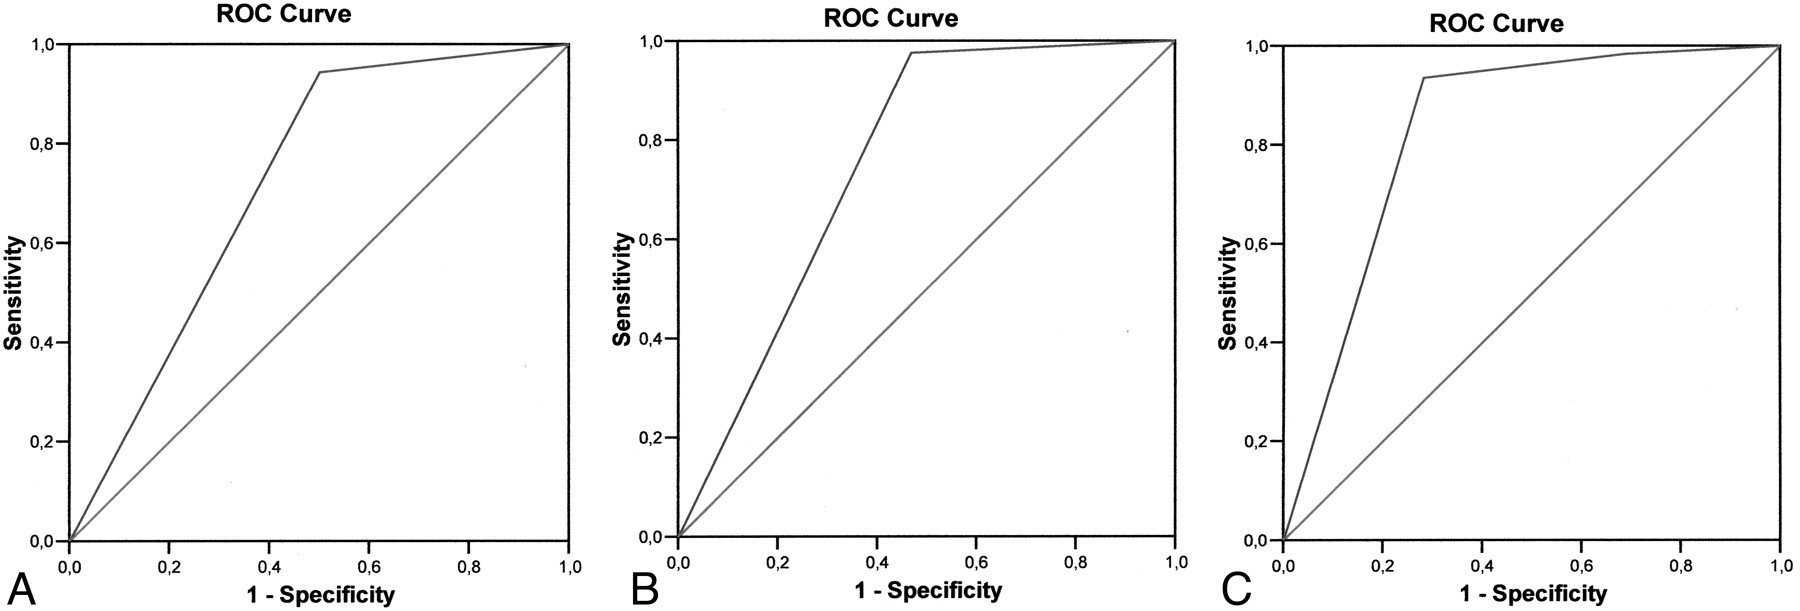
ROC curve analysis showing the effect of using rCBV (A) and ADC (B) as individual or combined (C) variables in differentiating high- and low-grade gliomas. The area under the ROC curve for the maximum rCBV, minimum ADC, and a combination of both parameters is 0.72; 0.75; and 0.83, respectively.
Table 3 represents the sensitivity, specificity, positive predictive value, and negative predictive value for CBV, ADC, and their combination in the differentiation of high-grade from low-grade gliomas.
Sensitivity, specificity, PPV, and NPV for rCBV, ADC, and their combination in the differentiation of high-grade from low-grade gliomas
Discussion
Accurate grading of gliomas is of utmost importance because the therapeutic approach and prognosis differ considerably according to tumor grade.5,13 Whereas conventional MR imaging provides information on contrast enhancement, mass effect, edema, and necrosis, it is not always accurate for the precise grading of gliomas.5
Although previous studies have suggested that contrast enhancement alone is not sufficient to predict tumor grade14 because some low-grade gliomas demonstrate contrast enhancement while some high-grade tumors do not,13,15 the extent of contrast enhancement has been traditionally used as a mark of malignancy.13,16
Advanced MR imaging techniques such as perfusion and diffusion MR imaging have demonstrated utility for the assessment of brain tumors.5 Thus, MR imaging perfusion methods allow the creation of CBV maps that are potentially useful in the characterization of gliomas because tumor aggressiveness and growth are associated with endothelial neovascularization. rCBV measurements correlate with tumor grade and histologic findings of increased vascularity of the tumor.5,16,17 Previous studies published between 1999 and 2005 (n = ≤33 patients)2,14,18,19 found a range of rCBV values from 1.11 to 1.69 and from 3.64 to 7.32 in low-grade and high-grade gliomas, respectively. These values are comparable with our findings in our series of 162 patients, with mean rCBV values of 6.85 and 2.36 for high-grade and low-grade gliomas, respectively.
Several studies4,5,20,21 have found statistically significant discrimination between high-grade and low-grade gliomas. Our findings are in agreement with these results, demonstrating significant differences (P < .001) in the rCBV values between high- and low-grade tumors. We have also found that rCBV values were statistically different (P < .001) between grade II and IV gliomas and between grade III and IV gliomas. These results differ from those published by Hakyemez et al,2 in which no statistically significant difference between grades III and IV was demonstrated (P > .05, n = 33). An explanation of the differences in the interpretation between the 2 studies could be the variations in the number of patients included in the studies (162 versus 33). Even more, our results support histologic findings that most grade III gliomas differ from grade IV tumors by the presence of microvascular proliferation.
We could not demonstrate significant differences between grade II and grade III gliomas (P = .295). This finding is in accordance with the fact that most intermediate, or grade III, tumors lack microvascular proliferation in histopathologic studies and are quite similar to grade II gliomas in the perfusion analysis. Grade II and III tumors were also not significantly different when astrocytomas, oligodendrogliomas, and oligoastrocytomas were considered separately. In 2004, Lev et al22 stated that grade II oligodendrogliomas have greater rCBV values than grade II astrocytomas. Although no significant differences have been demonstrated in our series between grade II astrocytomas and oligodendrogliomas, the rCBV oligodendroglioma values tended to be superior to the astrocytoma ones.
Similar series published in 1999 and 2005 by Lev and Rosen23 and Hakyemez et al2 found a sensitivity of 100% in discriminating the high- and low-grade tumors with the use of 1.5 and 2 as a rCBV threshold value, respectively. A large series (n = 73) published in 2004 by Law et al20 found an rCBV threshold value of 1.75 with a sensitivity of 95% and specificity of 57.5%. In our study of 162 gliomas, we found similar results to those of Law et al20 (sensitivity, 94.4%; specificity, 50%) by using a cutoff value of 1.74. Our results are also in agreement with those published by Lev et al22 and show us that as the threshold level is lowered, the specificity is decreased and some low-grade gliomas are falsely identified as high-grade and will be treated more aggressively.2 In our group of patients, on the other hand, sensitivity decreased to 91.2% when the rCBV cutoff value was increased to 3.29. These results are in agreement with those published by Shin et al,24 who reported 91% sensitivity and 83% specificity for a cutoff value of 2.9 in a group of 17 gliomas. With these cutoff values, some high-grade gliomas would be misidentified as low-grade tumors and would be treated conservatively, resulting in a potentially rapid death.2
Some authors25 suggested that quantitative perfusion imaging predicts tumor biologic activity and survival better than histopathologic grade does. In our study, 8 patients with biopsy-proved grade II tumors showed increased rCBV, suggesting a higher grade than the one proposed from the pathology study. Clinical worsening at short-term follow-up between 3 and 9 months, combined with a new histologic analysis, confirmed the diagnosis of high-grade tumors proposed on the initial perfusion imaging. We are in agreement with the above argument that DSC can be used to predict clinical outcome in patients with low-grade gliomas, independent of pathologic findings.
DWI allows assessing the cellularity of tumors in a noninvasive form because cellular and subcellular elements impede water mobility26 and quantitative information from the restriction of water molecule movement can be observed in calculating the ADC.13,27⇓–29 Thus, brain neoplasms with higher cellularity or with a higher grade show a significant reduction in ADC values.18,27 In our series of 162 diffuse gliomas, we found a significant difference in the minimum ADC value for differentiating the low- and high-grade gliomas (P < .001). These findings are similar to those reported previously by Lee et al (n = 16),13 Kono et al (n = 17),27 and Calli et al (n = 31),30 with high-grade gliomas showing a significant reduction in ADC values and increased signal intensity on DWI. Our findings also agree with those demonstrated by Yamasaki et al.28 This similarity suggests an inverse relationship between ADC and glial tumors of WHO grades II–IV.
Most of the published studies to date have evaluated the diffusion properties in high- and low-grade gliomas. We have gone one step further and have studied the ADC values in the gliomas classified by grade and histology. Similar to the data previously published by Yang et al31 in a small series of 17 patients, we have demonstrated, in a larger series (n = 162), that the difference in minimum ADC values was statistically significant among all 3 grades of gliomas and astrocytomas (P < .001). According to this, ADC measurements are better than rCBV values in distinguishing the grades of gliomas and astrocytic tumors. However, we did not find differences among the tumor grades when there was an oligodendroglial component.
In our experience, the mean ADC value was 0.7523 ± 0.135 × 10⁻³ mm2/s for grade IV gliomas and lower than ADC values published by Stadnik et al32 and Sugahara et al (n = 20),18 who reported mean ADC values of 1.14 × 10⁻³ mm2/s and 1.2 ± 0.4 × 10⁻³ mm2/s, respectively. The reason for our lower ADC values may be that we always sampled the minimum ADC value from the solid portion of the tumor. The cutoff value of 1.185 × 10⁻³ mm2/s for the minimum ADC generated the best combination of sensitivity (97.6%) and specificity (53.1%) in the discrimination of high- and low-grade gliomas.
In the present study, we were interested in determining whether combined data from rCBV and ADC values could improve the diagnostic accuracy of perfusion and diffusion alone. This is the first work that studies the combination of DWI and perfusion MR imaging as a diagnostic tool in the presurgical evaluation of gliomas in a large series of patients. Our results show that the area under the ROC curve for the maximum rCBV was 0.72 and for the minimum ADC, 0.75. According to these results, the classification accuracy based on minimum ADC was higher than that based on maximum rCBV. When we combined both rCBV and ADC values, the area under the ROC curve increased to 0.83. Hence, we may conclude that the combination of ADC and rCBV values increases the diagnostic accuracy of MR imaging in the preoperative grading of gliomas. Kim and Kim17 also found an adjunctive value of perfusion MR imaging (pulsed arterial spin-labeling) and ADC scoring in the glioma grading compared with conventional images alone. However, there have been few reports of the simultaneous use of perfusion and diffusion imaging in glioma grading, and further studies will be needed.
There are some limitations to our study. First, stereotactic biopsies were not targeted by rCBV or ADC maps. Second, there is the possibility of histopathologic misdiagnosis attributable to sampling error in the pathologic examination because of the histologic heterogeneity of tumor tissues. It is widely known that a given individual glioma, usually of high grade, often contains a continuum of histologic features of grades II-IV and tumor grading is dependent on the site of tumor biopsy or resection and thus subject to sampling error or undersampling. Third, the group studied was heterogeneous in that we included grade II through IV astrocytomas and oligodendroglial tumors. However, our results did not change when astrocytic and oligodendroglial tumors were evaluated separately.
Conclusion
Our results in a series of 162 patients with diffuse gliomas show that ADC and rCBV maps can serve as a noninvasive method of approximating tumor grade. We have demonstrated that ADC measurements are better than rCBV values in distinguishing the grades of glioma. Although further studies will be needed to confirm the utility of combined diffusion-weighted and perfusion MR imaging, our results also suggest that the combination of minimum ADC and maximum rCBV improves the diagnostic accuracy of MR imaging in the preoperative determination of glioma grade.
Footnotes
-
Paper previously presented at: Annual Meeting of the American Society of Neuroradiology, June 4–9, 2011; Seattle, Washington.
-
This study was partially supported by grant PS09/01977 from the Spanish Subdirección General de Evaluación y Fomento de la Investigación (Dr. Ricoy).
-
Disclosures: José Ricoy—RELATED: Grant: Health Research Fund PS09/01977.
Indicates open access to non-subscribers at www.ajnr.org
References
- Received May 12, 2011.
- Accepted after revision July 20, 2011.
- © 2012 by American Journal of Neuroradiology
In this issue


Jump to section
Related Articles
Cited By...
- Utility of Early Postoperative DWI to Assess the Extent of Resection of Adult-Type World Health Organization Grade 2 and 3 Diffuse Gliomas
- Differentiating Low-Grade from High-Grade Intracranial Ependymomas: Comparison of Dynamic Contrast-Enhanced MRI and Diffusion-Weighted Imaging
- Utilizing the Amide Proton Transfer Technique to Characterize Diffuse Gliomas Based on the WHO 2021 Classification of CNS Tumors
- Regional and Volumetric Parameters for Diffusion-Weighted WHO Grade II and III Glioma Genotyping: A Method Comparison
- High-Grade Gliomas in Children with Neurofibromatosis Type 1: Literature Review and Illustrative Cases
- Predicting Genotype and Survival in Glioma Using Standard Clinical MR Imaging Apparent Diffusion Coefficient Images: A Pilot Study from The Cancer Genome Atlas
- 3D Pseudocontinuous Arterial Spin-Labeling MR Imaging in the Preoperative Evaluation of Gliomas
- Discrimination between Glioma Grades II and III Using Dynamic Susceptibility Perfusion MRI: A Meta-Analysis
- Comparison of the Effect of Vessel Size Imaging and Cerebral Blood Volume Derived from Perfusion MR Imaging on Glioma Grading
- Mean Diffusional Kurtosis in Patients with Glioma: Initial Results with a Fast Imaging Method in a Clinical Setting
- Diffusion-Weighted Imaging in Cancer: Physical Foundations and Applications of Restriction Spectrum Imaging
- A Prognostic Model Based on Preoperative MRI Predicts Overall Survival in Patients with Diffuse Gliomas
- Multimodal MR Imaging (Diffusion, Perfusion, and Spectroscopy): Is It Possible to Distinguish Oligodendroglial Tumor Grade and 1p/19q Codeletion in the Pretherapeutic Diagnosis?