
Abstract
BACKGROUND AND PURPOSE: Advanced MR imaging techniques are critical to understanding the pathophysiology of conditions involving the spinal cord. We provide a novel, quantitative solution to map vertebral and spinal cord levels accounting for anatomic variability within the human spinal cord. For the first time, we report a population distribution of the segmental anatomy of the cervical spinal cord that has direct implications for the interpretation of advanced imaging studies most often conducted across groups of subjects.
MATERIALS AND METHODS: Twenty healthy volunteers underwent a T2-weighted, 3T MRI of the cervical spinal cord. Two experts marked the C3–C8 cervical nerve rootlets, C3–C7 vertebral bodies, and pontomedullary junction. A semiautomated algorithm was used to locate the centerline of the spinal cord and measure rostral-caudal distances from a fixed point in the brain stem, the pontomedullary junction, to each of the spinal rootlets and vertebral bodies. Distances to each location were compared across subjects. Six volunteers had 2 additional scans in neck flexion and extension to measure the effects of patient positioning in the scanner.
RESULTS: We demonstrated that substantial variation exists in the rostral-caudal position of spinal cord segments among individuals and that prior methods of predicting spinal segments are imprecise. We also show that neck flexion or extension has little effect on the relative location of vertebral-versus-spinal levels.
CONCLUSIONS: Accounting for spinal level variation is lacking in existing imaging studies. Future studies should account for this variation for accurate interpretation of the neuroanatomic origin of acquired MR signals.
ABBREVIATION:
- PMJ
- pontomedullary junction
Advanced MR imaging techniques of the human spinal cord are critical to understanding the pathophysiology of conditions such as traumatic injury, degenerative spondylosis, or neuroinflammatory conditions such as multiple sclerosis. These techniques provide the opportunity to assess subclinical changes in spinal cord structure and function. For example, diffusion tensor imaging and magnetization transfer can be used to follow the integrity of white matter tracts in specific regions of the human spinal cord1; fMRI can be used to track the spinal response to a particular stimulus, reflecting the integrity of specific functional circuits.2 Recently, the microstructure of the corticospinal motor pathway was mapped; imaging characteristics of this map correlated with clinical function.3 The ultimate goal of early detection of subclinical recovery or deterioration should be to personalize treatment strategies in both the acute and chronic phases of injury.
A prerequisite to accurate interpretation of advanced imaging data is appreciating the neuroanatomic origin of the acquired signal. An imaging atlas brings prior spatial knowledge to an imaging dataset. Advanced brain imaging has benefited from the design and improvement of brain atlases that allow registration of various functional and structural imaging studies.4,5 Atlases of the spinal cord are not as developed. Despite recent initiatives for creating a generic template of the spinal cord,6 most previous templates have been created by individual research groups to meet the objectives of specific studies. For example, manually segmented templates have been created on the basis of specific anatomic information of the nerve rootlet position.2 Perhaps most common is to infer neuroanatomic positions within the spinal cord by counting the adjacent vertebral bodies and stating that, for example, the C6 spinal cord segment is adjacent to the C5 vertebral body.7 This latter approach coincides with widely accepted neuroanatomy textbooks, but the error associated with vertebral body measurements to predict the immediate caudal spinal cord segment has not been investigated. The diversity of human anatomy offers 2 principal sources of variability: 1) intersubject differences in spinal column anatomy, and 2) intersubject differences in spinal cord segments relative to a fixed point in the brain stem. The work presented here considers these 2 sources of diversity across a cohort of healthy individuals and presents a unique solution, a “spinal level map,” which can be applied in advanced MR imaging assessment of the human cervical cord.
In this work, we impart a neuroanatomic context to single-subject high-resolution images of the cervical spine by delineating the location of vertebral bodies and spinal cord segments down the central axis of the spinal cord. Thus, we account for the personal anatomy of single subjects. Using expert markings as ground truth data, we report the distribution of vertebral and spinal cord segments across our cohort of 20 subjects. To the best of our knowledge, this is the first article that presents a quantitative, accurate solution to delineate the anatomic variability of the human cervical spinal cord. We anticipate that this approach will dramatically enhance the accuracy of quantitative MR imaging–based assessment of the normal and diseased spinal cord.
Materials and Methods
Study Design
In this work, we investigated 20 healthy volunteers (7 men; mean age, 30.5 years; range, 19–52 years) to delineate the segmental structural anatomy of the human cervical spine. We describe the spatial relationships of both intrasubject segmental anatomy and intersubject differences in relative anatomic locations. Informed consent was obtained in all cases, and approval to conduct this work was granted by our institutional ethics review board. Demographic information of participants is listed in Table 1.
Demographic information of study participants
MR Imaging Acquisition
All imaging data were acquired on a 3T HDx MR imaging system (GE Healthcare, Milwaukee, Wisconsin) at the Toronto Western Hospital by using an 8-channel neurovascular array coil. Subjects were carefully positioned to limit head movement and were requested not to move. A T2-weighted acquisition was obtained to optimize visualization of cervical nerve rootlets emerging from the spinal cord in a segmental fashion. We used a FIESTA-C sequence (T2-weighted): matrix, 512 × 512; NEX, 1.0; FOV, 200 mm; section thickness, 0.3 mm resulting in a voxel size of 0.3906 × 0.3906 × 0.3000 mm, without interpolation, collected in the coronal plane. Total scanning time was approximately 12 minutes.
In a subset of individuals (n = 6), we acquired 3 volumes: 1 in a neutral position, 1 in neck flexion, and 1 in neck extension. Although neck flexion and extension are limited within the confines of the imaging environment, we obtained roughly 6°–10° of either flexion or extension by placing extra padding under the occiput (neck flexion) or under the shoulders (neck extension). This range represents the normal positions that one might expect in the imaging environment.
Measurements along the Spinal Cord Axis
To accurately measure distances from a common point in the brain stem, the pontomedullary junction (PMJ), to any set of nerve rootlets or vertebrae along the spinal cord, we used custom algorithms written in the Python language. First, the centerline of the cord was estimated by using manual markings in 3DSlicer (http://www.slicer.org/). These points were used as the initial control points of a Catmull-Rom spline, representing the centerline of the spinal cord.8 A 2D template-matching algorithm, by using ground truth data from several manually segmented spinal cord images, was used to segment the cervical spinal cord. The segmented volume was then used to determine a more precise centerline, which became new control points for the spline. Using the adjusted/centered spline, we identified the center point of the spinal cord at all distances from the PMJ to the lower cervical spinal cord, caudal to the C8 spinal cord segment, yielding the spinal cord centerline. Using this centerline, we then defined the arc-length axis of each individual's spinal cord and used this axis to perform measurements. Briefly, the arc-length axis can be defined as the longitudinal distance from the pontomedullary junction down the spinal cord. This reference system is unique in that it avoids the use of a Cartesian (x, y, z) coordinate system, which would be less accurate in defining distances down the spinal cord, given the variation in spinal curvature across individuals. The generation of this arc-length central spinal cord axis is illustrated in Fig 1.

Results of spinal cord centerline extraction in 1 subject. The red line represents the spinal cord centerline. Distance from the PMJ is calculated along this centerline (z, in millimeters), for measuring the absolute location of the vertebral and spinal levels.
Nerve Rootlet and Vertebral Body Localization
We used the C3 through C8 spinal nerve rootlets as a surrogate marker for the segmental anatomy of the spinal cord in an individual subject. To determine the distance from the PMJ to each set of spinal nerve rootlets, 2 individuals with specialized knowledge of spinal cord anatomy manually marked the dorsal nerve rootlets of segments C3–C8 at the edge of the spinal cord where the rootlets meet the CSF by using 3DSlicer. To perform these markings, we visualized the spinal cord and cervical nerve rootlets in 3 planes (axial, sagittal, and coronal) and followed these nerve rootlets as they transition into cervical nerve roots and traverse the respective intervertebral foramen. For example, the C3 nerve rootlets transition into the C3 nerve root and emerge through the intervertebral foramen between the C2 and C3 vertebrae. After we confirmed that specific nerve rootlets had transitioned from a specific nerve root, individual dorsal nerve rootlets were marked in 3DSlicer. The most rostral and caudal extents of the C3–C7 vertebral bodies were also marked on a midsagittal section of each subject. The selected nerve rootlet and vertebrae points were then projected onto the spinal cord centerline by orthogonal projection at the midpoint of the rostral and caudal extents of either structure. A combination of MR images and artist illustration is used in Fig 2 to show how these markings were performed.

From left to right: T2-weighted MR image with the PMJ and superior (Sup.) and inferior (inf.) endplates of the C3 vertebral body marked with dashed white lines. Immediately adjacent to this, an artist's illustration demonstrates how person-specific markings are positioned relative to the individualized arc-length axis of the spinal cord (red line). Thus, distances can be compared across individuals along their personalized spinal cord axes. The T2-weighted coronal image depicts spinal rootlets (A) and the gap between adjacent segmental rootlets (B), delineated by dashed white lines. The far right artist's illustration depicts segmental rootlets and the formation of a spinal nerve root that emerges from the intervertebral foramen. To accurately localize segmental nerve rootlets, we followed the spinal nerve root that emerges from the intervertebral foramen of the respective vertebral body.
Interobserver Reproducibility in Identifying Cervical Nerve Rootlets and Vertebral Bodies
The interobserver reliability of both nerve rootlet and vertebral body measurements was assessed by obtaining the intraclass correlation coefficient values comparing the assessments of 2 independent observers. These coefficients were obtained by using a 2-way mixed-effects model in the SPSS statistics package, Version 21 (IBM, Armonk, New York).
Are Vertebral Bodies a Reliable Surrogate Marker for Spinal Cord Segments?
To determine whether vertebral bodies are a reliable surrogate marker for spinal cord segments, we determined the amount of overlap between the 2. This was accomplished by determining the most rostral and caudal distances of the vertebrae and spinal cord segment in question, relative to the PMJ, and calculating the percentage of the spinal cord segment that falls within the vertebral segment area. For example, for 1 subject, the C6 vertebral body lies at a distance between 116 and 128 mm from the PMJ. The C7 spinal cord segment for the same individual lies between 110 and 118 mm from the PMJ. The overlap in this case is 2 mm at the rostral end of the vertebrae and caudal end of the spinal cord segment. The percentage overlap is calculated as overlap divided by the total length of the vertebral body, in this case 2/12 mm, or 17%.
Does Patient Positioning within the MR Imaging Environment Exacerbate Differences between Vertebral and Spinal Cord Segments?
Patient positioning for neck flexion and extension is described above. To calculate the degree of neck flexion or extension, we compared the tangent of the spinal cord in the sagittal plane at 2 points along the spinal cord. In previous work, the angle was measured as the difference in vertebrae angles at C2 and C7.9,10 The angle between these 2 vertebrae is calculated by drawing a line parallel to the posterior edge of the vertebral body, which runs parallel to the spinal cord, and calculating the angle between those 2 lines.
Our method uses the spinal cord axis of each subject to measure these angles rather than relying on manually drawing parallel lines. We measured the angle of the tangent of the spinal cord axis at all locations relative to an imaginary horizontal line that lies across the sagittal plane. By subtracting any of these 2 points at different locations along the spinal cord, we are able to attain the relative angle.
To determine whether patient positioning within the MR imaging environment (slight neck flexion or extension) has an effect on the discrepancy between vertebral and spinal cord segments, we compared this discrepancy across neutral, flexion, and extension conditions. Vertebral-spinal discrepancy is defined as the difference between the midpoint of a given spinal and vertebral segment along the arc length of the spinal cord axis, reported in millimeters. Taken alone, this measurement is expected to vary across both segmental level and subject. However, if neck flexion or extension has no effect on the discrepancy between vertebral and spinal cord levels, then the difference between flexion and extension markings should be similar to the difference associated with independent observers marking vertebral and spinal cord segments across subjects. To this effect, we report each of the following: 1) the vertebral-spinal discrepancy reported for each segmental level, in millimeters, across 2 independent observers; 2) the vertebral-spinal discrepancy between neutral and flexion positioning; and 3) the vertebral-spinal discrepancy between neutral and extension positioning. In all cases, the mean and SD across all study participants are reported.
Results
The adult human spinal cord is roughly the shape of a curved cylinder that extends from the cervicomedullary junction at the foramen magnum to approximately the level of the first lumbar vertebral body. The cervical spinal cord typically follows the slight lordotic curvature of the bony spinal column (the convexity of the curve points anteriorly and the concavity points posteriorly), but this varies among individuals. To account for this variability, we measured distances (arc length in millimeters) down the spinal cord from a fixed point in the brain stem, the PMJ, of 20 healthy volunteers. Figure 1 illustrates the result of spinal cord centerline extraction, for 1 subject, from the T2-weighted volume.
Imparting Neuroanatomic Context to Spinal Imaging
To provide neuroanatomic context to each individual's spinal images, we manually marked the position of vertebral bodies and segmental nerve rootlets as they emerged from the spinal cord; this is illustrated in Fig 2. The common thread among all individual datasets is the personalized spinal cord axis originating at the PMJ and continuing down the spinal cord. By conducting measurements along this personalized axis, we could compare the distribution of vertebral body and segmental rootlet positions down the rostral-caudal length of an individual's spinal cord with others in our cohort.
There are distinct gaps in the position of cervical nerve rootlets (see the MR image and illustration in Fig 2), a natural boundary for segmental information before the predominant somatotopic representation in the brain. The distribution of the C3 through C8 spinal cord segments along the curved spinal cord axis is shown as solid lines and reported within the graph inset in Fig 3. A second, independent observer marked a subset of datasets (n = 15) yielding an interclass correlation coefficient of 1.0, P < .01, indicating the high degree of reproducibility with which a qualified individual can identify segmental nerve rootlets.
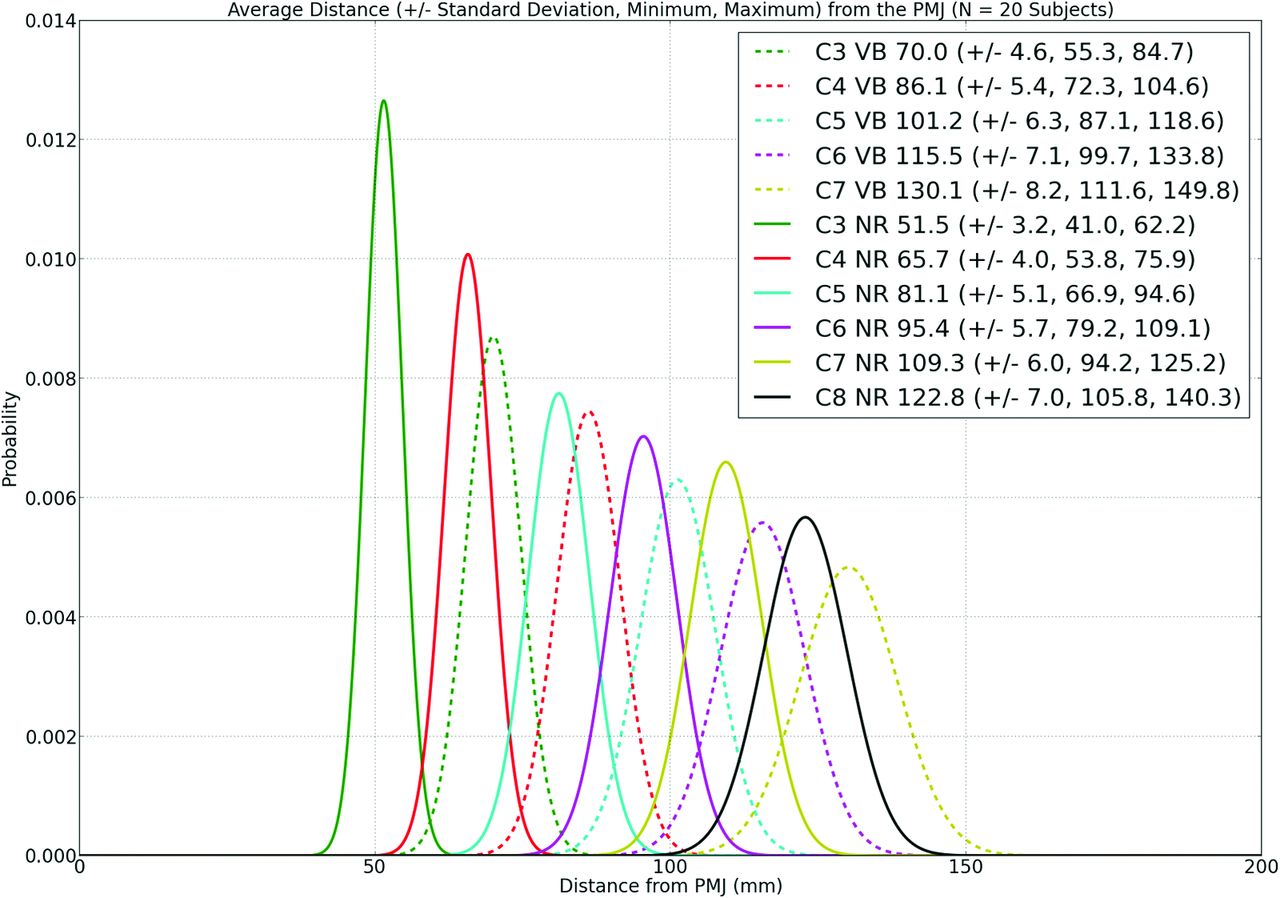
Nerve rootlet (NR, solid lines) and vertebral body (VB, dashed lines) distributions across our cohort of 20 individuals. The x-axis of this line graph represents the distance from the PMJ along the spinal cord axis, where zero is the PMJ and the increasing numbers are millimeter distances down the curved axis of the spinal cord to the midpoint of either the vertebral body or spinal cord segment as demarcated by nerve rootlets. The y-axis of the line graph represents the probability of finding either NR (solid line) or VB (dashed line) at a given distance down the curved spinal cord. The spinal cord segments and vertebral bodies represented by the colored lines are shown in the graph inset as distances in millimeters to the midpoint of either the vertebral bodies or spinal cord segments (as represented by nerve rootlets), projected orthogonally onto the spinal cord centerline, SDs, and range. The rostral-caudal extent of nerve rootlets corresponding to each spinal segment was relatively consistent across all spinal cord segments. The average length of spinal cord segments are the following: C3, 10.5 mm; C4, 9.9 mm; C5, 10.5 mm; C6, 9.7 mm; C7, 9.4 mm; and C8 9.6 mm.
The distribution of vertebral bodies along the curved longitudinal spinal cord axis is shown as dashed lines and is reported in the graph inset in Fig 3. A second, independent observer marked a subset of datasets (n = 15) yielding an interclass correlation coefficient of 1.0, P < .01, indicating the high degree of reproducibility with which a qualified individual can identify the vertebral bodies.
The rostral-caudal extent of nerve rootlets corresponding to each spinal segment was relatively consistent across the C3 through C8 spinal levels. The rostral-caudal length of rootlet groups are the following (mean): C3, 10.5 ± 2.2 mm; C4, 9.9 ± 1.3 mm; C5, 10.5 ± 1.5 mm; C6, 9.7 ± 1.6 mm; C7, 9.4 ± 1.4 mm; and C8, 9.6 ± 1.4 mm.
Accounting for Interindividual Differences in Spinal Anatomy
The results presented above and illustrated in Fig 3 provide a neuroanatomic context to spinal imaging. The differences among individuals have implications for imaging studies conducted across a cohort of subjects; to account for these differences and improve the accuracy with which interpretations are drawn from imaging studies, we next considered the effect of using vertebral bodies as a surrogate for spinal segments and whether patient positioning within the MR imaging environment can exacerbate differences between vertebral and spinal cord segments.
Are Vertebral Bodies a Reliable Surrogate Marker for Spinal Cord Segments?
Given the heterogeneity in spinal column and spinal cord anatomy across even a small sample of the human population, we illustrate how this might affect the spatial interpretation of imaging data by using the vertebral bodies as a rough indication of spinal cord segmental anatomy; this is illustrated in Fig 4, showing a subset of 10 subjects. As a first approximation, we illustrate the effect of assuming that a certain vertebral body is immediately adjacent to the corresponding spinal cord segment (eg, the C7 vertebral body is adjacent to the C7 spinal segment). If we apply this methodology to all 20 subjects in this study, then 0% of the C7 spinal cord segment volume is captured in the selected range. The root-mean-square error between locations of the superior endplate of the vertebral bodies and their corresponding spinal cord segments, averaged over 20 subjects and 5 groups of nerve rootlets (C3–C7), is 20.33 mm.

Vertebral body and spinal cord segment location across 10 subjects enrolled in this study. Vertebral bodies are represented for each subject by light-shaded bars, whereas spinal cord segments are represented by colored bars (see graph inset).
Neuroanatomic textbooks suggest that a more accurate landmark for predicting spinal cord segments is using the vertebral body rostral to the given spinal cord segment.11 This assumes, for example, that the C7 spinal cord segment lies adjacent to the C6 vertebral body. Using the same 10 subjects shown in Figs 4 and 5 illustrates that 33% of the intended spinal cord segment would be captured in the targeted volume. Using all 20 subjects studied, 44% of the intended spinal cord segment volume would be captured in the targeted volume. The root-mean-square error between locations of spinal cord segments and the superior endplate of the vertebral body rostral to the corresponding spinal cord segment in this case is 3.39 mm for all 20 subjects. We also note that root-mean-square error depends on the subject, ranging from 0.86 to 6.42 mm among the 20 subjects.
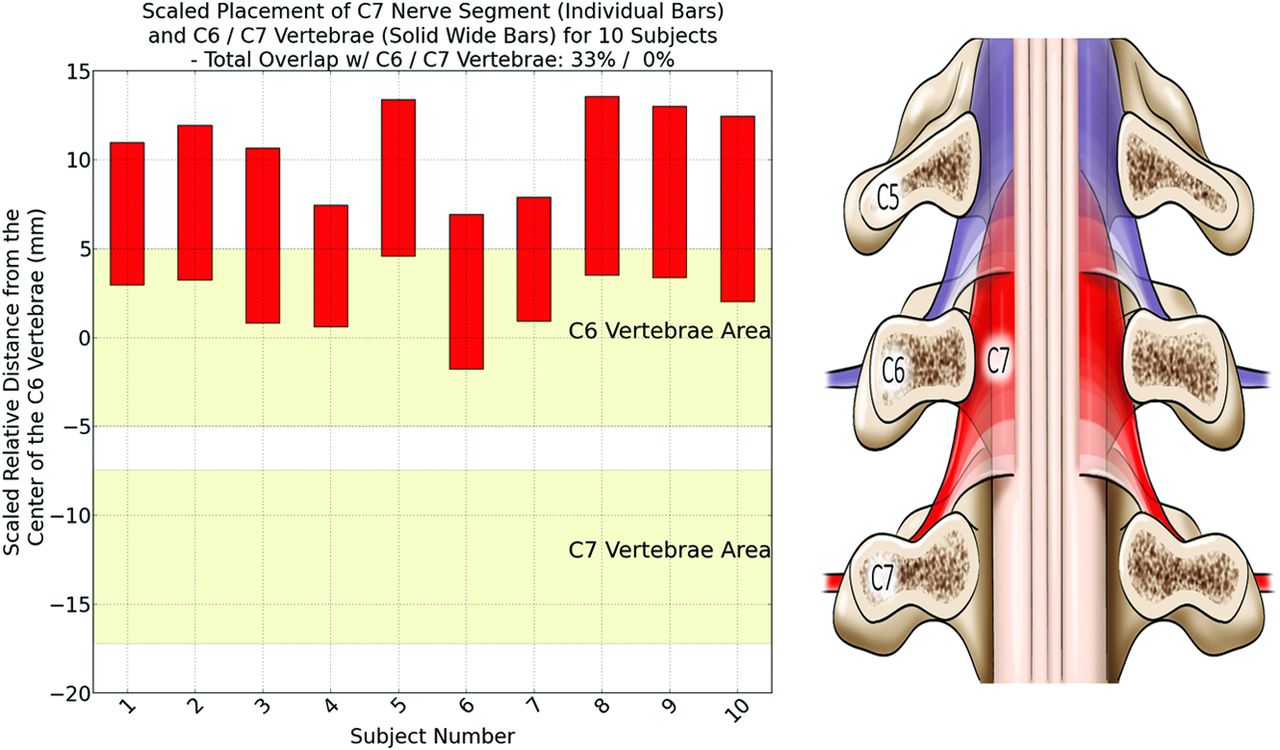
Left: scaled relative distance of the C7 spinal cord segments (red bars) from the C6 (upper light-brown-shaded area) and C7 (lower light-brown-shaded area) vertebral bodies. When we visualize an individual's cervical spine MR imaging, we tend to hold the vertebral bodies constant. This figure illustrates that the position of the seventh cervical spinal cord segment varies relative to the position of the vertebral body across a cohort of individuals. If one were to assume that the C7 spinal segments are immediately adjacent to the C7 vertebral body, then 0% of the actual segments would be captured in such an analysis. Similarly, if one were to assume that the C7 spinal cord segments are 1 vertebral body length rostral to the C7 body, then one would capture 33% of the corresponding spinal segments for the 10 subjects shown, or 44% of the corresponding spinal segments across all 20 subjects. Depending on the goals of the imaging experiment, one should pay careful attention to the relative position of spinal segments and vertebral bodies across a cohort of individuals. Assuming that spinal segments are constant may lead to false-positive or false-negative results. Right: an artist's depiction shows the range in spinal cord segments relative to the vertebral bodies; light-shaded areas represent areas of population level overlap.
Does Patient Positioning within the MR Imaging Environment Exacerbate Differences Between Vertebral and Spinal Cord Segments?
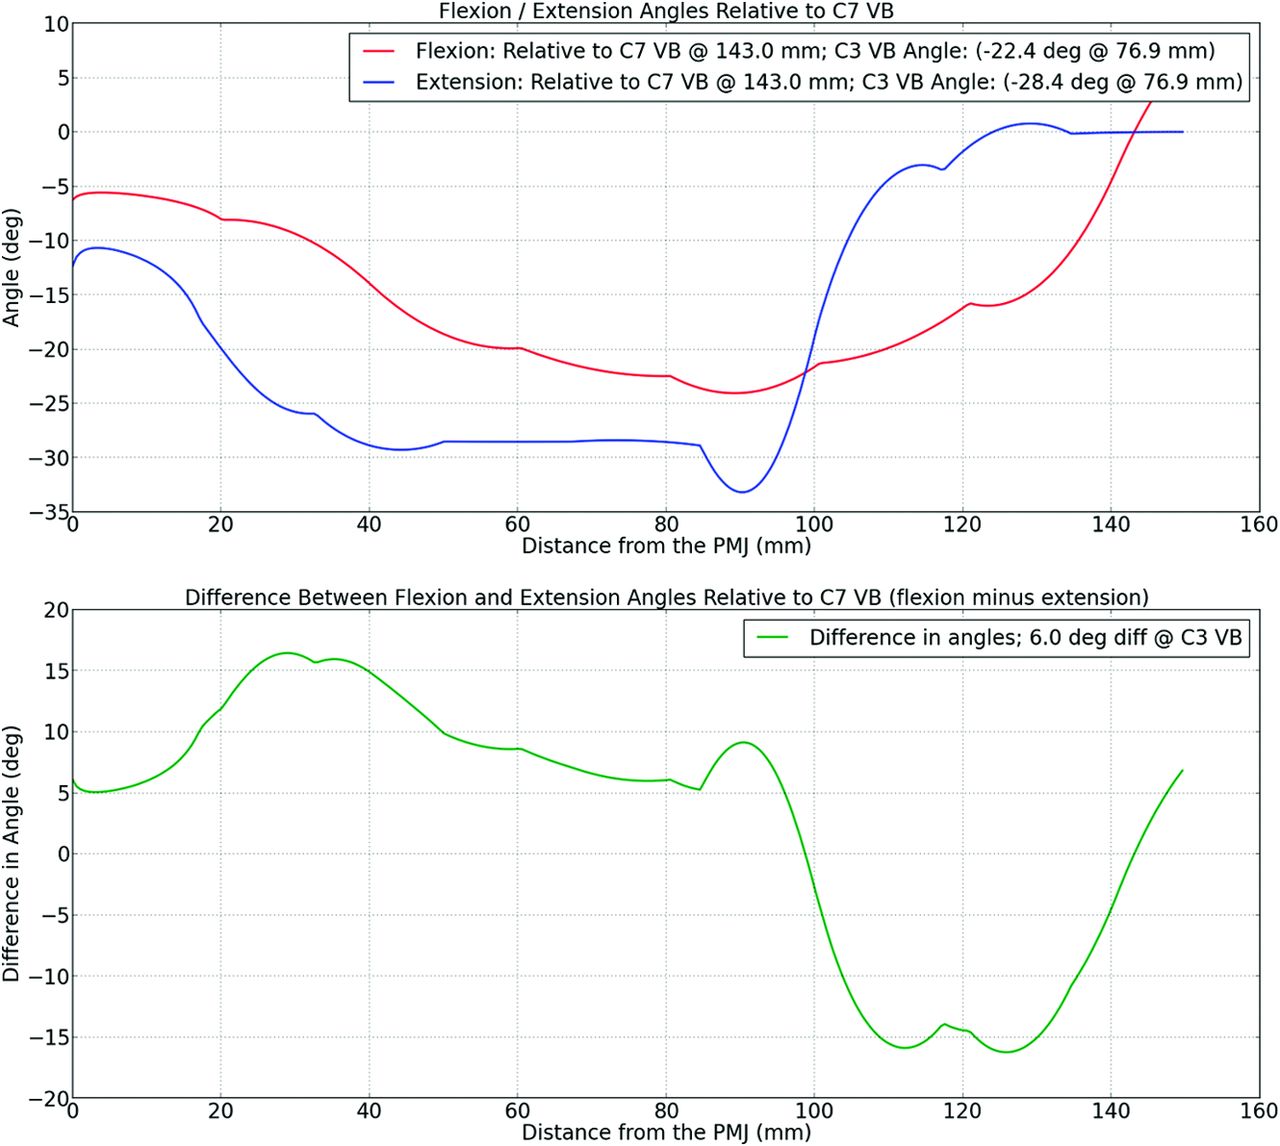
A subset (n = 6) of our initial cohort underwent imaging in slight neck flexion (by placing an extra cushion under the occiput) and slight neck extension (by placing an extra cushion under the shoulders) to determine the effect of patient positioning on the discrepancy between vertebral level and spinal segments. Measurements of flexion and extension from a neutral position are shown in Fig 6, illustrating that positioning with an extra cushion results in roughly 10°–15° of flexion or extension from a neutral position.

Automated analysis of the degree of neck flexion/extension of a subject. Top: the angle between the tangent of the spinal cord at any point and tangent at the C7 vertebral body for 1 subject with the neck in flexion (red) and extension (blue). Bottom: the difference between the flexion and extension curves or the maximum extent of curvature of the spinal cord at various locations down the longitudinal axis of the spinal cord (x-axis). VB indicates vertebral body; deg, degree; deg diff, degree difference.
Vertebral-spinal discrepancy varies substantially across subjects as is illustrated in Fig 4. However, the discrepancy can be compared either within a subject in neutral position (to determine the error associated with marking vertebral and spinal segments) or within a subject between neutral and either flexion or extension positions. The error associated with determining vertebral-spinal discrepancy varied across spinal levels and was the following: C3, 1.0 mm; C4, 1.3 mm; C5, 1.3 mm; C6, 0.9 mm; and C7, 1.1 mm.
If the patient is positioned in slight flexion, the vertebral-spinal discrepancies are as follows: C3, 1.3 mm; C4, 0.7 mm; C5, 1.2 mm; C6, 0.8 mm; and C7, 1.9 mm.
If the patient is positioned in slight extension, the vertebral-spinal discrepancies are as follows: C3, 1.4 mm; C4, 0.7 mm; C5, 1.0 mm; C6, 1.0 mm; and C7, 1.0 mm.
These results are summarized in Table 2. They suggest that flexion or extension that is possible within the confines of the MR imaging environment and measured to be between 10° and 15° (Fig 5) does not affect the relative positions of vertebral and spinal cord segments.
Vertebral-spinal discrepancy reported in neutral position across 2 independent observers, between neutral and flexion positions and neutral and extension positionsa
Discussion
In this work, we characterized the location of spinal and vertebral levels in humans and addressed the intersubject variability, which is a current limitation in spinal cord MR imaging studies.12 To perform this characterization, we used the longitudinal axis of the brain stem–spinal cord to perform measurements, therefore accounting for the unique anatomy of a single subject. A detailed understanding of a single subject's anatomy is an important aspect of using advanced MR imaging–based metrics (such as diffusion- or magnetization transfer–based measurements) to refine the diagnosis of spinal cord pathology and follow the effect of novel therapeutic agents. For example, it has been demonstrated that any incremental preservation of axons after traumatic injury to the spinal cord results in a concomitant and exponential increase in clinical function.13 With novel treatment strategies aimed at either neuroprotection or remyelination of axons, it will be extremely beneficial to use MR imaging–based biomarkers to follow the degree of change to the spinal cord structure and function in the appropriate anatomic region. Visualizing these changes may aid in the design of more efficient clinical trials and the ability to test a greater number of novel therapeutic agents within a limited patient population.14,15 On the basis of user-defined markings of segmental nerve rootlets as ground truth data, we identified the position of spinal segments relative to the PMJ. For the first time, we report a population distribution of the segmental anatomy of the cervical spine and demonstrate that substantial variation exists in the rostral-caudal position of spinal cord segments among individuals.
Limitations of this work include the fact that measurements were obtained from a relatively small sample size of healthy controls. While this number of subjects is adequate to establish the fact that differences exist between individuals, adding a greater number of subjects of different ages and ethnic backgrounds and including those with pathologies of the spinal column would be a welcome addition in future works.
Accounting for this variation will be paramount to accurate interpretation of the neuroanatomic origin of acquired MR signals in future imaging studies. This especially holds true for functional MR imaging studies that are challenging due to the low sensitivity for studying single subjects (notably due to a low signal-to-noise ratio and high physiologic noise), and by the intrinsic variability of spinal rootlet locations that hamper the use of grouped data. This argument is supported by a previous fMRI study on cats, which showed high interanimal variability on the rostrocaudal location of the blood oxygen level–dependent signal relative to the vertebral level, when stimulating the same peripheral nerve.16
After providing a neuroanatomic context to spinal imaging data, we then addressed 2 important concepts to account for interindividual variation in imaging studies conducted across a group of subjects: 1) the effect of using vertebral bodies as a surrogate for spinal segment location, and 2) the effect of patient positioning on localizing a spinal segment. Subdivision of the spinal cord into discrete segments begins as early as 4.5 gestational weeks in embryologic development during which time dorsal nerve rootlets engage the spinal cord from dorsal root ganglia and ventral nerve rootlets emerge from the spinal cord; this process is largely complete by the end of the first trimester, after which time the spinal cord white matter develops and is progressively myelinated.17 Dorsal and ventral nerve rootlets aggregate in clusters, emerge from the spinal cord forming a spinal nerve, and traverse the closest caudal intervertebral foramen to innervate the corresponding segment of the body.17 As such, cervical spinal cord segments are consistently located rostral to the corresponding numbered cervical vertebrae as illustrated in Fig 4. However, using vertebral bodies to localize a corresponding spinal cord segment is quite imprecise. The percentage volume overlap between, for example, the C6 vertebral bodies and C7 spinal cord segments is only 44%, by using all 20 subjects. We also investigated the effect of subject positioning (ie, neck flexion or extension) on the discrepancy between vertebral and spinal cord segments. Fortunately, this effect was relatively small as outlined in Table 2. This has important clinical implications because subject positioning can sometimes be imposed by the clinical condition.
Conclusions
Remarkable advances have been made during the past decade allowing improved imaging of the human spinal cord.12,18 The development of methods to manage the hostile imaging environment and to account for cardiorespiratory-related motion has allowed improved applications to detect structural (such as diffusion and magnetization transfer imaging) and functional anomalies that occur in relation to traumatic injury of the spinal cord.1,2,19,20 Other disorders, such as multiple sclerosis, have also benefited from spinal cord imaging.21 Degenerative spinal disease, such as cervical spondylosis, is an increasing health burden due to the aging population.22 Advanced imaging tools stand to play an important role in aiding with decision-making, such as the optimal time to offer decompressive surgery to maintain neurologic function before irreversible neurologic deficits are realized. Future work in the realm of spinal segmentation must focus on the neuroanatomic context of acquired images and use population-based probability data to develop improved methods that aim to identify segmental anatomy. Thus, the user may have to only ensure the accuracy of the segmentation rather than manually identify each spinal rootlet as we did here. Such advances will improve workflow and reduce postprocessing time. Ultimately, this neuroanatomic knowledge may be used for the delivery of targeted therapeutics offering a regenerative strategy toward damaged cell populations.
Footnotes
Disclosures: David W. Cadotte—RELATED: Grant: Craig H. Neilsen Foundation (postdoctoral fellowship grant).* David Mikulis—UNRELATED: Grants/Grants Pending: Canadian Institutes of Health Research, Physicians Services Incorporated, Ontario Brain Institute. *Money paid to the institution.
Indicates open access to non-subscribers at www.ajnr.org
REFERENCES
- Received August 12, 2014.
- Accepted after revision October 1, 2014.
- © 2015 by American Journal of Neuroradiology


Jump to section
Related Articles
Cited By...
- Mapping Hand Function with Simultaneous Brain-Spinal Cord Functional MRI
- A multi-channel electrophysiology approach to non-invasively and precisely record human spinal cord activity
- Reliability of task-based fMRI in the dorsal horn of the human spinal cord
- Normalizing Spinal Cord Compression Morphometric Measures: Application in Degenerative Cervical Myelopathy
- Thermal Stimulus Task fMRI in the Cervical Spinal Cord at 7 Tesla
- Spatial distribution of hand-grasp motor task activity in spinal cord functional magnetic resonance imaging
- Spatial distribution of hand-grasp motor task activity in spinal cord functional magnetic resonance imaging
- Reliability of resting-state functional connectivity in the human spinal cord: assessing the impact of distinct noise sources
- Reliability of resting-state functional connectivity in the human spinal cord: assessing the impact of distinct noise sources
- Normalizing automatic spinal cord cross-sectional area measures
- T1 Mapping for Microstructural Assessment of the Cervical Spinal Cord in the Evaluation of Patients with Degenerative Cervical Myelopathy
- Investigating resting-state functional connectivity in the cervical spinal cord at 3T
- Clinically Feasible Microstructural MRI to Quantify Cervical Spinal Cord Tissue Injury Using DTI, MT, and T2*-Weighted Imaging: Assessment of Normative Data and Reliability