
Abstract
BACKGROUND AND PURPOSE: Evaluating abnormalities of the temporal bone requires high-spatial-resolution CT imaging. Our aim was to assess the performance of photon-counting-detector ultra-high-resolution acquisitions for temporal bone imaging and compare the results with those of energy-integrating-detector ultra-high-resolution acquisitions.
MATERIALS AND METHODS: Phantom studies were conducted to quantify spatial resolution of the ultra-high-resolution mode on a prototype photon-counting-detector CT scanner and an energy-integrating-detector CT scanner that uses a comb filter. Ten cadaveric temporal bones were scanned on both systems with the radiation dose matched to that of the clinical examinations. Images were reconstructed using a sharp kernel, 0.6-mm (minimum) thickness for energy-integrating-detector CT, and 0.6- and 0.25-mm (minimum) thicknesses for photon-counting-detector CT. Image noise was measured and compared using adjusted 1-way ANOVA. Images were reviewed blindly by 3 neuroradiologists to assess the incudomallear joint, stapes footplate, modiolus, and overall image quality. The ranking results for each specimen and protocol were compared using the Friedman test. The Krippendorff α was used for interreader agreement.
RESULTS: Photon-counting-detector CT showed an increase of in-plane resolution compared with energy-integrating-detector CT. At the same thickness (0.6 mm), images from photon-counting-detector CT had significantly lower (P < .001) image noise compared with energy-integrating-detector CT. Readers preferred the photon-counting-detector CT images to the energy-integrating-detector images for all 3 temporal bone structures. A moderate interreader agreement was observed with the Krippendorff α = 0.50. For overall image quality, photon-counting-detector CT image sets were ranked significantly higher than images from energy-integrating-detector CT (P < .001).
CONCLUSIONS: This study demonstrated substantially better delineation of fine anatomy for the temporal bones scanned with the ultra-high-resolution mode of photon-counting-detector CT compared with the ultra-high-resolution mode of a commercial energy-integrating-detector CT scanner.
ABBREVIATIONS:
- EID
- energy-integrating detector
- K-α
- Krippendorff α
- MTF
- modulation transfer function
- PCD
- photon-counting detector
- UHR
- ultra-high-resolution
Multidetector CT is an essential clinical diagnostic tool for evaluating abnormalities of the temporal bone and lateral skull base.1⇓⇓–4 Temporal bone structures of clinical interest, such as the ossicles, facial nerve, and labyrinth, are submillimeter and require high-spatial-resolution imaging.2,5 The detector size of a CT system is one of the major factors limiting the spatial resolution needed to resolve these fine structures. Commercially available multidetector CT scanners are built using energy-integrating detectors (EIDs), in which the detected signal is proportional to the total energy deposited by all photons without specific information about an individual photon or its energy. The effective detector pixel sizes range from 0.5 to 0.625 mm at the isocenter for the commercial EIDs. Several approaches have been investigated to further improve the spatial resolution of an EID system for temporal bone imaging. One approach is to place an attenuating comb (grid) filter on top of the detector to reduce the detector aperture size.6⇓–8 However, the attenuation of the filter inevitably reduces geometric dose efficiency because the filter blocks the photons after they have passed through the patient.6,9 Other methods, such as using a flat panel detector, do not satisfy the clinical requirements for contrast-to-noise ratio, scan field of view, or temporal resolution.10,11
A whole-body photon-counting detector (PCD) CT scanner has been installed in our laboratory for research use (Somatom CounT; Siemens, Erlangen, Germany)12⇓–14 and is not yet commercially available. Different from the conventional EIDs that integrate deposited energies from all photons, PCDs use direct-conversion techniques and count individual photons while measuring energy information. Studies have demonstrated many benefits of PCDs over the conventional EIDS, such as less impact of electronic noise, a higher contrast-to-noise ratio, improved dose efficiency, and simultaneous multi-energy imaging.15⇓⇓⇓⇓⇓⇓–22 PCDs can eliminate the septa between adjacent detector pixels required by EIDs to avoid cross-talk and maintain spatial resolution. This feature leads to a PCD detector size of 0.25 mm at the isocenter (compared with 0.5–0.6 mm for EIDs) without compromising dose efficiency. To date, preliminary phantoms and cadaveric studies have reported 150-μm limiting spatial resolution for this scan mode and have demonstrated the potential benefits of superior image quality from ultra-high-resolution (UHR) PCD-CT acquisitions.23,24 However, none of the studies has evaluated specific clinical tasks and investigated how radiologists' reading performance could benefit from the higher resolution capability of PCD-CT. Therefore, the purpose of this study was to assess the performance of PCD-CT UHR acquisitions for temporal bone imaging and compare the results with those of EID-CT UHR acquisitions.
Materials and Methods
Phantom Experiments to Evaluate Spatial Resolution
A 50-μm diameter tungsten wire inserted into a solid water phantom was scanned along the z-axis on the whole-body PCD-CT scanner using the UHR scan mode. The PCD-CT system was built on the platform of a second-generation dual-source CT scanner (Somatom Definition Flash; Siemens). Detailed descriptions of this system have been reported elsewhere.12⇓–14 The UHR acquisition on the PCD-CT system has an effective pixel size of 0.25 × 0.25 mm at the isocenter.23 PCD-CT scans were obtained with the following parameters: spiral mode, 120-kV tube potential, 25- and 75-keV energy thresholds, 32 × 0.25 mm collimation, 0.8 pitch, and 1.0-second rotation time. For comparison, the wire phantom was also scanned on a second-generation dual-source CT scanner, the same platform on which the PCD-CT was built. Both the PCD-CT and EID-CT systems involved in this study use an identical UHR focal spot size of 0.7 mm.25 EID-CT scans were obtained using the standard clinical protocol: UHR mode with a comb filter along the fan direction, spiral mode, 120-kV tube potential, 16 × 0.6 mm collimation, 0.8 pitch, and 1.0-second rotation time. All images were reconstructed with a standard weighted filtered back-projection algorithm, 0.6-mm slice thickness, and a sharp kernel (U70). Modulation transfer function (MTF) is commonly used to provide a comprehensive evaluation of spatial resolution for imaging systems by assessing the system response with respect to the input signal at each frequency. In this study, the MTF was calculated from the point spread function of the wire in the axial images to assess the in-plane spatial resolution. Spatial frequencies of 50%, 10%, and 2% MTF values were recorded.
Temporal Bone Specimens
Ten formalin-fixed cadaveric temporal bone specimens were harvested by the department of anatomy using the block technique described by Schuknecht.26 All specimens had no known history of a prior operation or trauma and were otherwise anatomically intact. Each specimen was placed within a 20-cm-diameter solid-water ring and placed in the supine position to replicate clinical temporal bone CT examinations.
Imaging Protocol for Specimens
Each specimen was scanned using the UHR mode with the same imaging protocols for phantom experiments on PCD-CT and EID-CT systems, respectively. Automatic exposure control was off and effective milliampere-second was set to match the radiation dose of clinical examinations (volume CT dose index = 61 mGy). All images were reconstructed using the weighted filtered back-projection method with a sharp kernel (U70). For PCD-CT acquisitions, image thickness and increment were set to 0.6/0.3 and 0.25/0.25 mm (thinnest available), respectively. Image thickness and increment for the EID system were set to 0.6/0.3 mm (thinnest available). For simplification, the 3 CT-acquisition protocols are denoted as “detector type–image thickness” (in millimeters) (ie, PCD-0.6, PCD-0.25, and EID-0.6).
Noise Measurements
Image noise was measured in the cadaveric images as the standard deviation (SD) of CT numbers in a circular ROI drawn in a uniform soft-tissue area for each dataset. The size and the location of the ROIs were matched among the 3 image sets (PCD-0.6, PCD-0.25, and EID-0.6). The mean and SD of image noise for each image set were calculated.
Reader Assessment of Image Quality
The reading protocol was established on a clinical viewing station that was appropriately calibrated for routine diagnosis following the “ACR-AAPM-SIIM Technical Standard for Electronic Practice of Medical Imaging.”27 The 3 image sets (PCD-0.6, PCD-0.25, and EID-0.6) for each temporal bone specimen were displayed side by side in a random order with scanning and reconstruction information blinded to the readers. Three fellowship-trained neuroradiologists (R.J.W., K.K.K., L.J.E.), each with >10 years of experience, independently assessed the overall image quality and the delineation of 3 anatomic structures (modiolus, stapes footplate, incudomallear joint). For each specimen, images from 3 protocols were ranked from 1 to 3, with 1 being the most preferred and 3 being the least preferred. Equal rank was allowed. Thirty sets of images (10 specimens × 3 image sets/specimen) were reviewed by each of the 3 readers.
Statistical Analysis
All statistical analyses were performed using free statistical software (R Project, Version 3.4.0; http://www.r-project.org/). The differences of image noise among the 3 protocols were evaluated using 1-way ANOVA with subsequent Tukey honest significant difference analysis. The average ranking from the 3 readers for each specimen and protocol was compared using the Friedman test to evaluate the differences in overall image quality and diagnostic confidence for the 3 structures. Pair-wise comparisons were performed with Conover post hoc testing with a Bonferroni correction. P < .05 was considered statistically significant. The Krippendorff α (K-α) was used to test the interreader agreement with the following scales: 0–.20 = poor agreement, 0.21–0.40 = fair agreement, 0.41–0.60 = moderate agreement, 0.61–0.80 = substantial agreement, and 0.81–1.00 = almost perfect agreement.28
Results
PCD-CT showed a slightly better MTF performance than EID-CT (Fig 1). The spatial frequencies at 50%, 10%, and 2% MTF (Table 1) were 11.2, 18.4, and 21.1/cm for the PCD-CT and 10.6, 17.5, and 20.1/cm for EID-CT.

Comparison of MTF curves for UHR modes reconstructed with a sharp kernel (U70) on the PCD-CT and EID-CT systems.
Spatial frequencies of 50%, 10%, and 2% MTF values for UHR acquisitions on both PCD-CT and EID-CT systems with images reconstructed with a sharp kernel (U70)
Representative images of the modiolus (Fig 2), stapes footplate (Fig 3), and incudomallear joint (Fig 4), shown side-by-side for the 3 datasets (PCD-0.6, PCD-0.25, and EID-0.6), demonstratedthe improved ability to resolve each of the evaluated structures. Decreased image thickness resulted in enhanced visualization of the 3 submillimeter structures evaluated.

Representative axial images of the modiolus (arrow) from the same specimen scanned with UHR PCD-CT and reconstructed with 0.25- (A) and 0.6-mm (B) image thicknesses, and UHR EID-CT, with a 0.6-mm image thickness (C). The pyramid-shaped modiolus is better depicted with the PCD-CT.

Representative axial images of the stapes footplate (arrow) from the same specimen scanned with UHR PCD-CT and reconstructed with 0.25- (A) and 0.6-mm (B) image thicknesses, and UHR EID-CT, with 0.6-mm image thickness (C). An improved illustration of the stapes footplate and the limbs of the stapes is observed for PCD-CT.
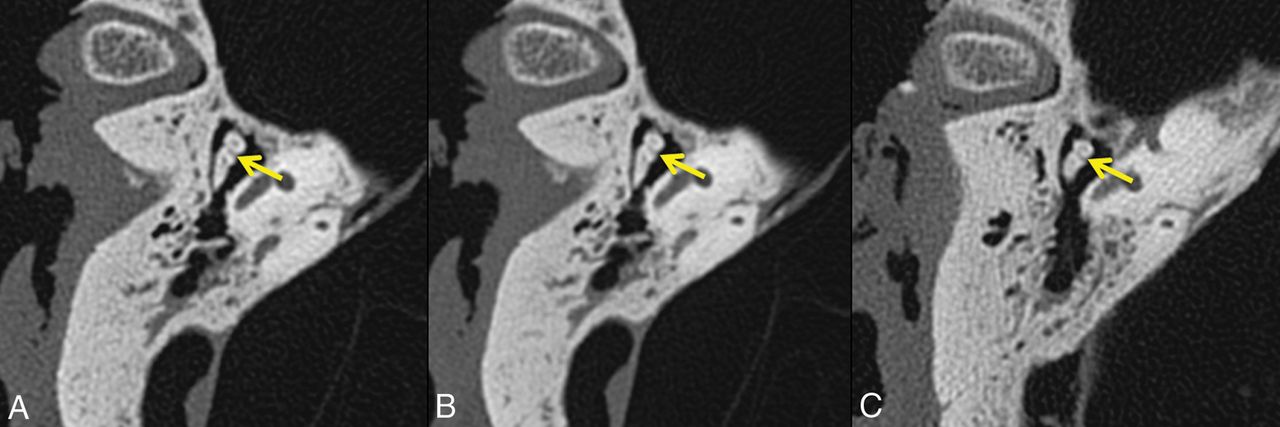
Representative axial images of the incudomallear joint (arrow) from the same specimen scanned with UHR PCD-CT and reconstructed with 0.25- (A) and 0.6-mm (B) image thicknesses, and UHR EID-CT, with 0.6-mm image thickness (C). The incudomallear joint between the incus and malleus is better defined in PCD-CT images compared with EID-CT images.
Measurements for the same image thickness (0.6 mm, Fig 5) showed that images from the PCD scanner had significantly lower (P < .001) image noise (mean, 55.9 ± 5.2 HU) compared with images from the EID scanner (mean, 91.8 ± 6.5 HU). The thinner 0.25-mm PCD images (mean, 89.8 ± 8.3 HU) yielded noise like that of the 0.6-mm EID images (P = .80).

Image noise measured from 10 cadaveric specimens scanned with 3 UHR protocols. White indicates PCD with a 0.25-mm image; gray, PCD with a 0.6-mm image; black, EID with a 0.6-mm image.
The rank distributions from all 3 readers demonstrated that PCD-0.25 images were the most preferred, followed by the PCD-0.6 images; the EID-0.6 images were the least preferred (Fig 6). The Friedman test showed statistically significant differences in rankings for the 3 protocols (P = .02). Pair-wise comparison demonstrated that the readers preferred the PCD-CT images to the EID images for all 3 temporal bone structures (Table 2). Among the 3 sets of PCD images, readers preferred the PCD-0.25 images over the PCD-0.6 images for visualizing the modiolus (P = .002) and the incudomallear joint (P < .001), but no significant preference was found when assessing the stapes footplates (P = .12). For overall image quality, both PCD-CT image sets were ranked significantly higher than the EID images (P < .001), and readers preferred thinner images (0.25 mm) over thicker images (0.6 mm) from PCD-CT (P < .001).

Rankings from 3 readers regarding overall image quality and delineation of 3 key anatomic structures. For all 3 structures and overall image quality, UHR PCD-CT images with 0.25-mm thickness have the highest rank (average, 1.2–1.4), while UHR EID-CT images with 0.6-mm thickness have the lowest rank (average, 2.5–2.8). White indicates the first rank; gray, the second rank; black, the third rank.
Visual assessment and comparison of image quality on 3 image sets acquired from PCD- and EID-CT scanners
Fair-to-moderate interobserver agreement was observed among the 3 readers for ranking image quality (Table 3). Readers reached moderate agreement for the modiolus (K-α = 0.54) and stapes footplate (K-α = 0.44) and fair agreement for the incudomallear joint (K-α = 0.36). For overall image quality, moderate agreement was observed with K-α = 0.50.
Interobserver agreement among 3 neuroradiologists for image-quality assessment of the 10 temporal bone casesa
Discussion
In this in vitro study, we investigated temporal bone imaging using a new PCD-CT system with a 0.25 × 0.25 mm detector size at its isocenter. Quantitative and qualitative image quality analyses showed superior image quality and better delineation of anatomic microstructures compared with the EID-CT system on which the PCD-CT was built.
Leng et al23 reported the preliminary results of PCD-CT UHR imaging using various phantom and cadaveric test objects. Among these studies, 1 cadaveric temporal bone was scanned, and it was found that the PCD-CT UHR acquisition with a service-mode sharp kernel (S80) achieved 29% noise reduction compared with the EID-CT system. In this present work, with results from multiple cadaveric temporal bone specimens, we have demonstrated that with a clinical temporal bone reconstruction kernel (U70), the PCD-CT UHR mode could achieve ∼40% noise reduction compared with an EID-CT system when scanning at the same dose level and reconstructing at the same image thickness (0.6 mm). The more aggressive noise reduction with PCD in this study compared with the previous report23 is mainly due to the kernel difference (U70 is sharper than S80). Our results indicate the potential of a 64% reduction in dose using PCD-CT for clinical temporal bone imaging to achieve the same image noise as in EID-CT. This finding confirmed the previous conclusion that PCD-CT with its direct energy conversion could substantially increase the dose efficiency of UHR acquisitions compared with the EID-CT technique using a comb filter.29
Both PCD image sets (PCD-0.6 and PCD-0.25) were preferred compared with EID acquisitions because submillimeter structures were more evident on PCD images. One contribution was from the slightly improved in-plane resolution on the PCD-CT. At matched image thicknesses (0.6 mm), PCD-0.6 images had the additional benefit of significantly lower image noise than the EID-0.6 images. On the other hand, PCD-0.25 images had the benefit of thinner images and less axial partial volume averaging compared with the EID-0.6 mm images, with no increase in image noise. Readers showed a strong preference for thinner PCD images despite their increased noise level.
Although this study focused on only temporal bone imaging, the demonstrated benefits may be applicable to other areas. For example, the use of thin CT images has been proved to increase the detectability of structural abnormalities in the temporal bone,30 coronary artery,31 and pulmonary nodules.32,33 Recently, a prototype whole-body system using an EID detector at a smaller (0.25-mm) detector cell was introduced for lung imaging.34 However, the loss of geometric efficiency from an increased density of septa substantially increased image noise. This is not an issue for PCD because no septa are required with its direct-conversion technique. Smaller image thicknesses reduce partial volume averaging and result in enhanced visualization of submillimeter structures.
In this study, the pyramid-shaped modiolus, the central bony pillar of the cochlea, was better depicted with the PCD system (Fig 2). The modiolus accommodates the fine terminal branches of the cochlear nerve, and hyperattenuation of the modiolus on CT can be observed in cases of cochlear nerve aplasia.2 Determination of cochlear nerve aplasia can prove critical in the evaluation of patients with profound sensorineural hearing loss because it would preclude the possibility of successful cochlear implantation.35 Similarly, a patulous modiolus is associated with intraoperative CSF leaks during cochlear implantation, and preoperative knowledge of this malformation would allow the surgeon to modify the approach accordingly. Likewise, in the evaluation of conductive hearing loss, confirming the integrity of the ossicular chain is critical to patient management. Our results suggest that PCD will be superior to EID in the detection of subtle ossicular abnormalities, including discontinuity, fibrous union, congenital fusion, and fixation (eg, otosclerosis, tympanosclerosis).
The PCD-CT scanner investigated in this study is a research system, and there is currently no commercial PCD-CT system available. More work is required to make the system more cost-effective and reliable, like the EID-CT systems, so that it can be used in routine clinical practice. This study represents the first step toward the adoption of the PCD-CT UHR mode for diagnostic neuroradiology practice. There were, however, several limitations to this study. First, this was an in vitro, cadaveric study. Cadaveric specimens were used because repeat scans could be easily performed in a well-controlled fashion. Because key anatomic structures were well-preserved in the cadaveric specimens, the results of our study represent what would be expected with patient imaging, though a future in vivo study is warranted. Second, the current study focused on image-quality assessment without evaluating diagnostic accuracy due to the lack of substantial pathology in the available cadaveric specimens. With these preliminary results showing the benefit of PCD-CT, our future studies will focus on diagnostic accuracy for in vivo patient examinations with specific pathology.
Conclusions
This study demonstrated, for the first time, the improvement in image quality and reader preference in temporal bone imaging using the UHR PCD-CT technology. With the superior in-plane resolution and ultrathin (0.25-mm) image thickness, the PCD-CT system demonstrated better delineation of anatomic microstructures of the temporal bones compared with UHR acquisitions performed on a commercial EID-CT system.
Footnotes
Disclosures: Cynthia H. McCollough—RELATED: Grant: Siemens*; Provision of Writing Assistance, Medicines, Equipment, or Administrative Support: Siemens *; UNRELATED: Grants/Grants Pending: Siemens, Bayer Healthcare*; Royalties: Bayer Healthcare.* Shuai Leng—RELATED: Grant: National Institutes of Health, Comments: Research reported in this article was supported by the National Institutes of Health under award numbers R01 EB016966 and C06 RR018898 and in collaboration with Siemens*. *Money paid to the institution.
Research reported in this article was supported by the National Institutes of Health under award numbers R01 EB016966 and C06 RR018898 and in collaboration with Siemens.
The content is solely the responsibility of the authors and does not necessarily represent the official views of the National Institutes of Health.
Indicates open access to non-subscribers at www.ajnr.org
References
- Received March 13, 2018.
- Accepted after revision June 19, 2018.
- © 2018 by American Journal of Neuroradiology


Jump to section
Related Articles
Cited By...
- Comprehensive Review of Inner Ear Anatomy on Photon-Counting CT
- PCD-CT Versus EID-CT in Imaging of Pancreatic Ductal Adenocarcinoma: A Prospective Comparative Pilot Study
- Pre- and Postoperative Imaging of Cochlear Implantation in Cadaveric Specimens Using Low-Dose Photon-Counting Detector CT
- Comprehensive Review of External and Middle Ear Anatomy on Photon-Counting CT
- Comparison of Image Quality and Radiation Dose in Pediatric Temporal Bone CT Using Photon-Counting Detector CT and Energy-Integrating Detector CT
- Photon-Counting CT in the Head and Neck: Current Applications and Future Prospects
- A New Frontier in Temporal Bone Imaging: Photon-Counting Detector CT Demonstrates Superior Visualization of Critical Anatomic Structures at Reduced Radiation Dose