
A recent article by Strigel et al addressed a very important issue facing clinical functional MR imaging (fMRI): how confident of an activation map can one be, in light of the different susceptibility issues in clinical fMRI?1 The authors touch upon only the tip of the iceberg as they present an ad hoc method for demonstrating confidence in the activation map by calculating a signal intensity mask (SIM).1 The main problem with this approach is that it is independent of the blood oxygen-level dependent (BOLD) signal intensity change and would incorrectly create the same mask if the change were 0.5% or 5%. The criterion used to generate the threshold is described as “thresholded to eliminate signal intensity from regions outside the brain.” This is problematic because the tissues outside the brain are for the most part skull, scalp, and muscle. Muscle has similar relaxation parameters as the brain, so yielding a threshold near brain intensity. With multichannel array coils becoming more mainstream, the images have significantly higher signal intensity near the surface coils, making the SIM threshold artificially high, and may even cause voids in the center of the image. The SIM threshold will vary for each subject according to his or her anatomy and positioning in the coil. The SIM threshold will change if the service engineer makes an adjustment or upgrades the scanner software, altering the image intensity scale. The use of an intensity-based threshold, as suggested, may give a false sense of confidence.
The authors describe the method as “the initial EPIs” (echo-planar images) were used to generate the SIM.1 This points to an even more fundamental problem. Functional imaging is based on detecting small signal intensity changes over time. Having a high signal intensity–to-noise ratio (SNR) in a single image is not sufficient to detect small signal intensity changes over time. The stability of the signal intensity over time is more important than the absolute level of the signal intensity. One needs to use temporal SNR, the signal intensity to noise calculated over the entire time course, as the basis of an activation map threshold.2 By using the entire time series data, the method of screening the activation map is now sensitive to susceptibility signal intensity loss, spike artifacts, scanner instabilities (radiofrequency, gradient, and B0), and movement artifacts. The latter is critical around susceptibility-induced signal intensity voids, where small movements could mimic large signal intensity changes.
In 2000, I proposed a method that described the temporal SNR map and a method to threshold it on the basis of the imaging parameters, the desired confidence levels, and a computer model.2 In that report, the idea of a BOLD sensitivity map independent of field strength, coil used, or signal intensity level was introduced. On the basis of this method and an expected BOLD signal intensity change of 0.5% would require a minimum temporal SNR of 164 in an experiment with 80 volumes (10 on/10 off, repeated 4 times), a type I error of α = 0.05% and a power level of β = 0.95. The required minimum SNR is the same for any subject, does not change based on scanner manufacturer, coil used, or field strength. The results are scalable to meet any type of fMRI protocol. For example, if one changed the level of BOLD signal intensity expected to 1%, the required minimum SNR decreases by a factor of 2, to 82. In a separate publication, we also showed how the BOLD sensitivity maps could be used to determine if the actual measured BOLD signal intensity change was detectable in the amygdala.3
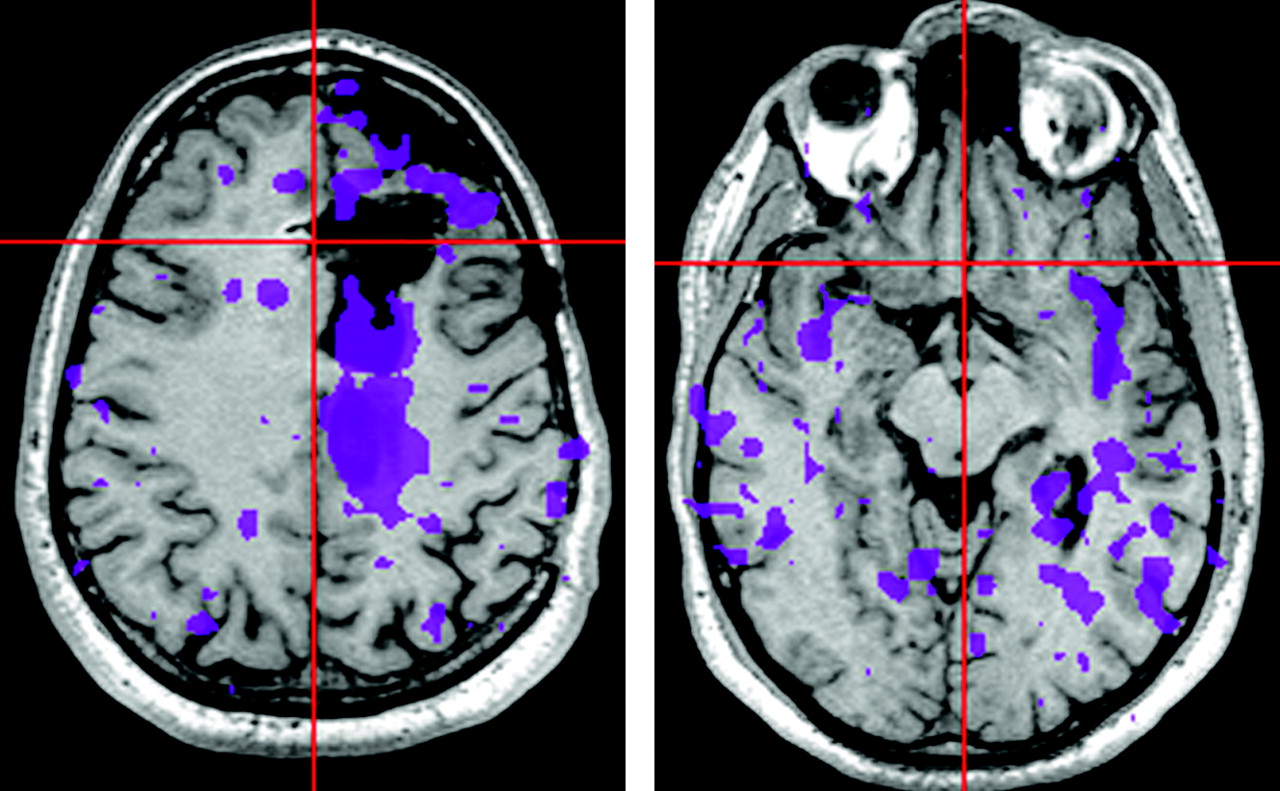
What is the practical implication for real fMRI data? In Fig 1, 2 different anatomic levels of a postsurgical fMRI patient study are shown. In the first row, the mask was generated by the SIM method1 by setting the threshold so that the tissue surrounding the brain in the raw BOLD EPI data was suppressed; signal intensity was 240. In the second row, the mask was generated by the SNR-based method,2 with the parameters described above and an expected BOLD signal intensity change of 1% (SNR > 82). Note the large differences in the mask in the region where the sinus susceptibility artifact exists, as well as near the surgical site. The third row demonstrates a very different mask based on a 0.5% BOLD signal intensity change (SNR > 164). The lower level of BOLD change may be expected in patients with disease. The lower 2 rows are based on SNR, statistical confidence, and BOLD signal intensity changes, whereas the first row is based on the SIM, a number that has very little meaning.1
I am encouraged that the authors are concerned about the impact of image quality, artifacts, and signal intensity voids on the interpretation of clinical fMRI and have done some excellent work to illuminate this problem. We should, however, proceed carefully when developing a method to demonstrate confidence in the activation maps. Using an arbitrary method may “mask” the clinical utility of BOLD imaging.


The color overlays represent regions that have sufficient levels of confidence to interpret the brain activation map. The 3 different rows represent different methods and conditions. The first row shows the SIM method based solely on the static image intensity. The second and third rows are based on a statistical model, BOLD signal intensity change and the temporal SNR. The second row indicates where it is possible to detect a 1% or greater BOLD signal intensity change. The third row represents where a 0.5% or greater BOLD signal intensity change can be detected. Smaller BOLD changes are likely to take place in clinical patients because of abnormal physiology and poor performance because of the presence of a lesion. It is clear that the temporal stability of these data are not sufficient to detect small BOLD changes.
Reply:
We thank Dr. Parrish for his comments on the relationship of susceptibility and signal intensity–to-noise ratio (SNR) for confidence levels in clinical functional MR imaging (fMRI). We welcome the discussion of these issues and laud him for his comprehensive investigation of the effects of temporal SNR on blood oxygen-level dependent (BOLD) time course analyses.1
The statements and example of a signal intensity map (SIM) that Parrish includes in his letter, however, do not match our experience. In our study, each SIM threshold was individually matched to the patient’s echo-planar imaging (EPI) data, thus eliminating the possibility for errors incurred by use of an arbitrary threshold applied across all datasets.2 In our experience, as demonstrated by the examples for SIM formation in Figs 1–3 of our article, SIM is sensitive to regions of signal intensity loss produced by magnetic susceptibility effects when conventional echo-planar BOLD imaging is used. In all of our cases, EPI susceptibility effects in regions of frontal and basilar sinuses were delineated by the SIM. The intent of our report was to evaluate the SIM as an indication of susceptibility-induced artifact upon the interpretation of clinical fMRI mapping. These susceptibility-induced artifacts are substantially stable during the course of a fMRI time series acquisition. Therefore, within this limited assessment, the static SIM provides an adequate means for evaluation. A version of the SIM is relatively easy to produce on a clinical system and thus offers widespread utility to fMRI users.
Parrish et al1 have applied the temporal nature of the fMRI acquisition to further evaluation of BOLD sensitivity. We appreciate the importance of their report and encourage fMRI users to become familiar with the significance of their findings. Temporal SNR measurements provide information about the BOLD signal intensity stability that is not contained within a static SIM, and indeed it is our practice to produce both types of signal intensity evaluation maps for our fMRI studies.
We regret any misunderstanding that might have led Dr. Parrish to question our report on the utility of a SIM. We are gratified by the forum for discussion of these issues, particularly when the opportunity leads toward increased awareness of limitations and capabilities for clinical fMRI.
References
- Copyright © American Society of Neuroradiology
In this issue


Related Articles
Cited By...
- No citing articles found.