
Abstract
BACKGROUND AND PURPOSE: We evaluated the effects of varying tube voltage, current per rotation, and section thickness on detectability of 2- and 4-Hounsfield unit (HU) differences on brain CT between normal and ischemic gray matter within 6 hours of ischemia onset, by using a low-contrast phantom.
METHODS: The phantom with an attenuation of 36 HU corresponding to normal gray matter contained 2 sets of spheres (34 HU and 32 HU) corresponding to the early CT signs of ischemic brain and complete infarction, respectively. The reproducibility of the CT numbers and the contrast-to-noise ratio (CNR), defined as the CT number difference between the background (36 HU) and the spheres (34 HU or 32 HU) divided by the SD of the background CT number were measured. Five radiologists rated the phantom images for detection of the low-contrast spheres by visual inspection.
RESULTS: The CT numbers were reproducible within 1 HU with a tube current of ≥150 mAs at 120 kVp. The CNRs for the 34- and 32-HU spheres were positively correlated with the tube voltage, tube current per rotation, and the section thickness. A CNR of 1.0 was obtained for the 34-HU sphere when scanning was conducted with a section thickness of 10 mm at 120 kVp and 700 mAs, or 135kVp and 450 mAs, respectively. A significant improvement of the accuracy of detection was found with increasing tube current, tube voltage per rotation, and section thickness.
CONCLUSION: Our study indicated that the 2-HU hypoattenuation corresponding to the early CT sign of acute ischemic stroke can be detected by using appropriate parameter settings.
Intravenous or intra-arterial thrombolysis for acute ischemic stroke is one of the therapies of choice to facilitate the recanalization of occluded arteries and restore cerebral perfusion.1–5 Although the administration of tissue plasminogen activator has been shown to improve the 3-month outcome of patients, it has also been reported to be associated with a significant increase in the incidence of fatal hemorrhagic infarction.6–8 Fatal hemorrhagic complications after thrombolysis occur especially in patients with early CT signs of brain infarction. Therefore, the presence of early CT signs involving more than one third of the brain territory supplied by the middle cerebral artery has been regarded as an exclusion criterion for acute thrombolysis.9, 10
The hypoattenuation of ischemic brain parenchyma during the initial phase of ischemia is rather subtle6, 11–13 and quite difficult to detect reliably by visual inspection.7, 8, 13–17 This subtlety of the hypoattenuation during the early ischemic phase is a major factor contributing to the low interobserver agreement of brain CT findings in these cases. In the first European Cooperative Acute Stroke Study, one half of the protocol violations were caused by failure to recognize the early CT signs of ischemic brain.2 One way to improve the detectability of this subtle hypoattenuation is an appropriate setting of the viewing parameters. Lev et al reported that a soft-copy review with variable window width and center level significantly increased the accuracy of detection of the early CT signs of infarction within 6 hours of the onset.18 Another method is optimization of the CT acquisition protocol to detect very-low-contrast lesions.
The purpose of this study was to evaluate the effect of the acquisition parameters—namely, the tube voltage, tube current per rotation, and the section thickness—on accuracy of detection of the 2-Hounsfield unit (HU) difference between normal and ischemic gray matter within 6 hours of stroke onset. A specially designed low-contrast phantom was prepared to model early CT signs of ischemic brain and complete brain infarction. The detectability of the low-contrast phantom was evaluated by quantitative analysis of the phantom and visual inspection of the phantom images.
Methods
Low-Contrast Phantom
A low-contrast cylindrical phantom (Kyoto Kagaku, Kyoto, Japan) was used to simulate the typical contrast of both early cytotoxic brain edema and complete cerebral infarction on brain CT images. The phantom was 18 cm in diameter and was made of acrylic resin, providing a nominal attenuation of 36 HU at a scanning tube voltage of 120 kVp. Although the CT number of the gray matter is variable depending on the CT data acquisition parameters, previous studies have reported the CT number of the gray matter to be 35 HU19 or 33 HU.20 Because the mean CT number of normal deep gray matter obtained with our CT scanner by using routine data acquisition parameters (tube current of 400 mAs and tube voltage of 120 kVp) was 36.2 ± 3.1 HU in 10 male patients without ischemic stroke, we assumed the representative CT number of normal gray matter to be 36HU. The phantom consisted of 2 sets of 3-, 2-, and 1-cm-diameter acrylic resin spheres, the nominal attenuation of each of which was adjusted to 34 HU and 32 HU, corresponding to the hypoattenuation on CT of early ischemic brain damage and complete infarction, respectively. These values were determined according to the study results of Kucinski et al, who reported that the CT number of ischemic brain decreased by 0.4 HU every hour during the first 6 hours after stroke onset.21 The composition of the phantom elements is summarized in Table 1. The center of all the spheres was located along a single axial plane, referred to as the “test plane” in this article. An additional annulus to simulate conventional radiographic absorption by the skull was attached to the exterior of the phantom. The annulus was 1 cm in thickness and was made of epoxy resin, producing a nominal attenuation of 500 HU at 120 kVp. The k edge of the phantom was 15 keV, which was less than the conventional radiographic spectra (effective energy, 50 keV) produced by the CT scanner during normal operation.22 Figure 1 shows an overview of the phantom and its representative CT images of the phantom scanned at the test plane.

Low-contrast phantom. Phantom overview before CT scanning (A) and representative phantom image (window width, 100 HU; window level, 35 HU) (B). Two sets of 3-, 2-, and 1-cm-diameter acrylic resin spheres were embedded in an 18-cm-diameter cylindrical phantom. The attenuation was adjusted to 32 HU in one set of spheres (arrowheads), corresponding to complete cerebral infarction, and 34 HU in the other set of spheres (arrows), corresponding to early ischemic brain damage. The attenuation of the cylindrical phantom was 36 HU, corresponding to normal gray matter.
Composition of the phantom
Experimental Setup
A commercially available 4-element multidetector row CT system (Acquilion Multi, Toshiba, Japan) was used in this study. The physical performance of the CT scanner was in accordance with the manufacturer’s specifications, and the HU calibration was performed by the manufacturer’s engineers by using a specific stability test object. The phantom was placed at the end of the patient table via an attachment provided as an optional accessory. It was then carefully positioned such that the test plane of the phantom was parallel to the axial plane, and the center of the phantom was at the isocenter of the scan. All measurements were performed in the axial (nonhelical) mode.
Assessment of the HU Reproducibility
Because the aim of this study was to detect subtle differences in attenuation, the reproducibility of the CT numbers (ie, the temporal homogeneity of the measured HU values) was considered to be important for accurate evaluation. Therefore, the variability of repeatedly measured CT numbers for the same object was evaluated before assessing subtle image contrasts. The phantom was scanned at the test plane by using a detector configuration of 5 mm × 4 rows, a field-of-view of 24 cm, and a large focal spot size. Acquisitions were made by using tube voltages of 80, 100, 120, and 135 kVp, and a tube current per rotation of 10 mAs and from 50 to 800 mAs in 50-mAs increments. For each acquisition, an image with a section thickness of 5 mm was reconstructed with a reconstruction algorithm (FC20). The FC20 algorithm was provided as a standard reconstruction algorithm with a beam-hardening correction for adult head CT scans. Because no other reconstruction algorithms or filters are used routinely for head scans at our institute, no other combinations were tested in this study. The scan was performed 14 times on different days during a 3-month period. The mean CT numbers of the largest lower contrast sphere (diameter, 3 cm; attenuation, 34 HU) were measured in all images by placing a circular region of interest with a diameter of 2 cm on each image. The region of interest was carefully positioned by one of the authors (C.T.) at the center of the sphere to minimize the effect of partial volume averaging. The distribution range of the measured CT numbers (the difference between the maximum HU value and the minimum HU value) was used as the index of reproducibility. If the range difference was <1.0 HU under a given set of acquisition parameters, the experimental setup, including the phantom and the CT scanner specifications, was considered to be satisfactory for reproducible evaluation of the CT numbers for quantitative assessment of subtle changes of the image contrast (ie, the temporal homogeneity of the CT numbers was confirmed).
Quantitative Assessment of the Image Quality
The phantom was imaged at the test plane by using the same detector configuration as above. For each acquisition, 3 images with different section thicknesses (5, 10, and 20 mm) were reconstructed by using an FC20 algorithm. The 3-cm-diameter spheres with an attenuation of 32 or 34 HU were selected as the regions of assessment. Circular regions of interest with a diameter of 20 mm were positioned by one of the authors (C.T.) at the center of the spheres and on the cylinder background. Because the detection of low-contrast objects is dependent on both image contrast and image noise, the contrast-to-noise ratio (CNR) was used to quantify the image quality. The CNR was calculated by subtracting the mean CT number in the region of interest on each sphere from that in the background cylinder and dividing the result by the SD of the mean CT number in the region of interest on the cylinder’s background.23, 24 Thus, a CNR of 1.0 was obtained when the contrast (ie, the difference in attenuation) between a sphere and its background was equal to the image noise measured by the SD.
Visual Assessment of the Image Quality
Five radiologists inspected the phantom images obtained with various scan protocols described above. The image set consisted of images scanned at the test plane (“signal” images) and those at an off-center phantom plane along section direction that did not contain spheres (“noise” images). The images were presented on a display with 36-HU center level and 80-HU window width. Observers were asked to determine the presence of 34- and 32-HU 3-cm spheres according to a 5-degree scale of confidence (5 = definitely seen; 4 = probably seen; 3 = possibly seen; 2 = probably not seen; and 1 = definitely not seen). No time limit was imposed for interpreting the phantom images, and lighting conditions were kept constant. Sensitivities, specificities, and accuracies were computed by defining rating ≥3 as positive for hypoattenuation. The significance of difference in sensitivity, specificity, and accuracy was examined by Wilcoxon test.
Dosimetry
Dose measurement was performed on an anthropomorphic Anderson phantom by using thermoluminescent dosimeters (TLDs). The TLDs were distributed inside the phantom. Absorbed doses were estimated by averaging the TLD values measured under tube currents of 200, 250, and 300 mAs, and tube voltages of 120 and 135 kVp.
Results
Reproducibility of Measurements
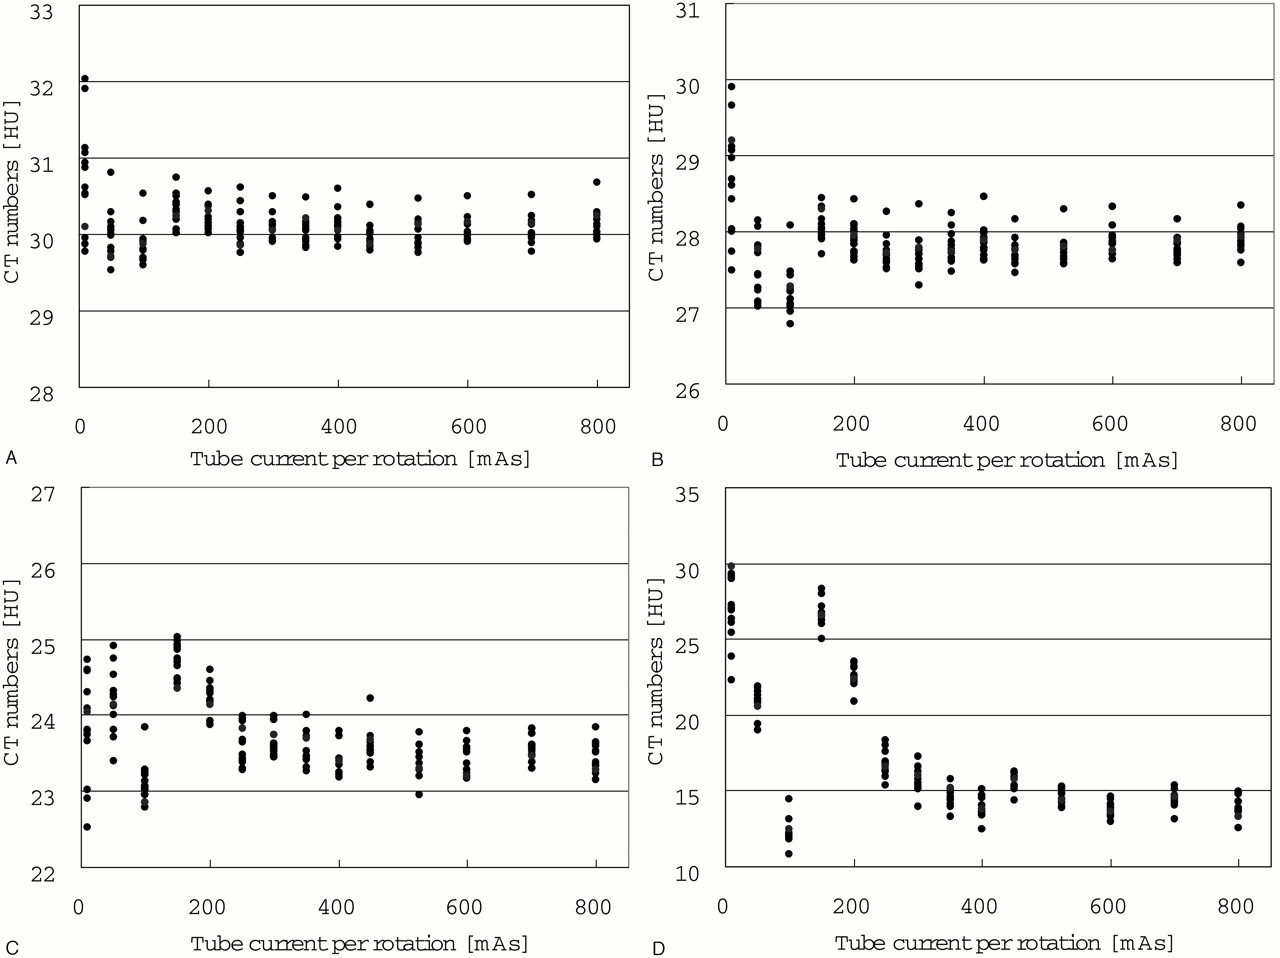
The HU values were stable (to within 1 HU) when the acquisition was performed with a tube current of 50 mAs or more at a tube voltage of 135 kVp, of 150 mAs or more at a tube voltage of 120 kVp, and of 250 mAs or more at a tube voltage of 100 kVp (Fig 2A–C). When the tube voltage was 80 kVp, the fluctuation of the HU values exceeded 1 HU for all of the tube currents used (Fig 2D).

Reproducibility of the HU values. The HU values obtained in 14 examinations performed on different days were plotted against various tube currents. The tube voltages were (A) 135 kVp, (B) 120 kVp, (C) 100 kVp, and (D) 80 kVp. The section thickness was fixed at 5 mm for all the measurements.
Quantitative Assessment of the Image Quality
The CNR for the 34-HU sphere with section thicknesses of 5, 10, and 20 mm was plotted against the tube current per rotation (Fig 3). The CNR was found to be positively correlated with both the tube current and the section thickness. For a section thickness of 10 mm, a CNR of 1.0 was obtained when a tube current and tube voltage of 450 mAs and 135 kVp, or 700 mAs and 120 kVp, respectively, were used. For a section thickness of 20 mm, a CNR of 1.0 was obtained when a tube current and tube voltage of 250 mAs and 135 kVp, or 350 mAs and 120 kVp, respectively, were used. For a section thickness of 5 mm, a CNR of 1.0 could not be obtained with any of the tube voltages and tube currents used. The CNR for the 32-HU sphere was obviously higher than that for the 34-HU sphere at a tube voltage of 120 kVp at a section thickness of 5 mm (Fig 4). It is noteworthy that a CNR of 1.0 was obtained for a 32-HU sphere at a tube current of approximately 300 mAs, whereas it was not possible to achieve a CNR of 1.0 at any tube current used for the 34-HU sphere.


Effect of tube voltage, tube current, and section thickness on the contrast-to-noise ratio (CNR). The section thicknesses were (A) 5 mm, (B) 10 mm, and (C) 20 mm, respectively. The CNRs obtained at different tube voltages were plotted against the tube current.

Effect of tube current on the CNR in the 34-HU and 32-HU spheres. The CNRs for the 32-HU and the 34-HU spheres were separately plotted against the tube current. The tube voltage and section thickness were fixed at 120 kVp and 5 mm, respectively.
Visual Assessment of the Detectability
Table 2 summarizes the mean sensitivity, specificity, and accuracy of detection by the 5 radiologists. For the 34-HU sphere, the sensitivity and accuracy of detection were significantly improved by increasing the tube voltage and tube current. In addition, the 20-mm section thickness significantly improved the detectability. For the 32-HU sphere, increase of the tube current and/or voltage did not result in any significant increase of the sensitivity, specificity, or accuracy of detection.
Visual assessment of the low contrast phantom
Absorbed Dose
The absorbed doses were 20.3, 24.8, and 29.2 mGy with the tube currents of 200, 250, and 300 mAs, respectively, when the tube voltage was fixed at 120 kVp. The absorbed doses were 26.5, 32.4, and 38.2 mGy with the tube currents of 200, 250, and 300 mAs, respectively, when the tube voltage was fixed at 135 kVp.
Discussion
Acute brain ischemia induces an increase in the water content of the ischemic brain tissue.25–27 Earlier studies indicated that the magnitude of this increase of the water content was well correlated with the CT number of the affected area.28, 29 Kucinski et al recently reported a gradual decline of the CT number by 0.4 HU every hour during the first 6 hours after the onset of acute ischemic stroke.21 The mean reduction of CT number was reported to be 1.3 HU at 2.5 hours after the onset. These studies indicated that differences of 2–4 HU must be recognized to detect early CT signs of ischemic brain damage during the early hours after the onset of ischemic stroke.19
We first evaluated the reproducibility of the CT number of the 34-HU spheres. The fluctuation was <1.0 HU when the usual scan parameters were used (120 kV, 150 mAs); however, when a tube current <150 mAs was used, fluctuation >1.0 HU was observed. Thus, use of a tube current <150 mAs is considered to be inappropriate for the detection of early CT signs of ischemic brain damage.
Higher image contrast and lower image noise would be desirable for detecting low-contrast objects. Intrinsic image contrast can be improved by using a lower tube voltage.30–32 The tube voltages of 100 kVp and 80 kVp did not improve the CNR in our study, however, which implies that image noise rather than the image contrast may be the predominant factor for the detection of low-contrast phantoms. Image noise can be reduced with an increase of the tube voltage.31, 32 Image noise can also be improved by using a higher tube current, because it is inversely proportional to the square root of the photon flux. Consistent with these theoretical considerations, the CNR and the confidence level of low-contrast phantom detection were enhanced with increasing tube voltage and tube current. With scanning at a section thickness of 10 mm, the CNR increased from 0.8 obtained at 400 mAs and 120 kVp, to 1.0 at a tube current and voltage of 700 mAs and 120 kVp, or 450 mAs and 135 kVp, respectively.
The use of higher tube voltage and/or higher tube current directly increases the irradiation dose to the patients. The absorbed dose measured was 29.2 mGy when the scanning was conducted at a tube voltage of 120 kVp and tube current of 300 mA. It increased by approximately 15% for every 50-mA increase in tube current and by 30% for every 15-kVp increase in tube voltage. When the scanning was conducted under the standard settings (tube current and tube voltage of 400 mAs and 120 kVp, respectively), the absorbed dose was estimated to be approximately 38 mGy. The radiation dose was estimated to be 65 mGy for a tube current and voltage of 700 mAs and 120 kVp, respectively, and 56 mGy for the tube current and voltage of 450 mAs and 135 kVp, respectively.
Section thickness is another factor that influences the image noise. In this study, scanning at a section thickness of 5 mm did not provide an appropriate CNR at any of the tube currents or voltages employed, because of the quantum noise. Although the use of thinner sections might improve the detectability of small lesions, a section thickness of 5 mm was not found to be appropriate for the detection of the 2-HU difference of the low-contrast phantom in this study.
Although scanning at 20-mm thickness improved the detectability of the low-contrast phantoms within an acceptable radiation dose, this would be difficult to obtain in the clinical setting. On the other hand, 20-mm-thick images can be easily generated by combining 2 adjacent 10-mm-thick images by using a pixel-by-pixel-based adding operation, because most CT scanners, including conventional single-detector row CT scanners, have several image processing features available on their console.
In this study, we performed a visual review of the phantom images, because detection of subtle hypoattenuation relies on human perception by radiologists. Our results indicated that the use of a higher tube voltage, higher tube current, and greater section thickness significantly improved the accuracy of detection of low-contrast objects, which is consistent with the results of theoretical analysis based on the CNR.
Conclusion
The image noise, rather than the radiation contrast, was found to be the predominant factor influencing the detectability of the present low-contrast phantom mimicking acute brain infarction. The 2–4-HU hypoattenuation could be reliably detected by increasing the tube voltage and tube current per rotation, with scanning at 10-mm section thickness within an acceptable radiation dose. Retrospective generation of 20-mm-thick images by combining 2 adjacent 10-mm-thick images may also help in improving the detectability of a low-contrast phantom and early CT signs of ischemic brain damage.
Footnotes
This study was supported by the grant-in-aid for “Monitoring Acute Cerebral Infarction by means of CT and MR,” 2002–2005, by the National Cardiovascular Center, Japan, and the Ministry of Health, Labor, and Welfare, Japan.
References
- Received March 18, 2005.
- Accepted after revision May 27, 2005.
- Copyright © American Society of Neuroradiology
In this issue


Jump to section
Related Articles
Cited By...
- No citing articles found.