
Abstract
BACKGROUND AND PURPOSE: The ability to assess tumor malignancy and monitor treatment response noninvasively would be of value to both clinicians and animal investigators. This report describes the MR imaging characteristics of a genetically engineered mouse model of choroid plexus carcinoma (CPC) during tumor growth and progression to malignancy. We assess the ability of vessel tortuosity measurements, as calculated from high-resolution MR angiographic (MRA) images, to detect emerging CPC cancers.
METHODS: MR images of 9 healthy mice and of 20 CPC mice with precancerous choroid dysplasia or with cancer over a wide range of sizes were analyzed. Two vessel tortuosity measures and a measure of vessel attenuation (vessel count) were calculated from MRA images. Malignancy assessment was based upon a statistical analysis of vessel tortuosity, by using an equation derived from an earlier study of human brain tumor patients.
RESULTS: Choroid dysplasia was correctly judged nonmalignant. On the basis of vessel count, neoangiogenesis could not be detected until cancers were full-blown and had reached a volume of approximately 80 mm3. Vessel tortuosity measurements, however, correctly identified emerging malignancy in lesions larger than 0.3 mm3.
CONCLUSION: To the best of our knowledge, this report provides the first description of in vivo, MR imaging characteristics of genetically engineered CPC mice during the progression from dysplasia to cancer. Vessel tortuosity measurements offer promise of correctly defining even tiny tumors as malignant.
The ability to assess tumor malignancy and monitor treatment response noninvasively would be of high value in the treatment of human brain tumors. Unfortunately, despite the development of multiple imaging modalities, reliable assessment of both tumor malignancy and therapeutic response remains problematic.1–4 Particular difficulty may be encountered with the classification of small tumors.
This report describes a new approach that quantifies vessel shape as measured from high-resolution MR angiographic (MRA) images. An intriguing observation made by those working from histologic sections is that malignancy induces characteristic vascular morphologic changes, described as “a profound sort of tortuosity, with many smaller bends upon each larger bend.”5 Conventional radiographic angiographers have also noted that malignancy tends to be associated with “irregular coursing of vessels” of “bizarre configuration.”6 This abnormal tortuosity may be related to increases in nitrous oxide induced by vascular endothelial growth factor (VEGF)7 and is found in a wide variety of malignant tumors including those of the breast,8 brain,9 colon,10 and lung.11
Important to those interested in MR imaging, these morphologic abnormalities are neither confined to tiny, new capillary sprouts nor restricted to tumors of large size. Instead, these morphologic changes occur very early during malignant tumor growth, appear within 24 hours of injection of a few tens of cancer cells in animal xenograft models, and affect initially healthy vessels that course far beyond tumor confines.12 Of additional importance, successful treatment induces rapid normalization of the associated vessel tortuosity abnormalities,12, 13 which suggests that quantitative monitoring of these vascular shape changes could provide an effective means of assessing treatment response.14 Equally important, cancer-associated changes to vessel shape do not appear to simply mirror the degree of tissue vascularity depicted by perfusion imaging, but rather provide complementary information.15
Our group has developed quantitative measures of vessel tortuosity that can be applied to vessels defined from MRA images.16 In a recent blinded study of 30 human brain tumors imaged before total gross resection of each lesion, all tumors but one were correctly judged benign or malignant on the basis of vessel shape.17 This study included a variety of tumors difficult to classify by other means, including hypervascular benign tumors, irradiated and necrotic cancers, and hemorrhagic lesions.
An important and unresolved issue, however, is how large a tumor must be before cancer-associated vessel shape changes can be perceived by MRA. All of the tumors evaluated in the blinded study were either at least moderately large (≥1 cm3) or presented as a miniscule additional lesion in a patient with a much larger tumor. If very tiny lesions could be classified correctly as benign or malignant, a method based upon vessel shape analysis might be used to screen patients for emerging new tumors. The determination of how large a cancer must be before MRA images can capture vessel shape abnormalities is difficult to define in human subjects, however, because whole-brain histologic information is not available and tiny lesions are only rarely biopsied.
A logical means of addressing this question is to employ genetically engineered mouse models. In these murine tumor models, the manipulation of genes known to be associated with particular cancers induces tumors that arise spontaneously and in the appropriate anatomic locations.18–20 Unlike human subjects, however, whole-brain histologic information is available so that the information provided by histology can be used to assess the accuracy of any proposed noninvasive imaging method.
The current study evaluates vascular morphologic changes associated with a well-characterized, genetically engineered mouse model of choroid plexus carcinoma (CPC). In this model, mice are born apparently healthy. At approximately 3 weeks of age, mice develop choroid dysplasia that, at about 5 weeks, progresses to the development of tiny, solid, spherical, noninfiltrating cancers and then to massive lesions that become life-threatening at about 12 weeks. This progression of a noninfiltrating, brain-displacing cancer from a microscopic to a huge malignancy simulates the growth of a metastatic lesion, but the genetically engineered mouse model provides conditions under which a cancer is guaranteed to emerge at approximately known time and location.
The purpose of this paper is 2-fold. First, we describe the MR imaging characteristics of emerging CPC tumors in genetically engineered mice. Although a previous publication has described the MR appearance of massive CPC tumors,21 the current report is, to our knowledge, the first to describe the MR imaging characteristics of these genetically engineered tumors as they dedifferentiate and grow.
Second, we assess a new method of grading tumor malignancy in detecting small tumors. This method defines vessels mathematically from MRA images and calculates quantitative measures of tortuosity. In human subjects, we have defined a statistical “malignancy probability” (MP) equation that, for each test subject, compares vessel tortuosity values within a region of interest to the vessel tortuosity values calculated over the same anatomic region of a set of healthy subjects.17 Questions to be answered by the current study are (1) whether the MP equation derived from human subjects can correctly classify mice with choroid dysplasia as having benign disease, (2) whether the same equation can correctly classify mice with large tumors as having cancer, and (3) how large an emerging cancer must be before MRA imaging can successfully define a sufficient degree of tortuosity abnormality for the MP equation to define the emerging lesion as malignant. If predictive, such studies in a defined preclinical model could be used to refine the detection of human malignancy and could be instrumental in assessing preclinical therapeutic responses.
Methods
This report analyzes the images of 9 healthy mice and 20 CPC (TgT121;p53+/−) mice ranging from 3 weeks to 4 months of age. The work was approved by the University of North Carolina Institutional Animal Care and Use Committee.
Animal Tumor Subjects
The TgT121;p53+/− mouse is derived by mating a B6.D2-Tg(LPV-TagT121)tvd mouse (TgT121) with a B6.129S2-Trp53tm1Tyj mouse (p53−/−). Genotype is determined by polymerase chain reaction as described elsewhere.22 The TgT121 mouse is on a mixed background of approximately 50% C57BL/6J (B6) and 50% DBA/2J (DBA/2J). The p53−/− mouse is on a 100% C57BL/6J background such that TgT121;p53+/− mice are approximately 75% C57BL/6J and 25% DBA/2J.
Specifically in choroid plexus epithelium, TgT121 mice express a truncated 121–amino acid SV40 T antigen mutant that binds to and inactivates the tumor suppressor pRb and related proteins p107 and p130. This induces dysplasia by 3 weeks of age, which progresses over time to CPC. Progression is accelerated in a p53+/− background and occurs within a reproducible timeframe of 6–8 weeks with clonal loss of p53. By postmortem histologic assessment, multiple such CPC foci can be detected within the CPC, with one or more tumors becoming massive and life threatening by 12 weeks of age. Penetrance of this phenotype is 100%.22, 23
For the current study, 10 mice were imaged at a stage at which large or moderately large tumors were expected (8–12 weeks) and 10 mice were imaged at an earlier stage (3–7 weeks) likely to show either no cancer or early cancer development. One subject was imaged twice, first at an early and then at a late stage.
MR Imaging
All images were acquired on a 3T Allegra head-only scanner (Siemens Medical, Erlangen, Germany) with a maximum gradient strength of 40 mT/m and a slew rate of 400 mT/m/millisecond. A custom-made volume coil measuring 2.1 cm in diameter was used. Imaging sequences included a precontrast 3D T1-weighted sequence (30-mm2 field of view [FOV]; 0.1 × 0.1 × 1.0 mm3 voxel size; TR, 500 milliseconds; TE, 13 milliseconds; 4 averages; and TA, 8: 46) and a T2-weighted sequence (30-mm2 FOV; 0.1 × 0.1 × 1.0 mm3 voxel size; TR, 6990 milliseconds; TE, 100 milliseconds; 4 averages; and TA, 11: 20). A high-resolution, noncontrast, 3D time-of-flight (TOF) MRA sequence was employed for acquiring MRA images (17-mm2 FOV; 0.1 × 0.1 × 0.1 mm3 voxel size; TR, 53 milliseconds; TE, 8.79 milliseconds; 2 averages; 256 × 256 resolution; and TA, 23: 11). Following an intraperitoneal injection of 0.5 mL gadolinium, enhanced T1-weighted images were acquired with identical parameters as above. Total image acquisition time was approximately 1 hour.
Isoflurane, an inhalant anesthesia, was mixed with air and administered to animals at 2% induction and 1% maintenance through a nose cone. All mice were stereotactically immobilized before imaging.
Image Processing
Following image acquisition, all images were transferred to a computer for postprocessing. Image processing time was approximately 1.5 hours. Details of the imaging processing methods and of the statistical approach employed are given in the Appendix. In brief, the approach involved a computerized, statistical comparison of measures of vessel shape between the 9 healthy mice and each of the 20 test subjects over an anatomic region of interest. For tumors >50 mm3, the region of interest was delineated by the tumor margins itself; for smaller tumors or if no tumor was evident by MR imaging, the region of interest was taken to be the lateral and third ventricles. Tumor volumes were additionally calculated if a tumor was visible by MR imaging, regardless of tumor size. Each tumor animal’s vessel shape parameters were normalized (z scored) by the means and SDs of the healthy mouse values. Results here are reported for the following parameters in each tumor mouse.
Tumor volume (TV, in mm3).
For animals with more than one tumor delineable by MR, the TV is given as the total tumor volume in that mouse.
Normalized vessel count (nVC).
The vessel count gives the number of individual, unbranched vessels contained within or passing through a region of interest. Output is an integer. The VC provides a measure of vessel attenuation as seen by MRA. When normalized, a value of −1 implies a count 1 SD below the healthy mean and a value of 2 a count 2 SDs above the healthy mean.
Normalized sum of angles metric (nSOAM).
The SOAM is a tortuosity measure that is elevated in the presence of high-frequency, low-amplitude vessel sine waves or coils. The SOAM sums the angles between consecutive trios of points along a space curve and normalizes by the path length.16 The SOAM for a region of interest is expressed as the average SOAM of the vessels lying within that region. Results are output as radians/mm. The SOAM value is almost invariably elevated for cancer-associated vasculature.
Normalized inflection count metric (nICM).
The ICM is a tortuosity measure that measures larger amplitude curves than SOAM. The ICM counts “inflection points” along each space curve and multiplies this number (+1) times the total path length and then divides by the distance between end points. For a 3D space curve, we define an inflection point as a locus that exhibits a minimum of total curvature. In particular, the normal and binormal axes of the Frenet frame24 change orientation by close to 180° as the frame passes through an inflection point. As a result, one can search for 3D inflection points by identifying large local maxima of the dot product ΔN × ΔN, where N is the unit vector representing the Frenet normal axis, and ΔN represents the difference of the normal axes associated with the consecutive points Pk and Pk +1. The ICM for a region of interest is expressed as the average ICM of the vessels lying within that region. Results are output as a dimensionless number.16 The ICM value is often elevated in the presence of cancer.
Malignancy probability (MP).
The probability of malignancy on a scale of 0%–100%, given by an equation that employs nSOAM and nICM.17 A value >60% is viewed as indicative of malignancy, a value <40% is viewed as indicative of benign disease, and a value of 40%–60% is considered indeterminate.
Histology
Mouse brains were fixed in 10% formalin and embedded in paraffin. Early in the study, mouse brains were cut in half along the sagittal midline and sectioned for 10 successive layers by using sagittal sections at 50-μm intervals, as has been customary for the Van Dyke group.22 Later in the study, one or more regions of interest were selected from inspection of the mouse MR images, and the mouse brain was sectioned at 50-μm intervals within these regions. For these later studies, the plane of section was coronal to approximately match the plane of cut of the MR images. A 5-μm section from each layer was then stained with hematoxylin-eosin (H&E).
Results
Imaging Characteristics of CPC Mice during Tumor Development
In TgT121;p53+/− mice, the first step toward tumor development is the emergence of choroid dysplasia. Figure 1 illustrates T1, T2, and MRA sections from an animal with choroid dysplasia, as well as a histologic section taken from this animal and a 3D rendering of the segmented vessels. We were not able to detect the presence of choroid dysplasia on the basis of either MR imaging or by vessel analysis in any such animal, and both the MR images and the segmented vessels appeared normal.
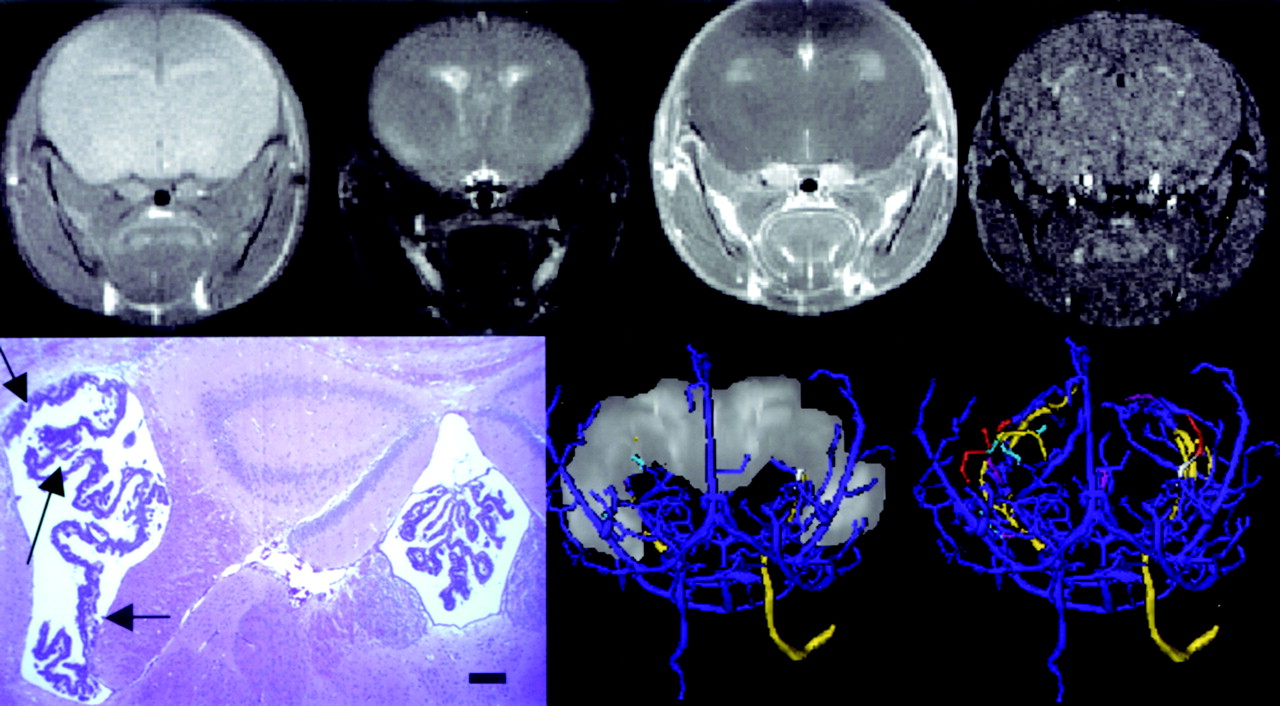
Choroid dysplasia. Top row, left to right, coronal T1, T2, T1-GAD, and MRA sections. Bottom row, left, H&E–stained coronal histologic section. Bar = 200 μm. Note the thickened and somewhat disorganized choroid at left (arrows). Center and right, 3D segmented vessels with the ventricular system shown at full opacity (center) and no opacity (right). Vessels are shown from an anteroposterior (AP) view and are color-coded relative to the ventricular system with blue (outside), gold (traverse), red (inside), and cyan (exit or enter). Vessel analysis was performed upon all red vessels and upon the segments of the gold and cyan vessels lying within the region of interest. This case is tumor 19 in Table.
As choroid dyplasia progresses into cancer, tiny foci of tumor appear within the ventricular system, resembling peas lying within a ventricular pod. Although tiny, these tumors are highly malignant. These cancers are often best perceived on T2 images, in which they appear as filling defects against the bright white of the CSF (Fig 2). Gadolinium-enhanced T1 images do not demarcate these tiny lesions well. Because we were not able to define tiny tumors on more than one section, the ventricular system was again taken as the region of interest. We were unable to appreciate any increase in vessel count by MRA imaging at this stage of tumor development; however, even though these tumors were very small, the associated vessels exhibited severe tortuosity abnormalities, indicative of high malignancy (Fig 3).

Emerging cancer. Top row, left to right, T1, T2, T1-GAD, and MRA sections. Arrow points to multiple, tiny cancers visible in the T2 image. Bottom row, left, H&E histologic section. Note the tiny cancer foci (arrows). Bar = 200 μm. Center and right, 3D rendering of segmented vessels with the segmented ventricular system shown at full (center) and no (right) opacity from an AP view. Vessel color coding is as outlined in Fig 2. This case is tumor 15 in the Table.
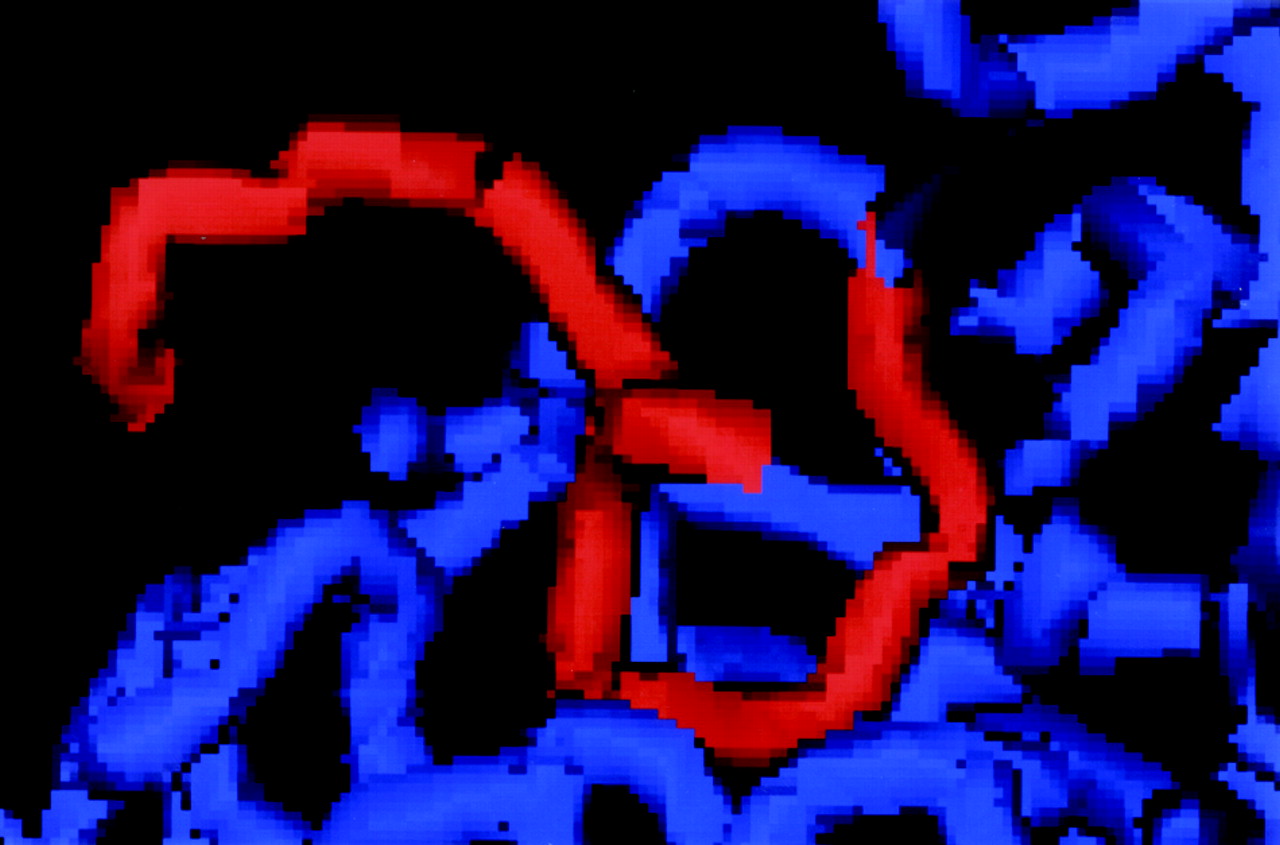
Typical vessel tortuosity abnormality in one of the CPC mice during early cancer development. Note the “many bends upon each larger bend” present in the highlighted (red) vessel.
Figure 3 provides an example of the typical kind of vessel tortuosity abnormality seen with malignancy. Whereas healthy vessels tend to bend and curve along relatively smooth paths, cancer-associated vasculature tends to exhibit “many smaller bends upon each larger bend.”5
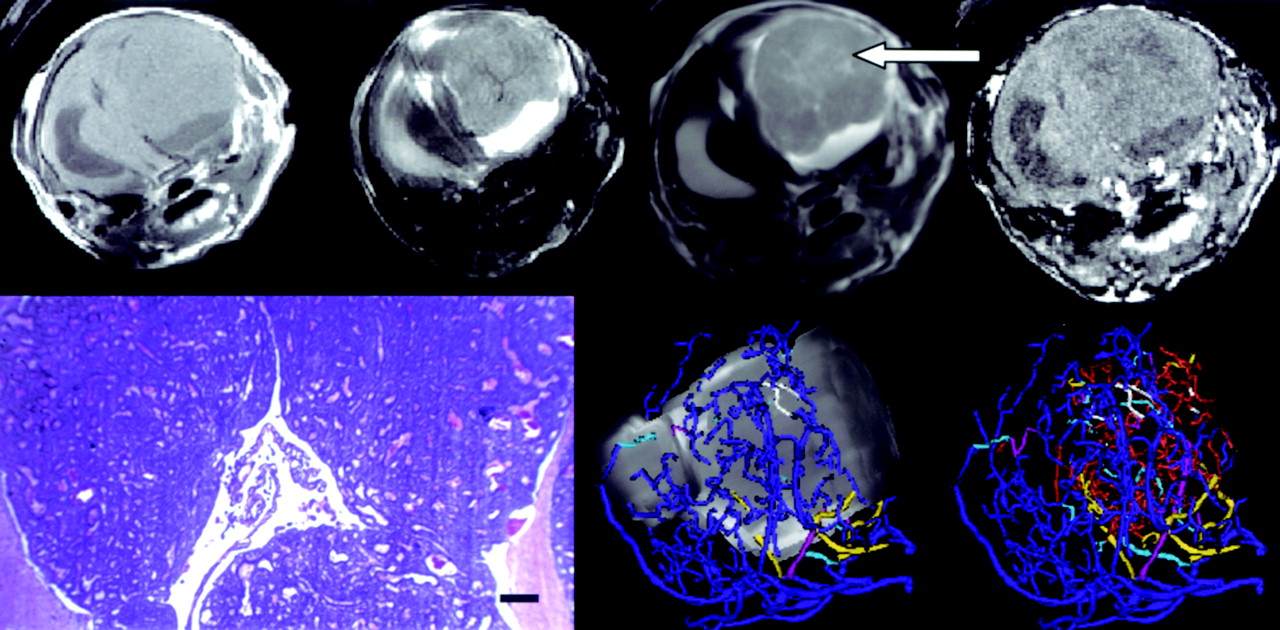
Once cancer is established, growth is rapid and leads to the emergence of massive cancers that occupy close to the entire ventricular system, expand the skull, and produce death within a matter of weeks. Figure 4 provides an example of this kind of massive tumor. Note that these large intraventricular tumors can again be defined well on T2 images but now can also be defined as well or better on gadolinium-enhanced T1 images, in which the tumor now enhances relative to brain and is often surrounded by a brighter shell of CSF (Fig 4). By vessel analysis of the MRA images, all such tumors exhibited an increase in vessel number and also displayed severe vessel tortuosity abnormalities indicative of malignancy.

Terminal CPC tumor. Top row, a massive tumor is shown from left to right in T1, T2, T1-GAD, and MRA sections. Arrow points to the tumor as seen on T1-Gad. The contralateral ventricular system is dilated. Bottom row, left, H&E histologic section from this animal. Bar = 200 μm. Center and right, 3D rendering of an AP view of segmented vessels and with the segmented tumor shown at full (center) and no (right) opacity. Vessel color coding is outlined in Fig 2. This tumor is case 5 in the Table.
Vessel Attribute Analysis
The Table provides a summary of vessel attribute values for each animal, sorted by total tumor volume. Normalized (z-scored) VC, SOAM, and ICM values are given for each mouse, as is the overall assessment of malignancy calculated via vessel tortuosity. The number of discrete tumors visualized by MR is also provided, as is a brief description of tumor presentation. Tumors are here classified by volume into 4 categories: huge (>120 mm3), large (50–120 mm3), small (1–50 mm3), and tiny (<1 mm3).
Vessel attribute analysis
As reported in Table 1, tumors could reach massive size. For those tumors with a volume >80 mm3, we could detect significant increases in vessel attenuation as measured by the normalized VC. We were unable to detect a significant increase in vessel number in tumors <50 mm3 as imaged by MRA, however, and these tumors generally exhibited a VC within 1 SD of normal.
Vessel tortuosity measurements indicated a high probability of malignancy, however, not only for large tumors but also for those <50 mm3. Indeed, the malignancy probability estimates were equivalent for all tumors >1 mm3, as is consistent with the histology of these cancers.
The limit of vessel tortuosity assessment in detecting malignancy in these CPC tumors appears to occur with tumor volumes in the range of 0.3–1 mm3. In one mouse with a tumor volume of 1.1 mm3 the malignancy probability was correctly calculated to be 99%; however, in 2 mice with single tiny tumors (0.3 mm3) the malignancy probability assessment was indeterminate in one case and provided a false-negative in the second.
Discussion
This report discusses the MR characteristics of a well-characterized, genetically engineered mouse model of CPC during tumor growth and progression. Most research addressing the imaging of tumor-associated vasculature has focused upon microvasculature and vascular attenuation. By contrast, the current report focuses upon the vessel shape changes associated with vessels individually discernible from high-resolution MRA.
CPC tumors are heavily neoangiogenic. All 5 of the cancers >120 mm3 analyzed in this report exhibited massive increase in the number of vessels visualized by MRA, with a mean vessel count more than 6 SDs greater than the healthy mean. These results are consistent with our previous report based upon manual vessel counts on histologic sections, in which terminal animals were found to have vessels counts 7 SDs greater than those of animals sacrificed at an early age.22 The current study was unable to detect a significant increase in vessel number for small tumors, however, and almost all animals with a tumor volume <50 mm3 exhibited a vessel count within 1 SD of that found in healthy mice. This result also appears consistent with vessel counts performed on histologic sections of animals with small tumors (C. Yin and T. Van Dyke, unpublished report). The lack of change in vessel count by MRA of small tumors, however, could also reflect the inability of this method to visualize vessels of diameter smaller than that of the voxel size used during image acquisition; the neoangiogenic vessels lying within or supplying small tumors are themselves likely to be small.
Far more interesting is the result of vessel tortuosity measurement and the application of a malignancy probability equation derived from these tortuosity values. Even if MRA imaging is incapable of detecting an increase in vessel number for small tumors, our results suggest that a statistical analysis of vessel tortuosity may correctly identify the presence of tiny cancers for tumors larger than approximately 0.3 mm3. These findings are consistent with those of Li et al,12 who illustrate that cancer-associated vessel tortuosity changes affect initially healthy vessels and are not restricted to tiny, neoangiogenic sprouts within the capillary bed.
The use of vessel tortuosity measures to monitor tumor progression and therapeutic response is appealing for several reasons. First, like many other imaging procedures, the method is entirely noninvasive. Second, the fact that vessel tortuosity abnormalities occur even in tiny malignancies, spread beyond the confines of a cancer’s margins, and affect vessels much larger than those of the capillary bed12 means that tortuosity assessment has the potential of recognizing even tiny tumors as malignant, which has been a difficult problem for many alternative techniques. Third, the development of vessel tortuosity abnormalities does not appear to be directly related to blood flow.15 Vessel tortuosity analysis thus may offer a complementary approach to perfusion imaging. Fourth, abnormal vessel tortuosity resolves rapidly with effective treatment,7, 12, 13 making the approach potentially useful for rapid assessment of treatment in human subjects and for therapeutic development and assessment in preclinical murine models. Finally, the vessel-shape changes characteristic of malignancy occur in cancers throughout the human body and across species, making the general approach potentially applicable to a wide variety of applications.
Given a mathematical description of segmented vessels, a wide variety of vessel attributes are potentially available for analysis. The current report examines only vessel count and 2 tortuosity measures, because these are the 3 attributes that have seemed most useful when analyzing human brain tumor patients. Additional parameters such as average vessel radius, change in radius, branching frequency, branching angle, and a variety of other vessel attributes might be useful in analyzing other disease processes or in following an individual over time. An advantage of the proposed approach is that it is immediately extensible to an arbitrary number of parameters.
A limitation of the technique is that tortuosity assessment requires delineation of the paths of individual vessels. It is therefore impossible to incorporate information about vessels whose diameters are smaller than those of the voxels employed during image acquisition. This study employed nonenhanced MRA images. Although gadolinium enhancement can increase the number of vessels visualized by MRA, it also tends to opacify large CPC tumors, making it difficult or impossible to define vessels within the tumor margins. This study therefore did not employ gadolinium-enhanced MRA. CT angiography (CTA) can visualize smaller vessels than MRA. We did not employ CTA, however, because our approach is based upon a statistical comparison of vessel numbers and shapes across subjects. The difference in circulation times between different individuals makes CTA injection timing difficult. For our purposes, if the injection were timed too late, it might miss the small vessels critical to our approach, and if timed too early it would be likely to “white out” the tumor, making it impossible to discriminate individual vessels within the tumor boundaries. Moreover, MR is more sensitive to tumor delineation than is CT. MR/MRA therefore seemed a better choice for the current study.
A second limitation of the technique, as currently implemented, is that it requires delineation of a region of interest. When a tumor is large and readily perceptible on MR it is reasonable to take the tumor margins as the region of interest, as we have done in human subjects17 and in the largest of the murine CPC tumors evaluated in the current report. When searching for very tiny tumors, the genetically engineered CPC mouse model has the particular advantage that emerging cancers are restricted to the ventricular system, and so the ventricles can be used as the region of interest. For human patients, however, the location of an emerging metastasis or other cancer cannot be predicted in advance. A global search for emerging cancer by using measurements of focal vessel shape abnormalities will thus require the creation of an atlas of healthy subjects, in which each voxel contains local vessel shape statistics. Such an atlas is currently under development for the brains of human subjects.
Because our approach cannot image capillaries, it would be of interest to compare perfusion imaging with vessel tortuosity assessment and possibly to include perfusion imaging characteristics as one of the vessel attributes. Many groups are developing perfusion imaging techniques for the characterization of human brain tumors.4,25–27 Early work in human patients suggests that the information provided by vessel tortuosity measurements is different from that given by perfusion imaging.15 We have not yet compared perfusion imaging to vessel shape measurement in murine tumor models.
It may be initially surprising that a “malignancy probability” equation derived in human subjects can be directly applied to the mouse. Fully testing this hypothesis would require evaluation of a wide range of murine tumors and is beyond the scope of the current report. The fact the same equation appears to apply across species, however, can be explained if one assumes that cancer induces the same vascular changes regardless of species or anatomic region. Our approach normalizes each tumor subject’s vascular attribute values by the means and SDs of the values obtained in the same anatomic region from healthy subjects of the same species. In light of this normalization, similar cancer-induced changes to the underlying vasculature can then be recognized across species. Indeed, the fact that the same equation appears relevant to both humans and the genetically engineered CPC model supports the contention that the genetically engineered mouse model does indeed mimic human cancer successfully. One of the most potentially important uses of vessel tortuosity analysis for genetically engineered mouse tumor models is the early, noninvasive assessment of treatment response—a notoriously difficult problem in human patients. Furthermore, the similarity between human and mouse tumor vessel characteristics suggests that the murine spontaneous cancer models can indeed be utilized to refine imaging and mathematical analytical methods that are applicable across species.
Conclusion
This report is, to our knowledge, the first to describe the MR imaging characteristics of a genetically engineered, murine CPC tumor model during growth and progression. Furthermore, though MRA imaging cannot display vessels at the capillary level, a statistical, quantitative evaluation of vessel tortuosity based upon an equation derived from human subjects appears effective in assessing malignancy for cancers >0.3–1 mm3. Although much further work is required, the approach appears to hold promise for the noninvasive assessment of tumor staging and therapeutic monitoring.
Appendix
Segmentation of Vessels and of a Region of Interest
Vessels comprising the entire visible brain vasculature were segmented from the MRAs of all healthy controls and from all genetically engineered animals. The vessel segmentation method employs a semiautomated, multiscale approach that proceeds from user-supplied seed points to automatically define the path of each vessel and to calculate the radius at each vessel point.28 This method models a vessel in 3 steps: (1) definition of a seed point on or near a vessel of interest; (2) automatic, dynamic-scale extraction of an image intensity ridge representing the vessel’s central skeleton; and (3) automatic determination of vessel radius at each centerline point. During segmentation the vessel skeleton is set to a spline and the output defines each vessel as an ordered, regularly spaced set of x, y, z points indicating the spatial position of that vessel’s centerline with an associated radius at each point. In this report, we use the term “vessel” to indicate a single, unbranched structure.
Tumors were defined from T2 or T1-gadolinium enhanced images of tumor-bearing animals by using a program that defines tumors via polygon drawing and filling on orthogonal cuts through an image volume. For animals in which no tumors or only very tiny tumors were evident, the region of interest was defined as the contiguous space represented by the 2 lateral ventricles and the third ventricle. If <4 vessels intersected the region of interest the region was automatically dilated until 4 vessels were available for study.
Image Registration
Our statistical approach to assessment of tumor malignancy requires mapping a region of interest across subjects. Such mapping requires image registration.
For this study, we decided not to transform the vessels, because affine transformation might alter measurements of tortuosity and other vessel attributes, but rather to deform the region of interest across subjects. Vessels were thus analyzed only in their native states. All registrations were performed by using Rueckert and Schnabel’s mutual information-based registration program.29, 30 This program permits rigid, affine, and fully deformable registration. For rigid and affine registrations, the output can be saved as a file convertible to a registration matrix. For this project, we employed only rigid and full affine registrations and saved the output matrices.
The MRA of each tumor subject was registered by full affine registration to the MRA image of the first healthy mouse. The additional images of the tumor subject were then rigidly registered to that same subject’s MRA. Lesion coordinates from any tumor subject could then be transformed into the coordinate space of any subject’s MRA via a set of matrix multiplications, by using matrix inversion when appropriate. This approach requires only a single registration per image, regardless of the number of images to which a region of interest may be mapped.
Unlike human patients, mice with large tumors develop marked bulging of the skull. Registration of such images with the MRA of a healthy mouse is difficult because the brain and skull deform in mice with massive tumors, whereas the jaw does not. We therefore segmented the brains of all subjects, saving the output as gray-scale images and performed the registration by using only the brain. Following registration, vessels traversing the region of interest were clipped to that surface, and analysis was performed only upon vessel segments confined to the region of interest.
Statistical Analysis
In human beings (and presumably also the mouse), vessel attenuation, tortuosity, average radius, and a variety of other measures of vessel shape vary from location to location within the head.31 It is therefore not possible to define a single definition of “healthy” vessel morphology. The vessel shape changes induced by malignancy and other focal disease processes must therefore be interpreted within the context of the expected vessel shape measures within the affected region.
We therefore normalized each tumor vessel attribute by the means and SDs of the healthy measures derived from the same anatomic region of healthy controls of the same species. Each value was represented as a z score, and all further statistical processing was performed upon these z-scored values. For example, the z-scored SOAM value for a mouse tumor was given by 
A further advantage of this approach is that, because we employ averages of averages, the normality assumption of the measurements is plausible by the central limit theorem.
In human patients, a previous blinded study analyzed a variety of vessel shape measures from MRA images of both benign and malignant brain tumors, by using z-score values as outlined above.17 By using these z-score values, 3 methods—including linear discriminant analysis, quadratic discriminant analysis, and nonparametric classification trees—were employed to select the classification rule most effective in separating benign from malignant tumors. All 3 methods identified SOAM and ICM as the only important factors and resulted in similar classification error rates. Therefore, only the results of the linear discriminant analysis, the simplest classification rule, were employed.
More specifically, 2 equations were derived from the z-scored SOAM and ICM values by linear discriminant analysis. The first equation below represented the summarized mean measure for the malignant group. The second equation represented the summarized mean measure for the benign group: 

The probability of malignancy was then 

This equation provides a continuous measure with values between 0 and 1, in which higher values indicate a higher probability of malignancy. Multiplying by 100 provides an estimate of malignancy as a percentage. In general, this equation indicates that the parameters important to detecting the vessel shape abnormalities of malignancy are the 2 tortuosity measures, with SOAM (which detects high-frequency “wiggles”) of more importance than the ICM (which detects wider excursion curves).
Acknowledgments
This work was supported, in part, by R01 EB000219 NIH-NIBIB. We are grateful to Daniel Rueckert for his registration program.
References
- Received May 8, 2005.
- Accepted after revision August 2, 2005.
- Copyright © American Society of Neuroradiology


