
Abstract
SUMMARY: Using data obtained from 3D digital subtraction angiography acquisitions, computational fluid dynamics techniques were used first to assess hemodynamic factors in geometrically correct models of 3 paraclinoid aneurysms and then again for assessment after virtual removal of the aneurysms and reconstruction of the parent artery. Simulations revealed an area of relatively low and rotating wall shear stresses at the location at which each aneurysm had developed. This phenomenon, to our knowledge, has not been previously described.
There has been extensive speculation in the literature about possible hemodynamic influences in the formation of cerebral aneurysms.1,2 A number of possible factors, such as wall shear stresses and dynamic pressure, have been considered, but it has not yet been possible to make comparisons of the hemodynamic conditions before and after aneurysm formation. Using a recently developed algorithm for approximating the shape of the artery before aneurysm formation in 3 dimensions (based on techniques described by Karmonik et al3), computational hemodynamic simulations that use human patient geometric data have been performed for arterial flow with and without the aneurysm present. As a result, significant correlations have been found between certain functions of the wall shear stress and the location of eventual aneurysm formation. Such observations could be useful in identifying possible sites prone to aneurysm development.
Methods
3D Digital Subtraction Angiography (3D-DSA)
3D-DSA image data of 3 paraclinoid aneurysms were retrospectively obtained from imaging studies done as part of diagnostic evaluations. Data were obtained with C-arm systems (Axiom Artis; Siemens Medical Systems, Erlangen, Germany). For the virtual reconstruction of the parent artery across the aneurysm ostium, an in-house–developed software plug-in for the image postprocessing workstation Leonardo (Siemens) was used. Figure 1, A–C, shows the 3D-DSA images for the 3 cases. The section of the artery across the aneurysm neck was virtually reconstructed by interpolation between the adjacent proximal and distal parts of the parent artery as an approximation to the geometry of the parent artery before aneurysm formation. For more details, see Karmonik et al.3

A–C, Lateral views (DSA) of 3 sidewall aneurysms of the paraclinoid internal carotid artery. The aneurysms vary in their orientation to the vessel axis.
A, (Case I) the aneurysm dome extends more distally than proximally.
B, (Case II) the dome extends more proximally than distally (as opposed to A).
C, (Case III) the dome extends equally in both directions.
Insets in A and C show the aneurysms in tangential projections according to their orientation laterally from the right internal carotid artery (ICA) (A), and medially from the left ICA (C).
D–F, The 3D computational domain, obtained from 3D angiography of the 3 aneurysms, is shown. D and F are aligned according to their orientation in the insets of A and C.
G–I, Geometries in identical projection to D–F, respectively, after artificial removal of the aneurysms by using a smoothing algorithm. The inset in Fig G, oriented according to the initial DSA (A), was chosen to highlight the effects of wall shear stress at the ostium plane for case I. Its orientation is identical to J showing the ostium “en face” and to the one in Fig 3, A–D.
J–L, “En face” projections of the aneurysm ostium (transparent grids).
Computational Hemodynamic (CHD) Modeling
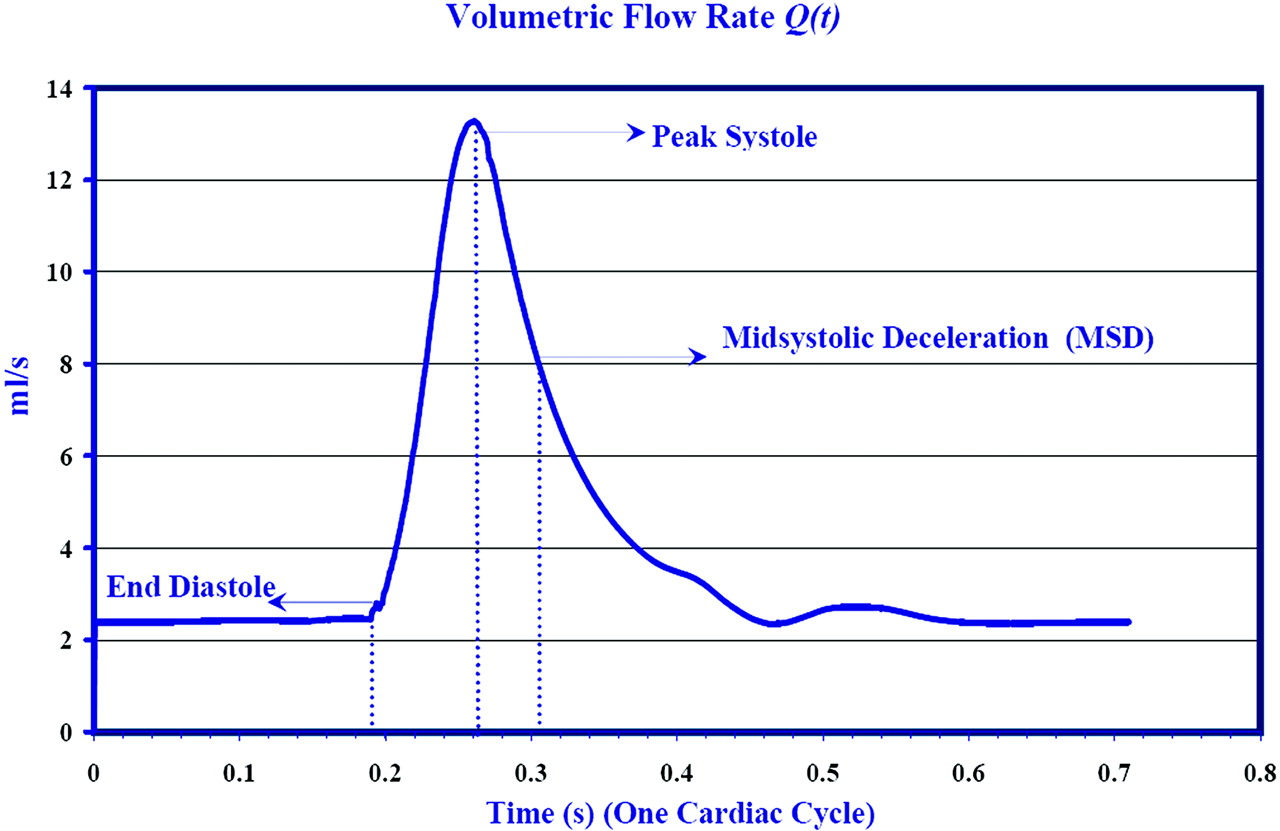
In the work discussed here, arterial geometries obtained from patients, as described above, were converted to a stereolithographic file format and transferred to a geometric modeling and computational mesh generating software code, Gambit (Fluent, Lebanon, NH). After some smoothing and geometric remodeling, computational meshes of various degrees of refinement were generated. Blood was modeled as an incompressible fluid with a density of 1050 kg/m3 and a viscosity of 0.0035 kg/m/s. For the unsteady flow simulations, a time-dependent pressure gradient was imposed to match the flow waveform, Q(t), Fig 2. Numerical convergence test studies showed that 105,000 finite elements were adequate to capture the flow. Time-stepping tests were performed to verify temporal convergence.4 Results discussed below used 710 time-steps over one cardiac cycle.

Flow waveform, Q (t) (based on Ku et al), obtained as a solution to the imposed pressure gradient. At 0.192s diastole ends, followed by peak flow rate at 0.281 s. Maximum amplitude in the secondary flow velocities is achieved during midsystolic deceleration (MSD) at t = 0.305 s. Results of the simulations are shown subsequently at these 3 critical times of the cardiac cycle.
Results
Because the results of the simulation are not specific to case I but are generic to all the cases analyzed and because of the brevity of this manuscript as a technical note, we shall be discussing only case I in detail. A more detailed presentation of results and their discussion of the hemodynamics in cases II and III will be given in a subsequent publication.
Aneurysm Geometries
The 3 cases studied involved sidewall aneurysms in the carotid artery with differing orientations and are shown in Fig 1, D–F from a perspective that optimizes the visualization of aneurysms. The corresponding “preaneurysm” geometries after virtual removal of the aneurysms, at locations indicated by white arrows, are shown in Fig 1, G–I. The upstream and downstream geometries of these models are essentially identical to those in Fig 1, D–F; they are smoothly connected across the aneurysm segment, minimizing geometric artifacts. A second perspective, normal to a plane cutting through the ostium, is shown in Fig 1, J–L.
Unsteady Flow
To model unsteady flow, a modified Ku waveform5 was used to define the basic arterial flux, Q(t). Simulations were run through several cycles to eliminate transient effects associated with flow initialization.
Wall Shear Stress
The wall shear stresses (WSS) for flows before and after aneurysm formation at end diastole and peak systole for case I are shown in Fig 3. Contours of WSS are overlaid with WSS vectors (black arrows). For better visualization, the lengths of these vectors have been clipped to match the magnitudes of the WSS in the area of eventual aneurysm development. The length of WSS vectors during end diastole correspond to a magnitude of 5 Pa or less and 30 Pa or less during peak-systole. Blue corresponds to a spatial minimum WSS (stagnation zone) and red corresponds to a spatial maximum. The presence of the aneurysm seems to have relatively little effect on the flow away from the aneurysm site. (The WSS vectors were not plotted in the regions of high WSS to enhance the clarity of the figure.)

(Case I) Distribution of wall shear stresses (WSS) in the internal carotid artery at the level of the aneurysm in case I. A and C represent the conditions before aneurysmal development (based on artificial aneurysm removal as described above) at end diastole (A) and peak systole (C), whereas B and D show the conditions after aneurysm development, respectively. The WSS vectors (small black arrows), clipped to display the WSS behavior mainly in the vicinity of the aneurysm, are superimposed on contour plots of WSS magnitude. Blue corresponds to spatial minimum and red corresponds to spatial maximum. Range of WSS magnitudes: A and B, 0–16 Pa; C and D, 0–100 Pa. Range of WSS vectors: A and B, 0–5 Pa; C and D, 0–30 Pa. Note that the WSS in the area of subsequent aneurysm development (A and C) is relatively low at both end diastole and peak systole. The random orientation of these vectors indicates a stagnation zone in this area.
It is striking that WSS spatial distributions are similar at the 2 opposite phases of the cycle, in flows before and after aneurysm formation. This suggests that pulsatility does not significantly affect the location of maxima and minima over most of the endothelial surface but merely causes the amplitudes to oscillate in response to the changing pressure gradient.
The largest shear stresses are seen to occur near the bends in the arterial segment, neglecting the very high stresses near the inlet and outlet that are caused by numerical boundary condition artifacts. WSS in the artery near the aneurysm location are comparatively small both before and after aneurysm formation. However, in preaneurysm flow, WSS has a local spatial minimum (at both phases of the cycle) at the location of eventual aneurysm formation. The seemingly random orientation of WSS vectors at this location indicates a stagnation zone.
Velocity Vector Field
The secondary flow patterns can be visualized by using velocity vectors projected in a cross-sectional plane perpendicular to the arterial axis (Fig 4A, -B) at end-diastole and midsystolic deceleration (MSD).

(Case I) Secondary flow (flow perpendicular to the vessel axis) patterns visualized by using velocity vectors projected in a cross-sectional plane perpendicular to the vessel axis. Lateral view (A) and “en face” view (B) of the cross-sectional plane. Note that A was generated by rotating (1G) counter-clockwise 90°. This was done to better visualize the area of aneurysm development located mainly on the medial side of the vessel wall. C and D correspond to velocity vectors superimposed on the contours of secondary velocity magnitude during end diastole (C) and midsystolic deceleration (MSD) (D) for case I. Note that the strength of eddies increases during the deceleration phase of systole, which contributes to the formation of stagnation zone. E and F show the velocity vectors for case I at MSD (prior and post aneurysm development), emphasizing the change in the pattern as a result of formation of aneurysm. Range of velocity magnitude: C, 0–5.45 m/s; D, 0–1.3 m/s; E, 0–1.3 m/s; F, 0–1.3 m/s. Range of secondary flow vectors: C, 0–5.133 m/s; D, 0–0.675 m/s; E, 0–0.675 m/s; F, 0–0.72 m/s.
For preaneurysm flow, the arterial cross-section is nearly circular (because of artificial excision); flow direction is normal to the page, and the inner bend is to the right. Curvature of the mean (ie, primary) flow implies that the fluid particles experience a centrifugal force. Because this force is balanced by a weak pressure gradient, the fluid near the axis is pushed toward the outer-bend wall, a phenomenon known as “Dean flow,”6 as can be seen from Fig 4C, -D. (This effect is independent of the cycle phase, with only the amplitudes of the secondary velocity being affected.) Fluid pushed toward the wall is then deflected back, forming 2 counter-rotating cells of secondary flow. These eddies are relatively weak during the accelerating phase of systole because the flow is dominated by the axial component of the velocity. However, during deceleration, there is a significant decrease in the magnitude of the axial component of the velocity, and the flow is dominated by the secondary flow component, namely the counter-rotating eddies. These eddies, therefore, gain strength during the deceleration phase of systole. At the stagnation zone, low WSS occurs because of the small axial velocities there. In the postaneurysm flow, Fig 4F, the asymmetry of the arterial cross-section implies that the secondary flow cells are not symmetric. The dividing plane between the 2 cells in the preaneurysm flow, Fig 4E, now corresponds approximately to the location of the ostium.
Proposed Prognostic Model: (Potential) Aneurysm Formation Indicator (AFI)
There seems to be a consensus that endothelial cells are most sensitive to temporal fluctuations in WSS, and various models have been proposed in the literature that attempt to quantify them.7–9 Most of these models use a reference vector, most commonly the time-averaged WSS vector, based on the supposition that the endothelial cells are preferentially aligned in the direction of this vector. The most commonly used indicator is the oscillatory shear index (OSI), which was proposed by Ku et al,9 where wssi is the instantaneous WSS vector.  To motivate the model, which attempts to distinguish arterial segments prone to aneurysm formation and healthy segments, consider the temporal variation of WSS. The indicator proposed herein accurately captures the instantaneous effect of WSS fluctuations on endothelial cells. Figure 3, discussed earlier, shows the preaneurysm case I, in which WSS magnitude at peak systole is compared with that at end diastole. WSSs are shown to be comparatively low at both times at the site where the aneurysm forms. This is in fact the case throughout the pulse cycle. From a closer examination of this region, it is clear that the direction of WSS changes significantly over the cycle. To quantify this change in direction, the cosine of the angle [cos (θ)] between the instantaneous WSS vector (wssi) and the time-averaged WSS vector (wssav) is computed.
  Contours of cos (θ) (the potential aneurysm formation indicator [AFI]) at midsystolic deceleration (just after peak systole) for case I are shown in Fig 5A. The prefix “potential” AFI is used to emphasize its tentative nature and the need for further investigation that is beyond the scope of this preliminary report.

Contour plot of the aneurysm formation indicator (AFI) at MSD. The blue color corresponds to complete reversal in wall shear stresses (WSS), green corresponds to a 90° rotation of WSS, and red implies that the instantaneous WSS vector aligns with the reference value, the temporal average of WSS. A, B, and C correspond to cases I, II and III, respectively. The insets show the location of the aneurysms. The most significant values of this indicator tend to correlate with the area of subsequent aneurysm development.
A more detailed temporal analysis shows that at end diastole, there is a small rotation of WSS, but that after peak systole, the effect is dramatically enhanced at the location of aneurysm formation. A contributing factor in the instantaneous WSS reversal are the counter-rotating eddies, Fig 4C, -D, which are strongest during the deceleration phase of systole. Although these eddies weaken during the acceleration phase of systole, they generate 2 stagnation zones for the secondary flow at the walls. During midsystolic deceleration, maximum reversal of WSS occurs.
Fig 5 also shows contour plots of the AFI for cases II and III; similar effects are observed. However, the intensity of the AFI indicator varies: in case III, a weaker reversal is noticed. The correlation between the location of the aneurysm and the location of WSS reversal is strong.
Discussion
A number of studies on cerebral blood flow that use computational fluid dynamics in combination with 3D-rotational angiography or CT analysis have recently been published.10–12 Steinman et al10 observed high-speed flow entering the aneurysm at the proximal and distal ends of the neck, promoting the formation of both persistent and transient vortices within the aneurysm sac. This produced dynamic patterns of elevated and oscillatory wall shear stresses distal to the neck and along the sidewalls of the aneurysm. Shojima et al11 were able to demonstrate that the average WSS of the aneurysm was significantly lower than that of the parent vessel. Tateshima et al13 studied the flow pattern of a wide-necked internal carotid artery-ophthalmic artery aneurysm by using Doppler velocimetry and particle imaging velocimetry. They found maximal flow velocities at the inflow and outflow zone at peak systole measuring 46.8% and 24.9% of that in the parent vessel and found that their side-wall aneurysm did not show a simple flow pattern as previously assumed. They emphasize the need for 3D flow studies based on 3D imaging of aneurysm geometry for better understanding of aneurysmal behavior after endovascular coil packing. Hoi et al12 observed elevated aneurysm WSS and enlargement of impingement zones in sidewall aneurysms, located at curved arterial segments, when the arterial curvature increased.
These observations are consistent with our own results showing a rather complex flow pattern in seemingly simple sidewall aneurysms of the paraclinoid artery. The reconstruction described in this report is more realistic than an earlier virtual arterial reconstruction,14 which was limited to 2 spatial dimensions. This is an important consideration, because the blood flow near and in the aneurysms, as in a normal cerebral artery, is strongly 3D. This approach chosen by us to evaluate retrospectively flow conditions in an assumed preaneurysmal stage is novel and has not been described in the literature. The seemingly random orientation and low amplitude of the WSS vectors at the location of aneurysm formation, which are revealed by the AFI, indicate a stagnation zone and weak flow reversal. Secondary flow variations at the walls contribute to the skewness of the WSS. During diastole, the wall shear stress in this region was less than 3 Pa. In cases I and III, significant values of the AFI centered on the location of the aneurysm were seen. However, in case II, although the zone of significant AFI values was in the region in which the aneurysm eventually developed, the values were skewed. Temporary reversal of WSS, as observed in the AFI contour plots, could trigger pathologic changes in the endothelial cells, leading to aneurysm formation. The present simulations support this cause-and-effect scenario. These effects are not as clearly indicated when time-averaged quantities, such as the OSI, are used.
Changes of the patients’ flow waveforms may significantly affect the hemodynamic stresses and pressures. Simulations with changing flow rates (reflecting changes in blood pressure) were performed, and changes in the magnitudes of the WSS and pressures were observed, but there were no major changes in spatial flow patterns. The maxima and minima in the WSS were still observed in the same locations of the arterial geometry even when the flow waveform was varied.
Limitations of the Study
In any discussion such as this, it is important to keep in mind the inherent limitations of computational hemodynamics (CHD) when applied to problems as complex as these.15 First, one could argue that the decrease in the magnitudes of the WSS in the region of aneurysm formation may be due to the increased radius of the parent vessel. However, this widening is seen only in case II. It is uncertain whether this widening existed before aneurysm formation in this particular case. It may have instead occurred during aneurysm development. Unavailability of realistic data of the arterial segment before aneurysm formation is one of the major limitations of our study. Several simulations conducted in idealized pipe geometries with curvatures similar to that of a carotid siphon did not show any significant changes in WSS patterns as a result of change in the diameter of the pipe. Low WSS magnitudes usually exist at the inner bends of the pipe because of the curvature effects. Change in the radius therefore does not affect the magnitudes significantly.
Second, changes of the patients’ flow waveforms may significantly affect the hemodynamic stresses and pressures. Simulations with changing flow rates (reflecting changes in blood pressure) were performed and changes in the magnitudes of the WSS and pressures were observed; however, no major changes in spatial flow patterns were observed. The maxima and minima in the WSS were still observed in the same locations of the arterial geometry even when the flow waveform was varied. Furthermore, based on our simulations of various convergence tests to verify the smoothing algorithm, we have observed that the small artifacts that may be caused by the smoothing algorithm did not induce large perturbations in the flow variables such as WSS.
Another limitation of this study is that the suggested AFI is based on an analysis of only 3 cases. We are aware of the need to analyze a larger number of aneurysms and more diverse and realistic vascular geometries in context with this variable. However, the correlation of the AFI signal intensity with the location of aneurysm formation in the arterial geometries seems strong. We therefore would conclude that AFI could be a potential indicator in predicting the sites in arterial segments prone to aneurysm formation.
Conclusions
By constructing a geometrically realistic approximation to the arterial geometry of the paraclinoid carotid artery before aneurysm formation, it has been possible through the use of CHD simulations to investigate hemodynamic factors that may contribute to aneurysm formation. Because the 3 patients studied here all developed cerebral aneurysms, the eventual anatomic outcome was known. It has been found that stagnation zones detected by the AFI coincide with aneurysm formation locations. Comparisons of flow simulations before and after aneurysm have led to better understanding of the possible hemodynamic factors that could trigger aneurysm formation. Strong contributory secondary flows were observed at eventual aneurysm formation sites. We have proposed here a new simple geometric measure, the “potential” AFI, that takes into account the alignment of the WSS vector with endothelial cells over the course of the cardiac cycle. This more descriptive indicator seems to correlate with aneurysm formation positions and may lead to better understanding of the pathogenesis of cerebral aneurysms.
References
- Received October 3, 2005.
- Accepted after revision December 9, 2005.
- Copyright © American Society of Neuroradiology
In this issue


Jump to section
Related Articles
Cited By...
- Hemodynamic Characteristics in Ruptured and Unruptured Intracranial Aneurysms: A Prospective Cohort Study Utilizing the AneurysmFlow Tool
- Evaluation of predictive models of aneurysm focal growth and bleb development using machine learning techniques
- Evaluation of predictive models of aneurysm focal growth and bleb development using machine learning techniques
- Relationship between cerebral aneurysms and variations in cerebral basal arterial network: a morphometric cross-sectional study in Computed Tomography Angiograms from a neurointerventional unit
- High Spatiotemporal Resolution 4D Flow MRI of Intracranial Aneurysms at 7T in 10 Minutes
- Simultaneous imaging of blood flow dynamics and vascular remodelling during development
- Quantifying Intracranial Aneurysm Wall Permeability for Risk Assessment Using Dynamic Contrast-Enhanced MRI: A Pilot Study
- Quantitative comparison of hemodynamic parameters from steady and transient CFD simulations in cerebral aneurysms with focus on the aneurysm ostium
- Generalized versus Patient-Specific Inflow Boundary Conditions in Computational Fluid Dynamics Simulations of Cerebral Aneurysmal Hemodynamics
- Role of Fluid Dynamics and Inflammation in Intracranial Aneurysm Formation
- Quantification of speed-up and accuracy of multi-CPU computational flow dynamics simulations of hemodynamics in a posterior communicating artery aneurysm of complex geometry
- Low Wall Shear Stress Is Independently Associated With the Rupture Status of Middle Cerebral Artery Aneurysms
- Vascular Geometry Change Because of Endovascular Stent Placement for Anterior Communicating Artery Aneurysms
- Hemodynamics and Anatomy of Elastase-Induced Rabbit Aneurysm Models: Similarity to Human Cerebral Aneurysms?
- Hemodynamics of Cerebral Aneurysm Initiation: The Role of Wall Shear Stress and Spatial Wall Shear Stress Gradient
- An objective approach to digital removal of saccular aneurysms: technique and applications
- Configuration of intracranial arteries and development of aneurysms: A follow-up study