Advertisement

Main menu

  • Home
  • Content
    • Current Issue
    • Accepted Manuscripts
    • Article Preview
    • Past Issue Archive
    • Video Articles
    • AJNR Case Collection
    • Case of the Week Archive
    • Case of the Month Archive
    • Classic Case Archive
  • Special Collections
    • AJNR Awards
    • ASNR Foundation Special Collection
    • Most Impactful AJNR Articles
    • Photon-Counting CT
    • Spinal CSF Leak Articles (Jan 2020-June 2024)
  • Multimedia
    • AJNR Podcasts
    • AJNR SCANtastic
    • Trainee Corner
    • MRI Safety Corner
    • Imaging Protocols
  • For Authors
    • Submit a Manuscript
    • Submit a Video Article
    • Submit an eLetter to the Editor/Response
    • Manuscript Submission Guidelines
    • Statistical Tips
    • Fast Publishing of Accepted Manuscripts
    • Graphical Abstract Preparation
    • Imaging Protocol Submission
    • Author Policies
  • About Us
    • About AJNR
    • Editorial Board
    • Editorial Board Alumni
  • More
    • Become a Reviewer/Academy of Reviewers
    • Subscribers
    • Permissions
    • Alerts
    • Feedback
    • Advertisers
    • ASNR Home

User menu

  • Alerts
  • Log in

Search

  • Advanced search
American Journal of Neuroradiology

American Journal of Neuroradiology

ASHNR American Society of Functional Neuroradiology ASHNR American Society of Pediatric Neuroradiology ASSR
  • Alerts
  • Log in

Advanced Search

  • Home
  • Content
    • Current Issue
    • Accepted Manuscripts
    • Article Preview
    • Past Issue Archive
    • Video Articles
    • AJNR Case Collection
    • Case of the Week Archive
    • Case of the Month Archive
    • Classic Case Archive
  • Special Collections
    • AJNR Awards
    • ASNR Foundation Special Collection
    • Most Impactful AJNR Articles
    • Photon-Counting CT
    • Spinal CSF Leak Articles (Jan 2020-June 2024)
  • Multimedia
    • AJNR Podcasts
    • AJNR SCANtastic
    • Trainee Corner
    • MRI Safety Corner
    • Imaging Protocols
  • For Authors
    • Submit a Manuscript
    • Submit a Video Article
    • Submit an eLetter to the Editor/Response
    • Manuscript Submission Guidelines
    • Statistical Tips
    • Fast Publishing of Accepted Manuscripts
    • Graphical Abstract Preparation
    • Imaging Protocol Submission
    • Author Policies
  • About Us
    • About AJNR
    • Editorial Board
    • Editorial Board Alumni
  • More
    • Become a Reviewer/Academy of Reviewers
    • Subscribers
    • Permissions
    • Alerts
    • Feedback
    • Advertisers
    • ASNR Home
  • Follow AJNR on Twitter
  • Visit AJNR on Facebook
  • Follow AJNR on Instagram
  • Join AJNR on LinkedIn
  • RSS Feeds

AJNR is seeking candidates for the AJNR Podcast Editor. Read the position description.

Research ArticleBRAIN

Evaluation of Delayed Neuronal and Axonal Damage Secondary to Moderate and Severe Traumatic Brain Injury Using Quantitative MR Imaging Techniques

A.E. Mamere, L.A.L. Saraiva, A.L.M. Matos, A.A.O. Carneiro and A.C. Santos
American Journal of Neuroradiology May 2009, 30 (5) 947-952; DOI: https://doi.org/10.3174/ajnr.A1477
A.E. Mamere
  • Find this author on Google Scholar
  • Find this author on PubMed
  • Search for this author on this site
L.A.L. Saraiva
  • Find this author on Google Scholar
  • Find this author on PubMed
  • Search for this author on this site
A.L.M. Matos
  • Find this author on Google Scholar
  • Find this author on PubMed
  • Search for this author on this site
A.A.O. Carneiro
  • Find this author on Google Scholar
  • Find this author on PubMed
  • Search for this author on this site
A.C. Santos
  • Find this author on Google Scholar
  • Find this author on PubMed
  • Search for this author on this site
  • Article
  • Figures & Data
  • Info & Metrics
  • Responses
  • References
  • PDF
Loading

Abstract

BACKGROUND AND PURPOSE: Traumatic brain injury (TBI) is a classic model of monophasic neuronal and axonal injury, in which tissue damage mainly occurs at the moment of trauma. There is some evidence of delayed progression of the neuronal and axonal loss. Our purpose was to test the hypothesis that quantitative MR imaging techniques can estimate the biologic changes secondary to delayed neuronal and axonal loss after TBI.

MATERIALS AND METHODS: Nine patients (age, 11–28 years; 5 male) who sustained a moderate or severe TBI were evaluated at a mean of 3.1 years after trauma. We applied the following techniques: bicaudate (BCR) and bifrontal (BFR) ventricle-to-brain ratios; T2 relaxometry; magnetization transfer ratio (MTR); apparent diffusion coefficient (ADC); and proton spectroscopy, by using an N-acetylaspartate/creatine (NAA/Cr) ratio measured in normal-appearing white matter (NAWM) and the corpus callosum (CC). The results were compared with those of a control group.

RESULTS: BCR and BFR mean values were significantly increased (P ≤ .05) in patients due to secondary subcortical atrophy; increased T2 relaxation time was observed in the NAWM and CC, reflecting an increase in water concentration secondary to axonal loss. Increased ADC mean values and reduced MTR mean values were found in the NAWM and CC, showing damage in the myelinated axonal fibers; and decreased NAA/Cr ratio mean values were found in the CC, indicating axonal loss.

CONCLUSIONS: These quantitative MR imaging techniques could noninvasively demonstrate the neuronal and axonal damage in the NAWM and CC of human brains, secondary to moderate or severe TBI.

Traumatic brain injury (TBI) is among the most frequent causes of neurologic morbidity and mortality, mainly in young adults. In the United States, the annual incidence of closed TBI is estimated at 130–150 per 100,000 people per year.1 TBI is classically a model of a monophasic neuronal lesion, in which brain tissue damage, including neuronal and glial cells injury, results from transfer of kinetic energy to the brain. Neuronal and axonal damage may result from a direct lesion at the moment of impact, often found in gray and white matter (WM) at the site of impact and on the contralateral side.

WM tracts can have diffuse axonal injury (DAI) as a result of traumatic shearing forces that occur when the head is rapidly accelerated or decelerated. It usually results from twisting or rotational forces. The true extent of axonal injury typically is worse than that visualized by using current imaging techniques. DAI typically occurs in the corpus callosum (CC), brain stem, and subcortical WM regions.

It is logical to believe that neuronal injury is limited to the acute and subacute phases after the traumatic event, followed by a short time of subsequent retrograde and anterograde (or wallerian) axonal degeneration. Once this process ends, stabilization of the neuronal injury would be expected. However, experimental studies have shown that delayed cerebral changes occur after TBI, particularly demonstrated by progression of cerebral atrophy, proposing a delayed progressive neuronal loss.2,3

Delayed neuronal loss after TBI is similar to other neurodegenerative processes. Previous studies have suggested that there is an association of TBI and an increasing incidence of delayed neurodegenerative diseases (particularly Alzheimer disease) in this group of patients.4,5 It thus becomes clear that evaluation and quantification of this delayed neuronal loss after TBI could play an important part of the clinical survey.

Recently, MR imaging has been considered as a promising noninvasive technique to evaluate axonal and neuronal injury, by using special sequences with quantitative analysis, such as volumetric measurement, ventricle-to-brain ratio, relaxometry, proton MR spectroscopy (1H-MR spectroscopy), magnetization transfer, and diffusion-weighted imaging (DWI).

The purpose of this study was to test the hypothesis that these noninvasive MR imaging quantitative techniques can identify and estimate the following biologic changes involved with neuronal and axonal loss after moderate and severe TBI: cerebral atrophy, assessed with bicaudate (BCR) and bifrontal (BFR) ventricle-to-brain ratios; extracellular-space enlargement and gliosis, assessed with apparent diffusion coefficient (ADC) and T2 relaxometry; damage to the cytoskeleton of axonal fibers and demyelination, assessed with ADC and magnetization transfer ratio (MTR); and N-acetylaspartate (NAA) reduction, assessed with 1H-MR spectroscopy.

Materials and Methods

Approval for this study was obtained from the Institutional Research Ethics Committee at Medical College of Ribeirão Preto, University of São Paulo, and written informed consent was obtained from all subjects.

Nine subjects (5 male; age, 21.1 ± 5.0 years; range, 11–28 years) with a history of moderate or severe TBI and good recovery were evaluated after >2.5 years from the traumatic event by using MR imaging. All subjects were recruited as volunteers to participate and undergo the MR imaging examination; they were exclusively devoted to this study. The eligible subjects were interviewed by the principal investigator before inclusion. Subjects with drug addiction, alcoholism, or any comorbidity were excluded.

Severity of TBI was defined as follows: severe TBI, Glasgow Coma Scale (GCS) score of ≤8; moderate TBI, a GCS score of 9–12. The results were compared with those of a control group comprising 9 healthy volunteers with a matched age and sex distribution (5 male; age, 21.8 ± 4.8 years; range, 13–28 years). The mean interval time between TBI and MR imaging evaluation was 3.1 years (range, 2.5–4.4 years). The primary causes of TBI were accidents involving automobiles (33.3%), bicycles (11.1%), and pedestrians (22.2%); assaults (22.2%); and falls (11.1%).

GCS scores ranged from 4 to 11 immediately after hospital admission on the date of trauma. TBI was classified as moderate (GCS score of 9–12) in 6 patients (66.7%) and severe (GCS score of ≤8) in the other 3 (33.3%). CT scans at the date of the trauma showed lesions suggesting DAI in 5 patients, contusion in 3, brain swelling in 2, subdural hematoma in 1, and hydrocephalus secondary to intraventricular hemorrhage in 1.

All of the images were acquired on a 1.5T MR imaging scanner (Magneton Vision; Siemens, Erlangen, Germany). Image assessment and postprocessing were performed with a Silicon Graphics O2 Workstation (SGI, Sunnyvale, Calif). Measurement and placement of regions of interest were performed by only 1 radiologist in a nonblinded fashion.

MR Imaging Acquisition Sequences and Quantitative Postprocessing Techniques

Fluid-Attenuated Inversion Recovery.

Subjects were scanned with fluid-attenuated inversion recovery (FLAIR; TR/TE = 7700/119 ms, TI = 2200 ms, FOV = 230 mm, matrix = 112 × 256, section thickness = 5 mm) images for qualitative assessment of morphologic evaluation of the brain and for spectroscopy volume-of-interest (VOI) positioning. These images were also used to measure and calculate BFR and BCR ratios. The BFR was measured by dividing the widest distance between the outer margins of the frontal horns of the lateral ventricle by the brain diameter along the same line. BCR was measured in the same way but with the minimal distance between the caudate indentations as the numerator (Fig 1).

Fig 1.
  • Download figure
  • Open in new tab
  • Download powerpoint
Fig 1.

A, The BFR is measured by dividing the widest distance between the outer margins of the frontal horns of the lateral ventricle (small continuous line) by the brain diameter along the same line (large traced line). B, The BCR is measured by dividing the minimal distance between the caudate indentations (small continuous line) by the brain diameter along the same line (large traced line).

T2 Relaxometry

A double-echo sequence (TR = 2700 ms, TE = 17 ms and 102 ms, FOV = 240 mm, matrix = 140 × 256, section thickness = 3 mm) was performed to assess T2 relaxometry. Postprocessing and measurement of estimated T2 relaxation time were executed with software developed in our university, by using Matlab (MathWorks, Natick, Mass) already validated in previous studies. Axial sections were subdivided into 6 regions of interest for measurement: bilateral frontal and parietal normal-appearing WM (NAWM) and genu and splenium of the CC (Fig 2).

Fig 2.
  • Download figure
  • Open in new tab
  • Download powerpoint
Fig 2.

A−D, Regions of interest for measurement of T2 relaxation time, MTR, and ADC are shown in the frontal and parietal NAWM (white regions of interest in A−C) and in the genu and splenium of the CC (white regions of interest in D).

MTR

Two consecutive sets of axial T1-weighted 3D gradient-echo pulse images (TR/TE = 34/11 ms, flip angle = 30°, FOV = 256 mm, matrix = 175 × 256, section thickness = 3 mm) were acquired, the first without and the second with an off-resonance saturation pulse to assess magnetization transfer images.

MTR maps were calculated by using the following equation: [(M0 − Ms) / M0] × 100, where M0 is the image obtained by using the sequence without, and Ms is the image obtained by using the sequence with the magnetization transfer saturation pulse. The equation was applied pixel by pixel, forming an MTR map. Regions of interest were the same as those used in relaxometry (Fig 2).

DWI and ADC Maps

The isotropic DWI included an axial echo-planar spin-echo sequence (TR = 5100 ms, TE = 137 ms, FOV = 240 mm, matrix = 96 × 128, section thickness = 5 mm, 3 orthogonal planes; 4 b-values of 0, 50, 500, and 1000 s/mm2). The ADC map was calculated, and regions of interest were the same as those used in relaxometry and MTR (Fig 2).

1H-MR Spectroscopy

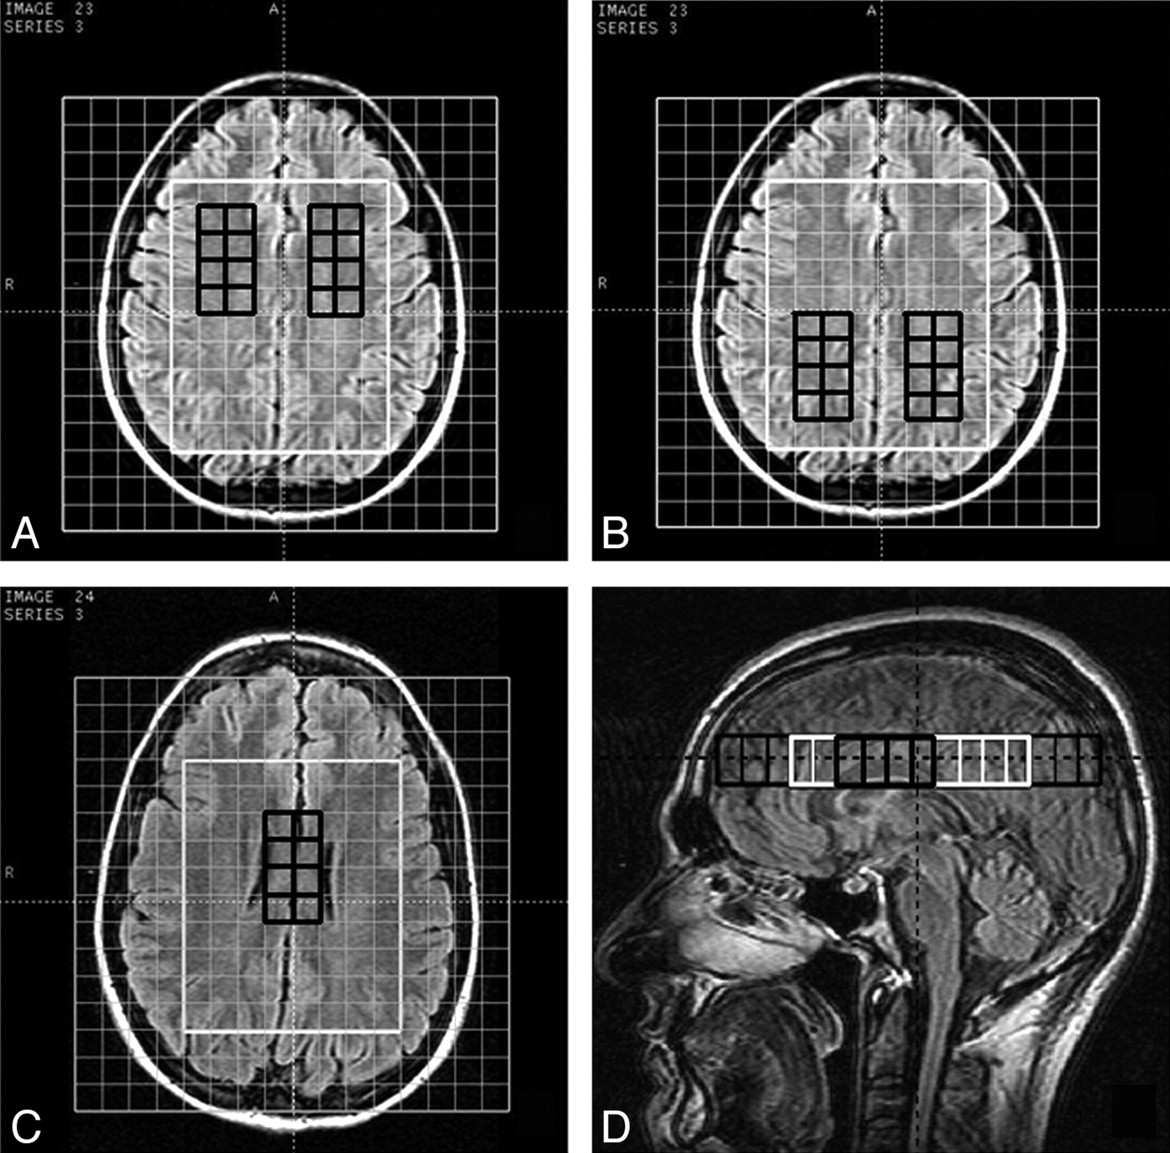
A multivoxel point-resolved spectroscopic sequence, with a TE of 270 ms, TR of 1500 ms, and a 16 × 16 transverse phase-encoding matrix, was performed. The VOI was positioned to include the CC and corona radiata. The VOI dimensions were as follows: thickness = 20 mm, anteroposterior dimension = 100 mm, and right-left dimension = 80 mm. The VOI was divided into 80 voxels of 20 × 10 × 10 mm (2.0 mm3). Spectroscopic data were processed with software provided by the MR imaging vendor (Siemens). NAA/creatine (NAA/Cr) ratios were calculated on both sides of the frontal and parietal WM and in the region of the CC (Fig 3).

Fig 3.
  • Download figure
  • Open in new tab
  • Download powerpoint
Fig 3.

1H-MR spectroscopy VOIs are positioned to include the CC and corona radiata. NAA/Cr ratios are calculated in the frontal (black voxels in A) and parietal (black voxels in B) WM and in the region of the CC (black voxels in C and D).

Statistical Analysis

To assess differences of BFR, BCR, T2 relaxation time, MTR, ADC, and NAA/Cr ratio parameters between study groups, we used unpaired t tests. The Statistical Package for the Social Sciences (SPSS, Chicago, Ill) was used for all tests. P values < .05 were considered to indicate a significant difference.

Results

BFR, BCR, T2 relaxation time, and ADC values of the test group were higher and MTR values were lower than those of the control group in both the NAWM and CC, and the differences were statistically significant. The NAA/Cr ratio measured at the CC was lower and statistically significant in the test group, but no significant difference was found at NAWM. These results are described and summarized in the Table.

View this table:
  • View inline
  • View popup

BFR and BCR, T2-relaxation time, ADC, MTR and NAA/Cr ratio mean value differences between the test and control groups, measured at the NAWM and CC

In 1 patient, conventional MR images showed many areas of signal-intensity loss at the CC, in the subcortical WM and in the deep WM, which corresponded to hemosiderin deposition secondary to DAI. In this case, regions of interest were placed to avoid these signal-intensity-loss areas and to include only NAWM. Focal atrophy associated with gliosis was observed at the left temporal lobe in 2 patients secondary to traumatic brain contusion, and these areas were also not included in our data (Fig 4). No focal lesions were observed in the other subjects.

Fig 4.
  • Download figure
  • Open in new tab
  • Download powerpoint
Fig 4.

A and B, Conventional MR images (transversal T2-weighted turbo spin-echo [TSE] sequence in A and coronal FLAIR sequence in B) show focal atrophy and gliosis in the left temporal lobe (white arrow) secondary to a traumatic brain contusion in a 24-year-old female patient. C and D, MR images (transversal T2-weighted TSE sequence in C and saggital FLAIR sequence in D) demonstrate many areas of signal-intensity loss at the CC (black arrows) and at the subcortical and at deep WM (white curved arrows in C), which correspond to hemosiderin deposition secondary to diffuse axonal injury in a 22-year-old male patient.

Discussion

Conventional MR imaging sequences are qualitative techniques that allow quick subjective interpretation for the diagnosis of various central nervous system anomalies with proved efficacy. However, some mild microstructural changes may not be discernible in these sequences. Thus, delayed neuronal and axonal damage after TBI in NAWM would only be confirmed with histologic analysis of brain tissue fragments, obviously impracticable in human beings. Some quantitative MR imaging techniques have the potential to evaluate and estimate this mild microstructural damage after TBI.

Brain atrophy secondary to neuronal damage and loss after TBI has already been reported in human and animal model research.2,3,6,7 The brain atrophy progression is faster in the first year after the traumatic event, and there is evidence that this process continues for up to 3 years, but at a slower rate. This delayed progression of the brain volume loss may be related to neuronal apoptosis unleashed by TBI.8,9 Ventricular dilation is the most frequent abnormality found after TBI and is directly related to the degree of WM loss and inversely related to cognitive outcome.8 In our study, significantly higher ventricle-to-brain ratio (BFR and BCR) mean values were also observed in the test group, compared with the controls, reflecting ventricular enlargement secondary to subcortical atrophy due to axonal damage after TBI.

T2 relaxation time directly corresponds to water concentration in tissue. The main etiologies of increased water concentration in central nervous parenchyma are inflammatory processes, edema, demyelination, gliosis, or neuronal loss.10–12 A higher mean value of T2 relaxation time was observed in the NAWM and CC of the test group in our study, compared with the control group, demonstrating higher water concentration in these regions. The cause of this increased water concentration is thought to be axonal loss (with concomitant myelin sheath loss) and gliosis, secondary to TBI. Certainly, no edema or inflammatory process was present at time of examination, because the traumatic event occurred ≥2.5 years before MR imaging evaluation and all subjects had no symptoms of acute disease or comorbidity.

In the MR imaging sequences with the magnetization transfer saturation pulse directed to protons linked to macromolecules, the signal intensity decreases proportionally to concentration of these macromolecules. This loss of signal intensity is quantifiable by calculating the MTR between saturated and nonsaturated images. Thus, when the concentration of macromolecules is reduced in an evaluated tissue, a decrease in MTR value is expected. The main macromolecules of the cerebral WM are proteins and sphingolipids of the axonal membranes and myelin. So, in WM lesions in which demyelination or axonal loss is present, the MTR values decrease, even before conventional MR imaging sequences reveal visible signal-intensity change in the damaged areas.13–15 Reduction of MTR values measured in WM after TBI was already demonstrated13,16 and also at the CC in victims of mild TBI.17 We also observed a significantly lower MTR mean value measured at the NAWM and CC of the test group compared with the control group, probably secondary to axonal loss and demyelination, indirectly showing the axonal microstructural damage in these regions after TBI.

The integrity of the cytoskeleton of axonal fibers and myelin sheaths is a natural restraint to water diffusibility in the brain. For this reason, DWI shows an anisotropic conformation, where water diffusion direction is predominantly parallel to axonal tracts.18 Thus, anisotropy is more evident in WM, where axonal fiber concentration is higher. For global diffusion evaluation, independent of its direction, isotropic DWI is used with ADC maps.

Appraised ADC values are inversely proportional to the restriction of water diffusibility. Axonal damage or demyelination, with disruption of the axonal cytoskeleton and myelin sheath, causes a reduction in the diffusion restriction, resulting in an increase of ADC values and decreased anisotropy.19–22 In the present study, ADC mean values measured at the NAWM and CC of the TBI victim group were higher than those measured in the test group, reflecting loss of myelinated axonal fibers secondary to trauma.

Raised ADC values at NAWM, >11 months after TBI, were already demonstrated in 2 patients studied by Rugg-Gunn et al.23 These authors concluded that the increase of ADC values would suggest an expansion of the extracellular space due to neuronal or glial loss, not discernible in the conventional MR imaging sequences.

Another way to evaluate axonal damage is by using diffusion tensor imaging parameters, such as fractional anisotropy (FA), not used in our study. Decreased FA value in the WM reflects axonal damage with loss of structural integrity of the myelinated fibers. Reduced FA values in the CC and other WM areas after mild, moderate, and severe TBI were already demonstrated in both early and late (or chronic) phases.19,23–27

NAA is a metabolite produced exclusively in neurons,28 synthesized from acetyl-CoA and L-aspartate in the mitochondria. NAA is found in high concentration in the neuronal cytosol and is second only to glutamate in terms of concentrations.29 This metabolite is also present in the axonal fibers,28 taking part in the synthesis process of myelin in developing brain and, probably, in the axonal repairing process in adults. Thus, NAA is considered a neuronal and axonal marker, and its concentration decreases in brain lesions that cause neuronal or axonal loss.

Decreased NAA after TBI was already demonstrated in the WM,30–34 CC,13,35 gray matter,30–32,36 thalamus,37 and hippocampus and basal ganglia,38 in both subacute28,30,33 and late phases.31–35,38

Our results showed a significantly decreased NAA/Cr ratio mean value in the CC of the posttraumatic patient group, reflecting axonal loss in this location due to TBI. Opposed to the results of other previous studies that reported decreased NAA in WM after TBI,30–34 no significant difference of NAA/Cr ratio values in the NAWM between the test and control groups was observed in our study. Although there was no statistically significant difference, a lower NAA/Cr ratio mean value was observed in the test group, but the small number of patients evaluated here would be inadequate to establish this difference. Thus, on the basis of our results, we could not assert that the NAA/Cr ratio could evaluate axonal damage in the NAWM, and a larger sample size would be necessary to answer this question. Kampfl et al39 evaluated patients with a persistent vegetative state after severe closed TBI and reported that the CC was the region most commonly affected in subjects with diffuse WM lesions. This could be the reason that NAA/Cr ratio mean values were statistically different in the CC but not in the NAWM in our study.

We used strict inclusion and exclusion criteria to minimize the possibility that other factors could be involved in the neuronal damage besides TBI effects, resulting in a small sample size.

Conclusions

Correlation between the results achieved in this study and the microstructural changes secondary to neuronal and axonal loss without histologic confirmation is just speculation. However, on the basis of histologic findings reported in other studies showing neuronal and axonal lesions after TBI,40–42 our results allow us to assert that these quantitative MR imaging techniques could noninvasively demonstrate delayed neuronal and axonal damage in the CC and NAWM after moderate and severe TBI.

References

  1. ↵
    Bagley LJ, Grossman RI, Galetta SL, et al. Characterization of white matter lesions in multiple sclerosis and traumatic brain injury as revealed by magnetization transfer contour plots. AJNR Am J Neuroradiol 1999;20:977–81
    Abstract/FREE Full Text
  2. ↵
    Smith DH, Chen XH, Pierce JE, et al. Progressive atrophy and neuron death for one year following brain trauma in the rat. J Neurotrauma 1997;14:715–27
    PubMed
  3. ↵
    Bramlett HM, Dietrich WD. Quantitative structural changes in white and gray matter 1 year following traumatic brain injury in rats. Acta Neuropathol 2002;103:607–14
    CrossRefPubMed
  4. ↵
    Schofield PW, Tang M, Marder K, et al. Alzheimer's disease after remote head injury: an incidence study. J Neurol Neurosurg Psychiatry 1997;62:2 119–24
  5. ↵
    Fleminger S, Oliver DL, Lovestone S, et al. Head injury as a risk factor for Alzheimer's disease: the evidence 10 years on—a partial replication. J Neurol Neurosurg Psychiatry 2003;74:857–62
    Abstract/FREE Full Text
  6. ↵
    Reider-Groswasser I, Cohen M, Costeff H, et al. Late CT findings in brain trauma: relationship to cognitive and behavioral sequelae and to vocational outcome. AJR Am J Roentgenol 1993;160:147–52
    PubMed
  7. ↵
    Shiozaki T, Akai H, Taneda M, et al. Delayed hemispheric neuronal loss in severely head-injured patients. J Neurotrauma 2001;18:665–74
    CrossRefPubMed
  8. ↵
    Bigler ED. Quantitative magnetic resonance imaging in traumatic brain injury. J Head Trauma Rehabil 2001;16:117–34
    PubMed
  9. ↵
    Conti AC, Raghupathi R, Trojanowski JQ, et al. Experimental brain injury induces regionally distinct apoptosis during the acute and delayed post-traumatic period. J Neurosci 1998;18:5663–72
    Abstract/FREE Full Text
  10. ↵
    Armspach JP, Gounot D, Rumbach L, et al. In vivo determination of multiexponential T2 relaxation in the brain of patients with multiple sclerosis. Magn Reson Imaging 1991;9:107–13
    CrossRefPubMed
  11. Larsson HB, Frederiksen J, Petersen J, et al. Assessment of demyelination, edema, and gliosis by in vivo determination of T1 and T2 in the brain of patients with acute attack of multiple sclerosis. Magn Reson Med 1989;11:337–48
    CrossRefPubMed
  12. ↵
    Papanikolaou N, Papadaki E, Karampekios S, et al. T2 relaxation time analysis in patients with multiple sclerosis: correlation with magnetization transfer ratio. Eur Radiol 2004;14:115–22
    CrossRefPubMed
  13. ↵
    Sinson G, Bagley LJ, Cecil KM, et al. Magnetization transfer imaging and proton MR spectroscopy in the evaluation of axonal injury: correlation with clinical outcome after traumatic brain injury. AJNR Am J Neuroradiol 2001;22:143–51
    Abstract/FREE Full Text
  14. Kimura H, Meaney DF, Mcgowan JC, et al. Magnetization transfer imaging of diffuse axonal injury following experimental brain injury in the pig: characterization by magnetization transfer ratio with histopathologic correlation. J Comput Assist Tomogr 1996;20:540–46
    CrossRefPubMed
  15. ↵
    McGowan JC, Mccormack TM, Grossman RI, et al. Diffuse axonal pathology detected with magnetization transfer imaging following brain injury in the pig. Magn Reson Med 1999;41:727–33
    CrossRefPubMed
  16. ↵
    Bagley LJ, Mcgowan JC, Grossman RI, et al. Magnetization transfer imaging of traumatic brain injury. J Magn Reson Imaging 2000;11:1–8
    CrossRefPubMed
  17. ↵
    McGowan JC, Yang JH, Plotkin RC, et al. Magnetization transfer imaging in the detection of injury associated with mild head trauma. AJNR Am J Neuroradiol 2000;21:875–80
    Abstract/FREE Full Text
  18. ↵
    Schaefer PW, Grant PE, Gonzalez RG. Diffusion-weighted MR imaging of the brain. Radiology 2000;217:331–45
    CrossRefPubMed
  19. ↵
    Arfanakis K, Haughton VM, Carew JD, et al. Diffusion tensor MR imaging in diffuse axonal injury. AJNR Am J Neuroradiol 2002;23:794–802
    Abstract/FREE Full Text
  20. Goetz P, Blamire A, Rajagopalan B, et al. Increase in apparent diffusion coefficient in normal appearing white matter following human traumatic brain injury correlates with injury severity. J Neurotrauma 2004;21:645–54
    CrossRefPubMed
  21. Mascalchi M, Filippi M, Floris R, et al. Diffusion-weighted MR of the brain: methodology and clinical application. Radiol Med 2005;109:155–97
    PubMed
  22. ↵
    Tievsky AL, Ptak T, Farkas J. Investigation of apparent diffusion coefficient and diffusion tensor anisotropy in acute and chronic multiple sclerosis lesions. AJNR Am J Neuroradiol 1999;20:1491–99
    Abstract/FREE Full Text
  23. ↵
    Rugg-Gunn FJ, Symms MR, Barker GJ, et al. Diffusion imaging shows abnormalities after blunt head trauma when conventional magnetic resonance imaging is normal. J Neurol Neurosurg Psychiatry 2001;70:530–33
    Abstract/FREE Full Text
  24. Kraus MF, Susmaras T, Caughlin BP, et al. White matter integrity and cognition in chronic traumatic brain injury: a diffusion tensor imaging study. Brain 2007;130:2508–19
    Abstract/FREE Full Text
  25. Yuan W, Holland SK, Schmithorst VJ, et al. Diffusion tensor MR imaging reveals persistent white matter alteration after traumatic brain injury experienced during early childhood. AJNR Am J Neuroradiol 2007;28:1919–25
    Abstract/FREE Full Text
  26. Rutgers DR, Toulgoat F, Cazejust J, et al. White matter abnormalities in mild traumatic brain injury: a diffusion tensor imaging study. AJNR Am J Neuroradiol 2008;29:514–19
    Abstract/FREE Full Text
  27. ↵
    Rutgers DR, Fillard P, Paradot G, et al. Diffusion tensor imaging characteristics of the corpus callosum in mild, moderate, and severe traumatic brain injury. AJNR Am J Neuroradiol 2008;29:1730–35. Epub 2008 Jul 10
    Abstract/FREE Full Text
  28. ↵
    Cecil KM, Lenkinski RE, Meaney DF, et al. High-field proton magnetic resonance spectroscopy of a swine model for axonal injury. J Neurochem 1998;70:2038–44
    PubMed
  29. ↵
    Brooks WM, Friedman SD, Gasparovic C. Magnetic resonance spectroscopy in traumatic brain injury. J Head Trauma Rehabil 2001;16:149–64
    PubMed
  30. ↵
    Ross BD, Ernst T, Kreis R, et al. 1H MRS in acute traumatic brain injury. J Magn Reson Imaging 1998;8:829–40
    CrossRefPubMed
  31. ↵
    Friedman SD, Brooks WM, Jung RE, et al. Quantitative proton MRS predicts outcome after traumatic brain injury. Neurology 1999;52:1384–91
    Abstract/FREE Full Text
  32. ↵
    Brooks WM, Stidley CA, Petropoulos H, et al. Metabolic and cognitive response to human traumatic brain injury: a quantitative proton magnetic resonance study. J Neurotrauma 2000;17:629–40
    CrossRefPubMed
  33. ↵
    Garnett MR, Blamire AM, Rajagopalan B, et al. Evidence for cellular damage in normal-appearing white matter correlates with injury severity in patients following traumatic brain injury: a magnetic resonance spectroscopy study. Brain 2000;123:1403–9
    Abstract/FREE Full Text
  34. ↵
    Govindaraju V, Gauger GE, Manley GT, et al. Volumetric proton spectroscopic imaging of mild traumatic brain injury. AJNR Am J Neuroradiol 2004;25:730–37
    Abstract/FREE Full Text
  35. ↵
    Cecil KM, Hills EC, Sandel ME, et al. Proton magnetic resonance spectroscopy for detection of axonal injury in the splenium of the corpus callosum of brain-injured patients. J Neurosurg 1998;88:795–801
    PubMed
  36. ↵
    Ricci R, Barbarella G, Musi P, et al. Localised proton MR spectroscopy of brain metabolism changes in vegetative patients. Neuroradiology 1997;39:313–19
    CrossRefPubMed
  37. ↵
    Uzan M, Albayram S, Dashti SG, et al. Thalamic proton magnetic resonance spectroscopy in vegetative state induced by traumatic brain injury. J Neurol Neurosurg Psychiatry 2003;74:33–38
    Abstract/FREE Full Text
  38. ↵
    Ariza M, Junque C, Mataro M, et al. Neuropsychological correlates of basal ganglia and medial temporal lobe NAA/Cho reductions in traumatic brain injury. Arch Neurol 2004;61:541–44
    CrossRefPubMed
  39. ↵
    Kampfl A, Franz G, Aichner F, et al. The persistent vegetative state after closed head injury: clinical and magnetic resonance imaging findings in 42 patients. J Neurosurg 1998;88:809–16
    CrossRefPubMed
  40. ↵
    Ng HK, Mahaliyana RD, Poon WS. The pathological spectrum of diffuse axonal injury in blunt head trauma: assessment with axon and myelin strains. Clin Neurol Neurosurg 1994;96:24–31
    CrossRefPubMed
  41. Foda MA, Marmarou A. A new model of diffuse brain injury in rats. Part II. Morphological characterization. J Neurosurg 1994;80:301–13
    CrossRefPubMed
  42. ↵
    Onaya M. Neuropathological investigation of cerebral white matter lesions caused by closed head injury. Neuropathology 2002;22:243–51
    CrossRefPubMed
  • Received October 7, 2008.
  • Accepted after revision December 3, 2008.
  • Copyright © American Society of Neuroradiology
View Abstract
PreviousNext
Back to top

In this issue

American Journal of Neuroradiology: 30 (5)
American Journal of Neuroradiology
Vol. 30, Issue 5
May 2009
  • Table of Contents
  • Index by author
Advertisement
Print
Download PDF
Email Article

Thank you for your interest in spreading the word on American Journal of Neuroradiology.

NOTE: We only request your email address so that the person you are recommending the page to knows that you wanted them to see it, and that it is not junk mail. We do not capture any email address.

Enter multiple addresses on separate lines or separate them with commas.
Evaluation of Delayed Neuronal and Axonal Damage Secondary to Moderate and Severe Traumatic Brain Injury Using Quantitative MR Imaging Techniques
(Your Name) has sent you a message from American Journal of Neuroradiology
(Your Name) thought you would like to see the American Journal of Neuroradiology web site.
CAPTCHA
This question is for testing whether or not you are a human visitor and to prevent automated spam submissions.
Cite this article
A.E. Mamere, L.A.L. Saraiva, A.L.M. Matos, A.A.O. Carneiro, A.C. Santos
Evaluation of Delayed Neuronal and Axonal Damage Secondary to Moderate and Severe Traumatic Brain Injury Using Quantitative MR Imaging Techniques
American Journal of Neuroradiology May 2009, 30 (5) 947-952; DOI: 10.3174/ajnr.A1477

Citation Manager Formats

  • BibTeX
  • Bookends
  • EasyBib
  • EndNote (tagged)
  • EndNote 8 (xml)
  • Medlars
  • Mendeley
  • Papers
  • RefWorks Tagged
  • Ref Manager
  • RIS
  • Zotero
0 Responses
Respond to this article
Share
Bookmark this article
Evaluation of Delayed Neuronal and Axonal Damage Secondary to Moderate and Severe Traumatic Brain Injury Using Quantitative MR Imaging Techniques
A.E. Mamere, L.A.L. Saraiva, A.L.M. Matos, A.A.O. Carneiro, A.C. Santos
American Journal of Neuroradiology May 2009, 30 (5) 947-952; DOI: 10.3174/ajnr.A1477
del.icio.us logo Twitter logo Facebook logo Mendeley logo
  • Tweet Widget
  • Facebook Like
  • Google Plus One
Purchase

Jump to section

  • Article
    • Abstract
    • Materials and Methods
    • Results
    • Discussion
    • Conclusions
    • References
  • Figures & Data
  • Info & Metrics
  • Responses
  • References
  • PDF

Related Articles

  • No related articles found.
  • PubMed
  • Google Scholar

Cited By...

  • CNS disease-related protein variants as blood-based biomarkers in traumatic brain injury
  • Crossref (60)
  • Google Scholar

This article has been cited by the following articles in journals that are participating in Crossref Cited-by Linking.

  • Neuroimaging, Behavioral, and Psychological Sequelae of Repetitive Combined Blast/Impact Mild Traumatic Brain Injury in Iraq and Afghanistan War Veterans
    Eric C. Petrie, Donna J. Cross, Vasily L. Yarnykh, Todd Richards, Nathalie M. Martin, Kathleen Pagulayan, David Hoff, Kim Hart, Cynthia Mayer, Matthew Tarabochia, Murray A. Raskind, Satoshi Minoshima, Elaine R. Peskind
    Journal of Neurotrauma 2014 31 5
  • SyMRI of the Brain
    Akifumi Hagiwara, Marcel Warntjes, Masaaki Hori, Christina Andica, Misaki Nakazawa, Kanako Kunishima Kumamaru, Osamu Abe, Shigeki Aoki
    Investigative Radiology 2017 52 10
  • Synthetic Mri of the Brain in a Clinical Setting
    I Blystad, JBM Warntjes, O Smedby, A-M Landtblom, P Lundberg, E-M Larsson
    Acta Radiologica 2012 53 10
  • Emerging Imaging Tools for Use with Traumatic Brain Injury Research
    Jill V. Hunter, Elisabeth A. Wilde, Karen A. Tong, Barbara A. Holshouser
    Journal of Neurotrauma 2012 29 4
  • Omega-3 Polyunsaturated Fatty Acid Supplementation Improves Neurologic Recovery and Attenuates White Matter Injury after Experimental Traumatic Brain Injury
    Hongjian Pu, Yanling Guo, Wenting Zhang, Lanting Huang, Guohua Wang, Anthony K Liou, Jia Zhang, Pengyue Zhang, Rehana K Leak, Yun Wang, Jun Chen, Yanqin Gao
    Journal of Cerebral Blood Flow & Metabolism 2013 33 9
  • Mechanobiology of the brain in ageing and Alzheimer&#039;s disease
    Chloe M. Hall, Emad Moeendarbary, Graham K. Sheridan
    European Journal of Neuroscience 2021 53 12
  • Early Microstructural and Metabolic Changes following Controlled Cortical Impact Injury in Rat: A Magnetic Resonance Imaging and Spectroscopy Study
    Su Xu, Jiachen Zhuo, Jennifer Racz, Da Shi, Steven Roys, Gary Fiskum, Rao Gullapalli
    Journal of Neurotrauma 2011 28 10
  • Diffuse damage in pediatric traumatic brain injury: A comparison of automated versus operator-controlled quantification methods
    Erin D. Bigler, Tracy J. Abildskov, Elisabeth A. Wilde, Stephen R. McCauley, Xiaoqi Li, Tricia L. Merkley, Michael A. Fearing, Mary R. Newsome, Randall S. Scheibel, Jill V. Hunter, Zili Chu, Harvey S. Levin
    NeuroImage 2010 50 3
  • Advanced neuroimaging applied to veterans and service personnel with traumatic brain injury: state of the art and potential benefits
    Elisabeth A. Wilde, Sylvain Bouix, David F. Tate, Alexander P. Lin, Mary R. Newsome, Brian A. Taylor, James R. Stone, James Montier, Samuel E. Gandy, Brian Biekman, Martha E. Shenton, Gerald York
    Brain Imaging and Behavior 2015 9 3
  • Levels of phosphorylated axonal neurofilament subunit H (pNfH) are increased in acute ischemic stroke
    P. Singh, J. Yan, R. Hull, S. Read, J. O'Sullivan, R.D. Henderson, S. Rose, J.M. Greer, P.A. McCombe
    Journal of the Neurological Sciences 2011 304 1-2

More in this TOC Section

  • Optimal MRI Sequence for Identifying Occlusion Location in Acute Stroke: Which Value of Time-Resolved Contrast-Enhanced MRA?
  • Evaluating the Effects of White Matter Multiple Sclerosis Lesions on the Volume Estimation of 6 Brain Tissue Segmentation Methods
  • Quiet PROPELLER MRI Techniques Match the Quality of Conventional PROPELLER Brain Imaging Techniques
Show more BRAIN

Similar Articles

Advertisement

Indexed Content

  • Current Issue
  • Accepted Manuscripts
  • Article Preview
  • Past Issues
  • Editorials
  • Editor's Choice
  • Fellows' Journal Club
  • Letters to the Editor
  • Video Articles

Cases

  • Case Collection
  • Archive - Case of the Week
  • Archive - Case of the Month
  • Archive - Classic Case

Special Collections

  • AJNR Awards
  • ASNR Foundation Special Collection
  • Most Impactful AJNR Articles
  • Photon-Counting CT
  • Spinal CSF Leak Articles (Jan 2020-June 2024)

More from AJNR

  • Trainee Corner
  • Imaging Protocols
  • MRI Safety Corner

Multimedia

  • AJNR Podcasts
  • AJNR Scantastics

Resources

  • Turnaround Time
  • Submit a Manuscript
  • Submit a Video Article
  • Submit an eLetter to the Editor/Response
  • Manuscript Submission Guidelines
  • Statistical Tips
  • Fast Publishing of Accepted Manuscripts
  • Graphical Abstract Preparation
  • Imaging Protocol Submission
  • Evidence-Based Medicine Level Guide
  • Publishing Checklists
  • Author Policies
  • Become a Reviewer/Academy of Reviewers
  • News and Updates

About Us

  • About AJNR
  • Editorial Board
  • Editorial Board Alumni
  • Alerts
  • Permissions
  • Not an AJNR Subscriber? Join Now
  • Advertise with Us
  • Librarian Resources
  • Feedback
  • Terms and Conditions
  • AJNR Editorial Board Alumni

American Society of Neuroradiology

  • Not an ASNR Member? Join Now

© 2025 by the American Society of Neuroradiology All rights, including for text and data mining, AI training, and similar technologies, are reserved.
Print ISSN: 0195-6108 Online ISSN: 1936-959X

Powered by HighWire