
Abstract
BACKGROUND AND PURPOSE: Anisotropy is a good indicator of white matter fascicle macrostructure and organization but the interpretation of its changes with age remains difficult. The increase of WM fascicle fractional anisotropy with time and its relationship with WM fascicle volume have never been examined during childhood. We studied the maturation of associative WM fascicles during childhood using MR imaging–based DTI. We explored whether the fractional anisotropy increase of the main WM fascicles persists beyond the period of brain growth and is related to WM fascicle volume increase.
MATERIALS AND METHODS: In a series of 25 healthy children, the fractional anisotropy and volume of 15 associative WM fascicles were calculated. Several regression linear mixed models were used to study maturation parameters (fractional anisotropy, volume, and total telencephalon volume) considered as dependent variables, while age and sex were independent variables (the variable identifying the different WM fascicles was considered as a repeated measure).
RESULTS: In children older than 8 years of age, WM fascicle fractional anisotropy increased with age (P value = .045) but not its volume (P value = .7) or the telencephalon volume (P value = .16). The time course of WM fascicle fractional anisotropy and volume suggested that each WM fascicle might follow a specific pattern of maturation.
CONCLUSIONS: The fractional anisotropy increase of several WM fascicles after 8 years of age may not result from an increase in WM fascicle volume. It might be the consequence of other developmental processes such as myelination.
ABBREVIATION:
- FA
- fractional anisotropy
The maturation of human WM is a complex process that takes place from the fetal period to adulthood.1 WM is made of fascicles, ie, bundles of neurons' axon of gray matter, which interconnect functional regions of the central nervous system. One can distinguish 3 types of bundles: 1) commissural fascicles that connect right and left cortices (eg, the forceps major), right and left nuclei (eg, the Forel commissure), or both (eg, the anterior commissure); 2) projection fascicles that connect the cortex with the deep brain (eg, the thalamic radiations that do not cross the midline) or the spinal cord (eg, the pyramidal fascicle crossing the midline); 3) associative fascicles that interconnect cortical areas or nuclei unilaterally (eg, the arcuate fascicle). The development of WM fascicles across time depends on 3 processes: fasciculation or organization in bundles, growth in volume, and myelination.2 Axons are the main constituents of WM. The fasciculation is driven by pioneering axons growing under the control of their distally located cones and environmental signals, such as chemical agents, neurotransmitters, electrical signals, and growth factor.2,3 WM bundle growth, myelination, and functional maturation are asynchronous processes. Cortical sensory regions and related WM fascicles are known to mature earlier than associative regions, eg, frontal regions, which develop later and slowly until the end of adolescence.2,4
Nevertheless, the relationship between myelination and brain function is complex because fiber myelination and functional maturation could be uncorrelated in different cerebral pathways. Indeed, the myelination of auditory pathways reaches maturity at 3 years of age, whereas the hearing function is effective since birth;2 conversely the myelination of the corticospinal fascicle starts before birth, yet neonate motor capacities are limited.2 Moreover, myelination is associated with the development of cognitive functions because it induces a dramatic increase in the conduction velocity of the action potential,2,5 improving the functional efficiency of neural networks.2,6 Myelination has been explored in vivo by MR imaging since the early 2000s, using T1- and T2-weighted MR imaging sequences2,4 and DTI.7 DTI provides insight into WM architecture, notably the fascicles, probing water diffusion within each voxel.
A parameter derived from DTI computing, fractional anisotropy (FA), ranging from 0, isotropic diffusion, to 1, anisotropic diffusion, features fasciculation and myelination characteristics of WM fibers.2,8,9 FA value increases with age as myelination and bundling take place.2,8,9 Most interesting, bundling increases anisotropy even in the absence of myelin,2,10,11 and myelination increases anisotropy, ensheathing axons with oligodendroglial processes, further decreasing both membrane permeability and extracellular distance.2 In childhood, the whole volume of WM of the brain increases with age.12,13 Indeed, the growth of brain volume is rapid because 80% of brain volume is reached during the first 1.5 years of life.12 The growth of WM and the GM follow different patterns because 80% of the volume of GM is reached at the end of the first year of life, while the volume of WM grows initially rapidly and thereafter at a lower rate.12 The total GM volume peaks during childhood/adolescence and decreases thereafter, whereas total WM volume increases up to young adulthood.12
In summary, WM volume increases at a higher rate than GM volume throughout childhood.13 Few studies, to our knowledge, have specifically studied the growth of fascicles.14⇓-16 The increase in the volume of fascicles slows down from 6 to 12 years of age,14⇓-16 and the increase of fiber density and the volume of fascicles could explain the increase in FA with age,17 yet the chronologic sequence of simultaneous modifications of FA and the volume of fascicles has not been specifically examined. Thus, we aimed to analyze WM fascicle features (volume and mean FA value) by age, in a sample of 25 subjects from 1 to 17 years of age, hypothesizing that the increase in FA of the main WM fascicles could surpass the period of increase in total brain volume. Fifteen main fascicles were studied by DTI tractography, enabling 3D reconstruction and measurements of volume and mean FA value.
MATERIALS AND METHODS
Subjects
We retrospectively included MR imaging datasets of 25 children scanned in our institution following a medical request between November 2015 and November 2016. This retrospective study was approved by our institutional review board (Comité de protection des personnes VI CHU G. MONTPIED) and did not raise ethical issue and falled outside the scope of the rules governing biomedical research (articles L.1121-1-1 and R1121-3 of the Code of Public Health). The indication of all MR imaging was headache. MR imaging was included if no cerebral pathology was suspected on MR imaging and clinical records and if informed consent was signed by the patient's legal representative.
MR Imaging Datasets
MR imaging was performed following rectal injection of pentobarbital, 3–5 mg/kg (maximum dose of 100 mg), and oral intake of alimemazine (4% drop, 1 drop/kg, ie, 1.25 mg/kg) if required for children younger than 4 years of age, enabling movement-free imaging.
Examinations were performed on a 1.5T machine (Optima MR450w; GE Healthcare).
T2-weighted sequences were used for anatomic reference: TR = 2400 ms, TE = 88.32 ms, flip angle = 90°, B0 = 600 s/mm2, 272 joined axial slices, matrix = 512 × 512, voxel size = 0.47 × 0.47 × 0.6 mm3, total acquisition time = 6 minutes.
DTI acquisition used a single-shot echo-planar dual spin-echo sequence: TR = 7719 ms, TE = 81.7 ms, flip angle = 90°, 20 diffusion gradients, B0 = 600 s/mm2, 34 joined axial slices, matrix = 256 × 256, voxel size = 0.98 × 0.98 × 4 mm3, total acquisition time = 6 minutes.
Image Processing
DTI and related computed maps (FA and color-coded direction of diffusion tensors) were coregistered (mutual information algorithm) with T2 images after anterior/posterior commissure alignment and correction of eddy currents (iPlan Stereotaxy 3.0; Brainlab) (Fig 1A).18 Accuracy of automatic registration was carefully reviewed (visual analysis of merged images; test–retests) according to anatomic landmarks: putamen, pallidum, corpus callosum (body, major and minor forceps), anterior and posterior limbs of the internal capsule, cerebellum, cerebellar tentorium, Sylvian region, upper brain stem, ventricles (frontal horns and trigone), interhemispheric fissure, and main cerebral gyrations.
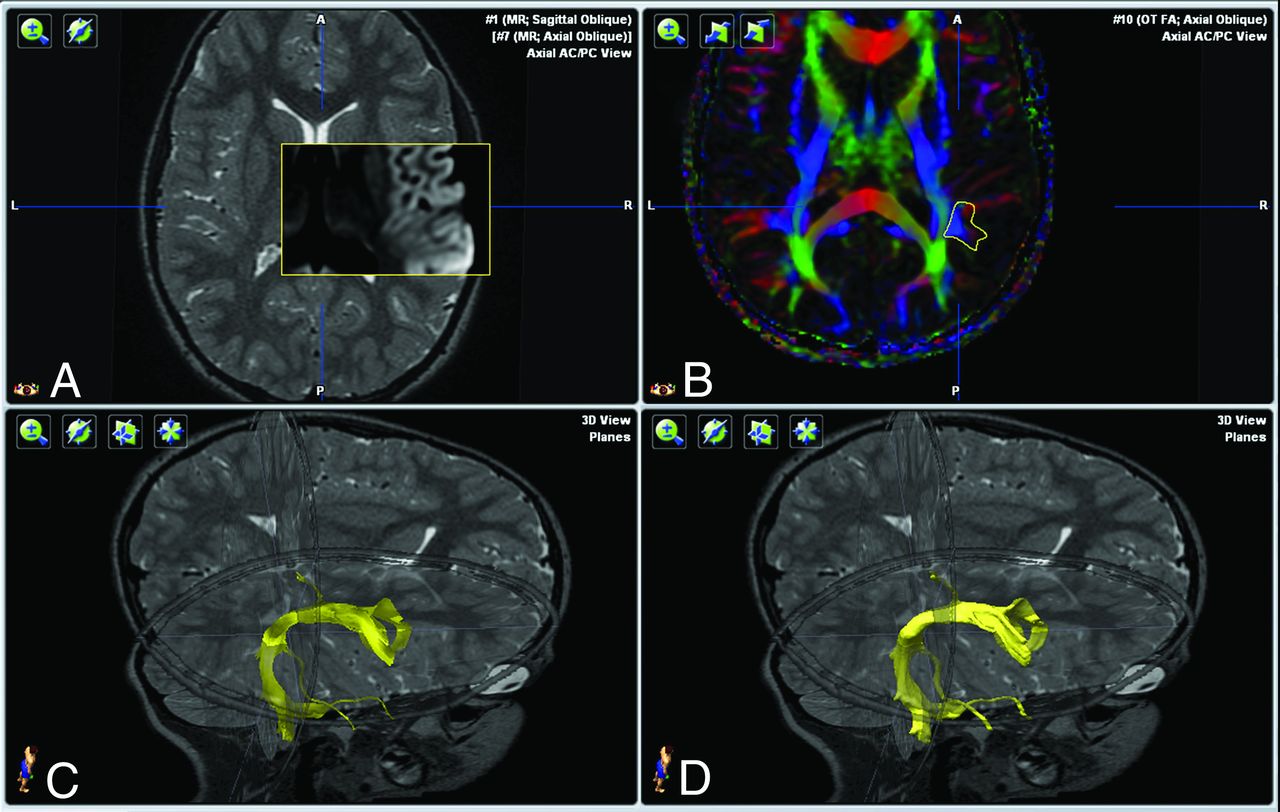
Image processing in a 7-year-old girl. Image datasets. A, Coregistration (mutual information algorithm) after anterior/posterior commissure alignment using iPlan Stereotaxy 3.0. T2-3D-weighted sequence. FA color-coded fiber-direction maps. B, Positioning of the ROI on the FA color-coded map to track the right arcuate fasciculus. C, Generating the right arcuate fasciculus. D, Generating the volume corresponding to the tractogram on a T2-weighted 3D dataset.
WM fascicle fiber tracking within the right and left hemispheres was performed by 2 trained clinical neuroanatomists (G.C. and E.d.S.) with the clinical software (iPlan Stereotaxy 3.0), relying on 2 methods of fiber assignment, continuous tracking19 and tensor deflection.20 The FA threshold was set to 0.20, meaning that only FA values superior to 0.20 were considered by voxel. This minimal FA threshold was selected because it allowed eliminating the values of the fraction of anisotropy corresponding to the free water or the cerebral cortex while keeping as much fiber as possible.19,21 In a previous study, the FA threshold was 0.13 for performing the tracking of an area containing both gray and white matter.22 The threshold of 0.15 was used in another study for brain stem fiber tracking,23 and the 0.10 threshold, for gray matter.24 Our interest in highly myelinated fibers caused us to increase this threshold to 0.20 to perform the tractography of white matter fibers exclusively. The minimum fiber length for tracking was set fascicle by fascicle: 35 mm for the superior longitudinal fasciculus (parietofrontal or anterior part, frontotemporal or arcuate part, parietotemporal or posterior part); the inferior fronto-occipital fasciculus; 16 mm for the uncinate fasciculus and the corpus callosum; and 5 mm for the cingulum. Seed ROIs were placed in WM regions of “obligatory passages” along the path of each WM fascicle, tracing streamlines of each WM fascicle irrespective of cortical terminations, which can vary from hemisphere to hemisphere and from subject to subject (Fig 1B) (intra- and interindividual variability).18
Each fascicle was generated as follows:18 1) guided by color-coded direction maps, positioning of 2 seed ROIs on FA maps within WM voxels where the fascicle fibers were easily identifiable (Fig 1B); 2) iterative test-retests, changing the size and shape of the ROIs, checking that no fibers belonging to the fascicle were missed; 3) use of a “fiber exclusion” tool (iPlan Stereotaxy 3.0) when the on-line reconstruction produced aberrant fibers (eg, the presence of a frontoparietal fiber when tracking the arcuate fasciculus (AF)); and 4) generation of the tractogram (Fig 1C). Each tractogram of a WM fascicle was reviewed (G.C.) before generating its envelope by automatic wrapping (iPlan Stereotaxy 3.0) (Fig 1D). Fifty WM fascicles were analyzed.25⇓-27 Seven were associative and intrahemispheric: the superior longitudinal fasciculus (parietofrontal or anterior part, frontotemporal or arcuate part, parietotemporal or posterior part), the inferior longitudinal fasciculus, the fronto-occipital fasciculus, the uncinate fasciculus, and the cingulum; and 1 was commissural, the corpus callosum. For each child, the 3D surface of the supratentorial brain (telencephalon) was automatically generated from T2-weighted MR images, an atlas-based automatic segmentation (iPlan Stereotaxy 3.0), enabling retrieving its volume (telencephalon volume in cubic millimeters) for further analysis (Fig 2). The telencephalon volume included supratentorial white and gray matter and excluded the CSF signal (on the T2 sequences that corresponded to the subarachnoidal and the ventricular spaces). We retrieved the volume and the mean FA value of voxels within the envelope for each fascicle of both hemispheres. The fascicle volume and mean FA of voxels within the envelope were standardized (z score) as follows:


3D surface renderings of the telencephalon in a 7-year-old girl from T2-weighted MR images used to map the left superior longitudinal fasciculus (anterior part in red, arcuate part in yellow, and posterior part in pink).
The telencephalon volume was standardized as well.
Data Analyses
We graphically examined the distribution of standardized WM fascicle parameters by age using locally weighted scatterplot smoothing (ie, Lowess smoothing curve; bandwidth = 0.8). A first graph (Fig 3) was performed using all the WM fascicles. On the basis of the graphic inspection of Fig 3, we identified an age threshold at 8 years of age corresponding to a slowdown of the increase of the total telencephalon volume. This age threshold was thought to mark the end of the period of increase in total telencephalon volume. We subsequently used this age threshold in regression analyses to test the changes with age in FA, volume of the WM fascicles, and total telencephalon volume in the subsamples of participants with ages below and above this threshold separately. Linear regression mixed models were used with standardized WM fascicle FA and volume and total telencephalon volume as dependent variables and age and sex as independent variables. The variable identifying the different WM fascicles was considered as a repeated measure (except for the model of total telencephalon volume). In the subsamples of participants with ages younger than 8 years, we also examined more closely each WM fascicle to determine the effects of age on WM fascicle FA and volume and to test the difference in slope between the effect of age on WM fascicle FA and the effect of age on WM fascicle volume. These models were also adjusted for sex. Statistical analysis (SAS 9.4 software; SAS Institute) was conducted on the basis of a 2-sided type I error of 5%. This study is exploratory in nature; hence no adjustment for multiple testing was performed.
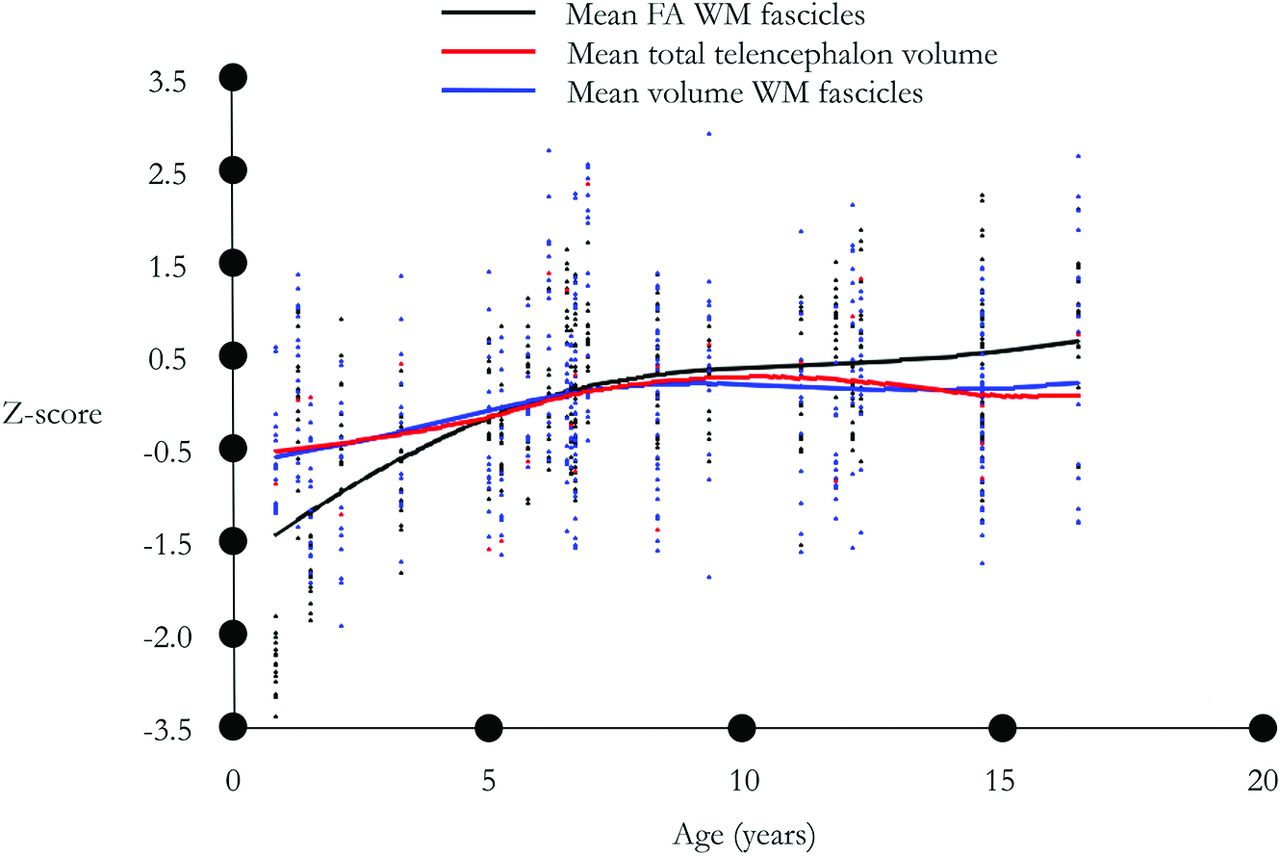
Lowess smoothing curve with a bandwidth of 0.8. Standardized. Black indicates mean WM fascicle FA; red, mean total telencephalon volume; blue, mean WM fascicle volume.
RESULTS
In our sample of 25 participants (10 males, 15 females), the mean age was 8.81 ± 4.47 years (On-line Table). Non-normalized mean values of WM fascicle FA, WM fascicle volume, and total telencephalon volume are shown in the On-line Table. The total telencephalon volume reached a plateau from 8 years of age (Fig 3). This was also true for WM fascicle volume.
In the subsample of participants younger than 8 years of age (n = 14), our regression linear mixed models indicated an increase with age of FA (β standardized = 0.29 ± 0.03, P value < .001) and volume of the WM fascicles (β standardized = 0.15 ± 0.03, P value < .001), as well as volume of the telencephalon (β standardized = 0.17 ± .03, P value < .001). However, in the subsample of participants older than 8 years of age (n = 11), our linear regression mixed models indicated an increase of FA with age (β standardized = 0.05 ± 0.02, P value = .045) and no increase of the volume of the WM fascicles (β standardized = −0.01 ± 0.03, P value = .7) or the volume of the telencephalon (β standardized = −0.03 ± 0.02, P value = .16).
We then further examined each fascicle separately in the subsample of participants older than 8 years of age. The FA of the right (β standardized = 0.13 ± 0.05, P value = .043) and left (β standardized = 0.14 ± 0.07, P value = .083) inferior fronto-occipital fascicles tended to increase with age (Table), whereas the volume of these fascicles did not (right: β standardized = −0.10 ± 0.09, P value = .3; left: β standardized = −0.16 ± 0.07, P value = .062). Thus, we found a significant interaction between the effects of age and the parameter considered (FA versus volume) for the left (P value = .017) and a marginally significant one for the right (P value = .072) inferior fronto-occipital fascicles.
Effect of age on WM fascicle FA and volume, and test for difference in slope between the effect of age on WM fascicle FA and the effect of age on WM fascicle volume, in the subsamples of participants older than 8 years of age
The FA of the arcuate part of the right superior longitudinal fasciculus (β standardized = 0.15 ± 0.06, P value = .042) increases with age as well as the volume of this fascicle (β standardized = 0.17 ± 0.10, P value = .11); thus, no interaction (P = .5) between the effect of age on FA and fascicles volume was found. An inspection of the evolution of the FA and volume of each WM fascicle also suggested different patterns of maturation processes according to the fasciculus (Fig 4).
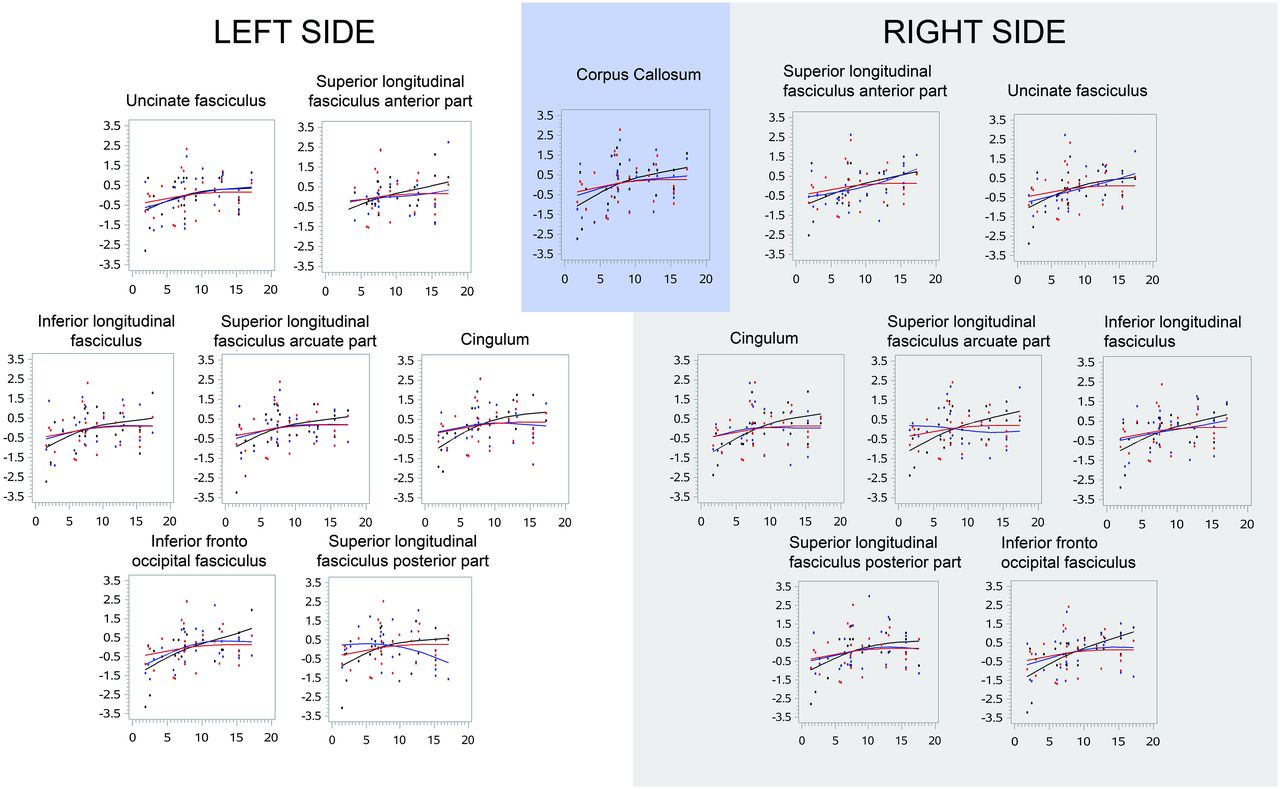
Lowess smoothing curve for each WM bundle with a bandwidth of 0.8. Standardized. Black indicates mean WM bundle FA; red, mean telencephalon volume; blue, mean WM bundle volume.
DISCUSSION
After 8 years of age, the age at which the total telencephalon volume reaches a plateau, we found a global increase of FA of the WM fascicles with age without an associated increase in the volume of the WM fascicles. The evolution of the FA and volume of each WM fascicle revealed differences in the pattern of maturation processes of fascicles. For the right and left inferior fronto-occipital fascicles, the FA increased in correlation to age, and no correlation was found between age and fascicle volume. However, both the FA and volume of the arcuate part of the superior right longitudinal fasciculus were found to increase with age. Altogether, one could speculate that the increase in FA after 8 years of age may not be the consequence of an increase in the volume of the fascicles but rather the consequence of other processes, such as myelination. Our methodologic approach allowed us to better understand the development of the WM fascicles from infancy to adulthood, even though our analyses were based on a small sample (n = 25).
Methodologic Implications
FA is described as the most sensitive marker for evaluating changes in the organization of different fascicles.17,28 To assess the evolution of FA with age, we used the already published original quantification approach, which quantifies the 3D-tracked fascicles, rather than the conventional ROI approach.17 Although few references concerning the evolution of the anisotropy fraction for the whole WM bundle are available, some publications consider that the average value of the FA of the whole bundle should be preferred. Indeed FA SDs in the fascicles across infants were smaller with the tract approach than with the ROI approach.17 It should be kept in mind that maturation differs along the same bundle since the myelination progresses in the direction of the conduction of the action potential.17,29 The approach of using the average value of the FA in whole fascicles is therefore questionable.17 We preferred to use a manual method for generating the tractograms of the fascicles of each patient. Although automatic methods using atlases are more commonly used because they save time, they can induce a bias in the measurement of FA with values 20 (per cent) lower than the average values calculated by the manual method.30
Increases in FA Values Are Not Only Due to the Bundle Growth
Once the white matter is organized into a network of fibers, the connections become progressively functionally mature due to the myelination, which improves the conduction of the action potential.2,5,29 Myelination (deposit of myelin around the axons) constitutes the last stage of the development of the WM, which covers the period from the second part of pregnancy to the end of adolescence.2,31⇓⇓⇓⇓⇓⇓-38 It occurs earlier and faster under the following conditions: 1) in proximal pathways rather than in distal ones, 2) in sensory pathways (somatosensory, vision, auditory) rather than in motor ones, 3) in projection fibers rather than in associative ones, 4) in central regions rather than in polar ones, and 5) in the occipital pole rather than in the posterior parietal WM and the temporal and frontal poles.2 This asynchrony in the maturation sequence is supposed to depend on the hierarchy of connections between cortical areas: The early maturation of receptive sensory areas (responsible for low-level processing) would enable a stabilization of the information used by integrative areas (involved in high-level processing), which develops later on.2,36
Regarding the evolution of the FA and the volume of all the fascicles as well as the evolution of the volume of the telencephalon (gray and white matter) in our study, we found an increase in FA and volume with age. However, there is a slowdown in the volume growth of the fascicles at 8 years of age, which corresponds to a slowdown in volume growth of the telencephalon. It can then be assumed that the increase in FA of some fascicles after 8 years of age is not the consequence of an increase in the volume of the fascicles but probably the consequence of the myelination. Such discrepancy may be explained by the necessity to maintain similar latencies between brain regions since myelination compensate the delay of latencies caused by brain growth.2,37 In the visual system, for example, the latency of the first positive wave of response to a stimulus reaches the adult latency (100 ms) at around 4 postnatal months, whereas the distance between the retina and the calcarine fissures still increases by around 6 cm until adulthood.2,37
DTI studies and a postmortem series have shown that myelination increases, respectively, earlier in projection fibers than in associative fibers during childhood,2,38 and earlier in commissural and projection fibers than in the associative fibers, just as it begins earlier in the occipital and temporal regions than in the frontal regions,33 in agreement with our results on associative fascicles and a single commissural bundle.
The results of the present study must be interpreted with caution given the small sample. In particular, analyses aiming to determine the effect of age on each WM fascicle FA and volume and those testing the difference in slope between the effect of age on WM fascicle FA and the effect of age on WM fascicle volume were largely underpowered. Further studies conducted on larger samples are warranted to examine more closely the different patterns of maturation processes according to the fasciculus.
CONCLUSIONS
After 8 years, the age at which the total volume of the telencephalon does not increase any longer, we observed an overall increase in the FA of the WM fascicles but not of their volume. The evolution of the FA and the volume of each fascicle follows a maturation process specific to each fascicle. For right and left inferior fronto-occipital fascicles, our analyses indicated an increase in FA with age but not an increase in volume with age. However, the FA and volume of the arcuate part of the superior right longitudinal fasciculus increased with age. Together, these results show that in some fascicles, the augmentation of the FA after 8 years of age may not be the consequence of an increase in the volume of the fascicles but rather the consequence of other processes, such as myelination. Our methodologic approach allows us to shed new light on the development of the WM fascicles between infancy and adulthood, even if our analyses concerned small samples.
References
- Received April 6, 2020.
- Accepted after revision June 7, 2020.
- © 2020 by American Journal of Neuroradiology


