
Abstract
BACKGROUND AND PURPOSE: MR imaging–based apparent diffusion coefficient (ADC) and regional cerebral blood volume (rCBV) measurements have been related respectively to both cell and microvessel density in brain tumors. However, because of the high degree of heterogeneity in gliomas, a direct correlation between these MR imaging–based measurements and histopathologic features is required. The purpose of this study was to correlate regionally ADC and rCBV values with both cell and microvessel density in gliomas, by using coregistered MR imaging and stereotactic biopsies.
MATERIALS AND METHODS: Eighteen patients (9 men, 9 women; age range, 19–78 years) with gliomas underwent diffusion-weighted and dynamic susceptibility contrast-enhanced MR imaging before biopsy. Eighty-one biopsy samples were obtained and categorized as peritumoral, infiltrated tissue, or bulk tumor, with quantification of cell and microvessel density. ADC and rCBV values were measured at biopsy sites and were normalized to contralateral white matter on corresponding maps coregistered with a 3D MR imaging dataset. ADC and rCBV ratios were compared with quantitative histologic features by using the Spearman correlation test.
RESULTS: The highest correlations were found within bulk tumor samples between rCBV and cell density (r=0.57, P < .001) and rCBV and microvessel density (r=0.46, P < .01). An inverse correlation was found between ADC and microvessel density within bulk tumor (r=−0.36, P < .05), whereas no significant correlation was found between ADC and cell density.
CONCLUSION: rCBV regionally correlates with both cell and microvessel density within gliomas, whereas no regional correlation was found between ADC and cell density.
Physiology-based neuroimaging techniques such as diffusion-weighted imaging (DWI) and perfusion-weighted imaging have been used to characterize brain gliomas preoperatively. DWI assesses water diffusivity within intra- and extracellular spaces by means of apparent diffusion coefficient (ADC) measurements. Visual inspection of diffusion and ADC images has been reported as not very useful in differentiating between tumor types, whereas an important trend has appeared toward the use of quantitative diffusion imaging techniques.1 Minimal ADC values have been reported to correlate inversely with glial and nonglial tumor cellularity as a result of the restricted diffusion of water.2–4 ADC values have also been reported to correlate with the content of extracellular hydrophilic components of gliomas such as hyaluronan.5 The considerable overlap of ADC values among high- and low-grade gliomas limits their clinical use for preoperative grading.6,7 The overlap may relate to the presence of focal necrosis within high-grade gliomas. Being focal and macroscopically undetectable, these necrotic components were not excluded from the analysis, leading to higher mean ADC values in these tumors.8 Thus, whether ADC values can be used as a biomarker of cellularity in gliomas should be further investigated.
Dynamic susceptibility-weighted contrast-enhanced (DSC) MR imaging is widely used to study tumor angiogenesis. It provides quantification of the regional cerebral blood volume (rCBV). Increased rCBV has been related to high grade, in particular in gliomas of astrocytic origin.9–15 Clinically, DSC imaging has been successfully used not only for better characterization of brain tumors but also for tumor-recurrence detection. Thus, inclusion of this technique is recommended in diagnostic and follow-up MR imaging protocols for brain tumors. Correlations between maximal rCBV values and microvessel density and vascular endothelial growth factor have been previously reported in gliomas.11–14 Still, rCBV cannot be considered as a valid biomarker of local tumor angiogenesis on the sole basis of studies reporting maximal rCBV values in the whole tumor. Gliomas are highly heterogeneous tumors with areas of low- and high-grade frequently coexisting within a single mass. In fact, this heterogeneity has prompted the targeting of biopsies by functional imaging techniques, such as positron-emission tomography (PET), which are usually coregistered to the high-resolution anatomic MR images.16–18
To study how image-based variables such as ADC and rCBV relate to histology, one must recognize the heterogeneity of gliomas, to compare these measurements locally to the corresponding histologic samples. Stereotactic biopsies of brain tumors guided by imaging techniques provide the ideal sample to apply this strategy.
The purpose of this study was to correlate regionally ADC and rCBV values with cell and microvessel densities in gliomas, by using coregistered MR imaging and stereotactic biopsies.
Materials and Methods
Patients
Eighteen patients (9 men, 9 women; age range, 19–78 years; mean age, 43 ± 17 years) with biopsy-confirmed diagnoses of brain gliomas were included in the study. Institutional review board approval was obtained as well as written informed consent for all patients. Two patients presented with recurrent tumor after surgical resection and without any other previous treatment such as radiation therapy. All other patients presented with a primary lesion with no surgical treatment at the time of biopsy.
Image Data Acquisition
All studies were performed with a 1.5T clinical MR imaging unit (Gyroscan NT; Philips Medical Systems, Best, the Netherlands). DWI and DSC imaging along with anatomic images were acquired in stereotactic conditions before biopsy. Axial DWI was obtained by using a multishot cardiac-triggered spin-echo echo-planar imaging (EPI) sequence (TR/TE, 2 heart beats/13 ms; echo-planar train length, 17; diffusion gradient encoding in 3 orthogonal directions; b=1000 s/mm2; section thickness, 5 mm; gap, 1 mm; FOV, 230 × 161 mm; matrix size, 146 × 208). DSC imaging was performed during the first pass of a bolus of gadopentetate dimeglumine (Dotarem; Guerbet Laboratories, Aulnay-sous-Bois, France) by using a 3D multishot shifted-echo EPI sequence (principles of echo-shifting with a train of observations)19,20 with the following parameters: effective TR/TE, 17/25 ms; flip angle, 7°; FOV, 216 × 270 mm; section thickness, 3.5 mm; data matrix, 51 × 64; and in-plane acquisition voxel size, 4.22 × 4.30 mm (reconstruction, 2.11 × 2.11 mm). A series of 40 multisection acquisitions was acquired at 1.9-second intervals. The first 3 acquisitions were performed before contrast to establish a baseline. At the fifth second, contrast (0.1 mmol/kg) was injected with a power injector (Spectris MR; MedRad, Indianola, Pa) at a rate of 5 mL/s, immediately followed by a bolus injection of saline. Finally, a high resolution 3D dataset was acquired by using a T1-weighted spoiled gradient echo pulse sequence (3DT1) (TR/TE, 20/4.6 ms; FOV, 216 × 270 mm; data matrix, 272 × 512; section thickness, 1.3 mm). This dataset was used for subsequent image coregistration to the 3D PET data. After MR image acquisition, patients were directly transferred to the PET suite where PET with 11C-methionine (MET, 13 patients) or [18F] fluorodeoxyglucose (FDG, 5 patients) images were acquired to provide metabolic information for multitechnique biopsy targeting.
Data Processing
ADC values were calculated on the basis of the following equation:  where S is the signal-intensity strength with pulsed diffusion gradient “on” and S0 is the signal intensity strength with the pulsed diffusion gradient “off” and b is the gradient b factor with a value of 1000 s/mm2. ADC maps were generated automatically by means of pixel-by-pixel calculation.
DSC images were transferred to a commercial workstation (EasyVision; Philips Medical Systems) for postprocessing. The principles for the use of contrast agents to estimate rCBV have been described previously.21–24 Briefly, signal-intensity changes during the first-pass circulation of the contrast are converted to changes in T2 relaxation rate ΔR2, with ΔR2=−ln (S / S0) / TE, where S0 is the signal intensity before contrast (baseline), S is the signal intensity during the passage of contrast material, and TE is the echo time. ΔR2 is approximately linear to the tissue concentration of the contrast agent, and CBV maps are generated by integration of ΔR2 for each voxel. The effects of recirculation or leakage of contrast agent have been reduced by fitting a gamma-variate function to the measured ΔR2 curve.23
Both ADC and rCBV maps have been coregistered to 3D T1-weighted images by using the normalized mutual information-based method25,26 as implemented in the software package Statistical Parametric Mapping (University College, London, UK). The quality of coregistration was controlled by 1 neuroradiologist (N.S., with 6 years of experience) on the basis of anatomic landmarks. The EPI-based images were not corrected for geometric distortion before coregistration. However, none of the biopsy sites were found to be located within areas with high-distortion artifacts.
The coordinates of each biopsy site were labeled during the surgical procedure and were retrospectively localized on the 3D T1 images (by N.S.). Each biopsy site localized on 3D T1 images was traced back to the coregistered CBV and ADC maps. The average signal intensity was computed in regions of interest located at the biopsy site by using MRIcro software (http://www.sph.sc.edu/comd/rorden/mricro.html).27 A circular region of interest, 25–32 mm2, was manually drawn around each biopsy site. The size of the region of interest (approximately 5 × 5 mm2) was chosen to account for a possible inaccuracy between the actual biopsy site and the measurement site. A single observer (N.S.) performed all the measurements on both CBV and ADC maps. In each patient, a single large region of interest (600–1200 mm2) was also placed in the contralateral normal-appearing white matter of the frontal or parietal lobe in both ADC and rCBV maps. ADC and rCBV ratios were calculated, and normalized data were used for further analysis.
Surgical Procedure and Histopathologic Evaluation
Before imaging, a stereotactic head frame was attached to the patient's head under local anesthesia with mild sedation. The biopsy procedure was performed without craniotomy to prevent brain shift, which would interfere with precise biopsy localization on the preoperative MR images. Combined stereotactic MR images and coregistered PET images (Leksell GammaPlan software; Elekta AB, Stockholm, Sweden) were used to guide the biopsy procedures.16–18 One to 3 trajectories with serial biopsies were defined on the coregistered contrast-enhanced 3D T1 and PET images. One to 4 samples were taken at 1-cm intervals along each trajectory. Eighty-eight samples were obtained. Length and diameter of each biopsy sample were approximately 1 cm and 1 mm, respectively. A neuropathologist (I.S., with 20 years of experience), not aware of the MR imaging–based quantification results, determined the final histologic diagnosis in each case based on hematoxylin-eosin (H&E) and routine immunohistochemical markers (glial fibrillary acidic protein, vimentin, p53, and Ki-67 antibodies).28 On the basis of H&E-stained sections, the same neuropathologist categorized each sample as “peritumoral tissue” if no tumor cell was identified, as “infiltrated tissue” if infiltrating tumor cells were identified within brain tissue, or as “bulk tumor” if the tissue consisted only of tumor cells.
Microvessel density was quantified on immunohistochemically stained sections by using the monoclonal antibody to the CD34 antigen specific to endothelial cells (clone QBEND/10; BioGenex, San Ramon, Calif). All sections were counterstained with hematoxylin and mounted. Digital images were captured by using a microscope (BX51; Olympus, Melville, NY) and digital camera (DP 50-CU; Olympus). A high-power objective with a magnification of ×400 was used to generate an optically magnified image, which was captured at a digital resolution of 1392 × 1040 pixels and corresponded to a surface of 321 × 242 μm2. For each sample, 3 separate fields were selected by the neuropathologist, and the average value per high-power field for both microvessel and cell density was used for further evaluation. Microvessels were counted in accordance with the method of Weidner et al.29 To measure cell density, we analyzed digital images by using Image J software (Java image processing program; National Institutes of Health, Bethesda, Md), and each nucleon was automatically counted as a particle in the entire image. The quantitative assessment was performed by 1 observer (N.S.). Seven samples from 4 different patients had to be excluded from analysis because of insufficient tissue material and poor staining quality.
Statistical Analysis
For comparisons between cell and microvessel density versus sample categorization as peritumoral, infiltrated tissue, and bulk tumor, post hoc Kruskal-Wallis tests were used. The Spearman rank order correlation test was used to analyze the relationship between ADC and CBV ratios with tumor cell density and microvessel density. A P < .05 was considered statistically significant. Data were analyzed by using statistical software (StatSoft, Tulsa, Okla).
Results
Table 1 summarizes patient population, histologic diagnosis, and number of biopsy specimens obtained from each patient. Figures 1 and 2 show examples of low- and high-grade gliomas with regions of interest displayed on corresponding biopsy locations on 3D T1 images and coregistered ADC and rCBV maps. Of the 81 biopsy specimens, 9 (11%) corresponded to peritumoral tissue, 39 (48%) corresponded to infiltrated tissue, and 33 (41%) corresponded to bulk tumor on histology. Figures 3 and 4 show the distribution of rCBV and ADC values in the function of both cell and microvessel density, respectively. Each patient is represented with a different symbol to identify samples from the same patient. Table 2 lists the correlation coefficients (r) of ADC and rCBV versus both cell and microvessel density for all sets of samples and each histologic category. For all samples, there was a weak correlation between both cell and microvessel density with rCBV ratios (respectively, r=0.37 and r=0.26) (Fig 3). For bulk tumor samples only, the correlation coefficients between both cell and microvessel density with rCBV ratios increased (respectively, r=0.57 and r=0.46) (Fig 4). Moreover, a weak negative correlation appeared between ADC ratios and microvessel density within bulk tumor (r=−0.36) (Fig 4). In the peritumoral tissue category, in which a small number of samples were available (n=9), the inverse correlation between ADC and microvessel density did not reach statistical significance (r=−0.62, P=.08). There was no correlation between ADC ratios and cell density (Table 2, Figs 3 and 4).

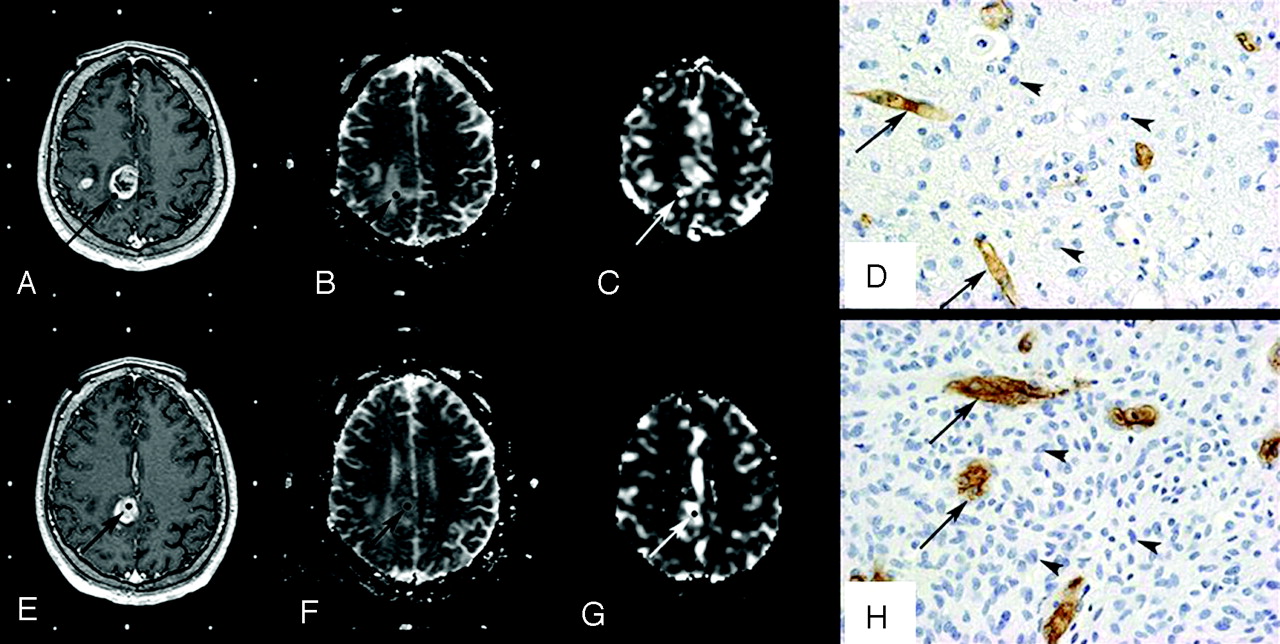
Histopathologic correlation of MR imaging data with stereotactic biopsy specimens in a 19-year-old patient with a right frontotemporal grade II astrocytoma. A–D, Top row shows axial 3D T1-weighted images (TR/TE, 20/4.6 ms) with contrast (A), coregistered ADC map (B), coregistered rCBV map (C), and corresponding histopathologic results for a “peritumoral tissue” sample (D). E–H, Bottom row shows axial 3D T1-weighted images (TR/TE, 20/4.6 ms) with contrast (E), coregistered ADC map (F), coregistered rCBV map (G), and corresponding histopathologic results for a “infiltrated tissue” sample (H). Regions of interest where ADC and rCBV have been measured are illustrated (arrows). The samples were immunohistochemically stained by using a monoclonal antibody against the CD34 antigen to assess microvessel density (arrows) and counterstained with hematoxylin to assess cell density (arrowheads) (original magnification, × 400).

Histopathologic correlation of MR imaging data with stereotactic biopsy specimens in a 50-year-old patient with a right parietal grade IV astrocytoma. A–D, Top row shows axial 3D T1-weighted images (TR/TE, 20/4.6 ms) with contrast (A), coregistered ADC map (B), coregistered rCBV map (C), and corresponding histopathologic results for an “infiltrated tissue” sample (D). E–H, Bottom row shows axial 3D T1-weighted images (TR/TE, 20/4.6 ms) with contrast (E), coregistered ADC map (F), coregistered rCBV map (G), and corresponding histopathologic results for a “bulk tumor” sample (H). Regions of interest where ADC and rCBV have been measured are illustrated (arrows). The samples were immunohistochemically stained by using a monoclonal antibody against the CD34 antigen to assess microvessel density (arrows) and counterstained with hematoxylin to assess cell density (arrowheads) (original magnification, × 400).

Scatterplots show a positive correlation between rCBV ratios and both cell density (n = 81, r = 0.37, P < .001) (A) and microvessel density (n = 81, r = 0.26, P < .05) (B) in the whole set of samples. There is no significant correlation between ADC ratios and either cell density (n = 81, r = 0.11, P = .34) (C) or microvessel density (n = 81, r = −0.20, P = .08) (D). Spearman rank correlation test was used, and P < .05 was considered to be statistically significant.

Scatterplots show higher correlation between rCBV ratios and both cell density (n = 33, r = 0.57, P < .001) (A) and microvessel density (n = 33, r = 0.46, P < .01) (B) in bulk tumor than in the whole set of samples (Fig 3). In bulk tumor, there is no significant correlation between ADC ratios and cell density (n = 33, r = −0.20, P = .26) (C), whereas an inverse correlation between ADC and microvessel density is found (n = 33, r = −0.36, P < .05) (D). Spearman rank correlation test was used, and P < .05 was considered to be statistically significant.
Patient population
Results of Spearman rank correlation test between rCBV and ADC ratios versus cell and microvessel density
Discussion
Our study, conducted regionally within gliomas, showed a positive correlation between rCBV and both cell and microvessel density. This correlation was weak for all biopsy samples including peritumoral tissue and infiltrated tissue but became stronger when considering only bulk tumor samples. This finding is consistent with the known physiopathology of tumor progression in malignant gliomas. In fact, cell proliferation and angiogenesis are known to occur in malignant gliomas because rapid cell proliferation results in hypoxic conditions, which initiate the release of humoral factors such as vascular endothelial growth factor that promote angiogenesis.30,31 The weaker correlation between rCBV and microvessel density may be related to the wide variation of blood vessel structures within gliomas. In fact, electron microscopy analysis of capillary endothelial proliferation in malignant gliomas shows that the vessels within these tumors are essentially composed of immature capillaries with a narrow slitlike lumen with no blood cells in the lumen.32 Because rCBV is a measure of the blood volume in functional capillaries and is calculated by the volume of contrast passing through them, immature capillaries with no blood flow will not contribute to rCBV. Therefore, there is a partial mismatch between angiogenesis and blood volume determinations. Similar spatial discordance has been reported by Law et al33 between areas of high rCBV in gliomas and regions of elevated vascular permeability measured by means of contrast transfer coefficient (Ktrans). They relate this finding, in part, to the presence of new immature and leaky blood vessels in the early stages of tumor proliferation, where rCBV is low and Ktrans is high.33 These immature slitlike vessels are likely to be poor conduits for chemotherapeutic agents. Therefore, antiangiogenic agents such as bevacizumab are used to increase the efficacy of cytotoxic agents by normalizing tumor vasculature.34
The low correlation between rCBV and microvessel density in gliomas is not opposed to the fact that high-grade tumors present usually with higher values of rCBV compared with low-grade tumors. However, this low correlation underlines the complexity of the process of neoangiogenesis, which cannot be summarized to a simple increase of vessel number allowing a higher blood volume within tumor tissue. Other histologic and physiologic parameters, such as the actual lumen permeability of the vessel, should be considered to explain the higher rCBV values in high-grade gliomas.
This study, which takes into account the regional heterogeneity of gliomas, does not confirm the inverse correlation between ADC and cell density reported in previous studies.2–4 The previously reported inverse correlation in the literature did not reach statistical significance in our samples, even in those corresponding to bulk tissue. This finding underlines the impact of other determinants of water diffusivity within the complex microenvironment encountered in gliomas. As previously reported, edema, necrosis, and extracellular matrix components constitute some of such parameters that may influence ADC values within gliomas.5–8 Thus low ADC values within a tumor must be interpreted cautiously, integrating other image-based information. Our results, however, do not exclude the finding that low ADC values are markers of high malignancy within gliomas. In fact, according to the literature, an enlargement of extracellular space accompanies high cellularity in nonoligodendroglial gliomas, but tortuosity increases in this enlarged extracellular space of the more malignant lesions.35–37 Such changes in the physical characteristics of the extracellular matrix may actually explain the decreased ADC previously reported in high-grade gliomas.
An inverse correlation appeared between ADC values and microvessel density within bulk tumor. In the infiltrated and peritumoral tissue, ADC values seem to be affected more by other tissue components, such as edema and extracellular matrix, than by cell and microvessel density. A recent retrospective correlative study by Stadlbauer et al38 reported a weak linear correlation (r=0.41) between mean diffusivity (MD, based on diffusion tensor imaging) and tumor cell density number. Because MD is mathematically equivalent to ADC, our results could be compared with previous results. In the study of Stadlbauer et al, the authors used 77 stereotactic biopsy specimens in 20 patients to locally compare MD to histologic features. Each sample was considered an independent measurement and did not distinguish between different categories such as peritumoral, infiltrated, and bulk tumor. Instead, they used a quantification based on a tumor cell immunohistochemical marker. For comparative purposes, their samples with very low tumor cell count may be assimilated to our peritumoral tissue category, whereas samples with high tumor cell count correspond to what we categorized as bulk tumor. Stadlbauer et al found low MD values for samples with very low tumor cell numbers. The MD distributions in samples categorized with relatively high tumor cell numbers, categorically equivalent to infiltrated tissue and bulk tumor in our study, appear similar to our results. Therefore, the weak correlation reported in their study may result from considering peritumoral samples with very low cell density and very low MD values.
One limitation of our study was that stereotactic biopsies were not targeted by CBV or ADC maps but by contrast T1-weighted and PET data. However, because multiple samples were taken along each trajectory, with 1-cm distance between each sample, different areas of each tumor were sampled, including areas of high and low PET metabolite uptake. Further studies targeting biopsy areas corresponding to high rCBV and low ADC values may show stronger correlation with histologic parameters.
A limitation of our study was that total cell density was considered for comparison, so tumor cells were not separated from brain parenchymal cells. Physiologically, however, normal brain cells also affect the water diffusivity within the tissue, and most previous reports did not distinguish tumor cells from normal parenchymal cells. Still, tumor cells have a specific influence on the constitution of the extracellular matrix. This could explain the increased correlation that we found in the bulk tumor compared with the infiltrated tissue because it is known that in bulk tumor, most of the cell population is made of tumor cells rather than parenchymal normal cells.
The relatively limited number of patients is another limitation of the study. The small sample size is inherent to our inclusion criteria, which restricts the study to patients in whom regional information on histopathology was available from a stereotactic biopsy procedure.
Another limitation of this study is related to the possible errors arising from distortion artifacts of EPI-based data during the procedure of coregistration. The development of new imaging techniques without EPI and therefore less affected by magnetic susceptibility artifacts may allow for a more accurate coregistration of images in the future.8 The potential mismatch between biopsy site and the placement of regions of interest on the MR images has been minimized in this study by including only closed brain biopsies to prevent brain shift and choosing a relatively large region of interest to account for such inaccuracies.
In conclusion, in gliomas, which are characterized by their regional heterogeneity, this direct correlation study did not confirm the previously reported inverse correlation between ADC values and cell density, whereas rCBV values were correlated to both cell and microvessel density, in particular within glioma bulk tumor areas.
Acknowledgments
We thank to Mary Grace Johnson for her help in the preparation of this manuscript.
Footnotes
N. Sadeghi was supported by Fond National de la Recherche Scientifique (FNRS) and Erasme Foundation grants. C. Decaestecker is a Senior Research Associate with the FNRS, Brussels, Belgium.
Paper previously presented at: Annual Meeting of the American Society of Neuroradiology, June 9–14, 2007; Chicago, Ill.
References
- Received June 22, 2007.
- Accepted after revision August 13, 2007.
- Copyright © American Society of Neuroradiology
In this issue


Jump to section
Related Articles
Cited By...
- Detection of local microvascular proliferation in IDH wild-type Glioblastoma using relative Cerebral Blood Volume
- Voxelwise and Patientwise Correlation of 18F-FDOPA PET, Relative Cerebral Blood Volume, and Apparent Diffusion Coefficient in Treatment-Naive Diffuse Gliomas with Different Molecular Subtypes
- Estimating Local Cellular Density in Glioma Using MR Imaging Data
- Non-Contrast-Enhancing Tumor: A New Frontier in Glioblastoma Research
- Glioma grade map: a machine-learning based imaging biomarker for tumor characterization
- Accurate Patient-Specific Machine Learning Models of Glioblastoma Invasion Using Transfer Learning
- A Multiparametric Model for Mapping Cellularity in Glioblastoma Using Radiographically Localized Biopsies
- Correlation of Tumor Immunohistochemistry with Dynamic Contrast-Enhanced and DSC-MRI Parameters in Patients with Gliomas
- Mitotic Activity in Glioblastoma Correlates with Estimated Extravascular Extracellular Space Derived from Dynamic Contrast-Enhanced MR Imaging
- A Prognostic Model Based on Preoperative MRI Predicts Overall Survival in Patients with Diffuse Gliomas
- Comparison of 18F-FET PET and Perfusion-Weighted MR Imaging: A PET/MR Imaging Hybrid Study in Patients with Brain Tumors
- Assessment of Angiographic Vascularity of Meningiomas with Dynamic Susceptibility Contrast-Enhanced Perfusion-Weighted Imaging and Diffusion Tensor Imaging
- Differentiation of Primary Central Nervous System Lymphomas and Glioblastomas: Comparisons of Diagnostic Performance of Dynamic Susceptibility Contrast-Enhanced Perfusion MR Imaging without and with Contrast-Leakage Correction
- Phase I Study of GRN1005 in Recurrent Malignant Glioma
- Persistent Diffusion-Restricted Lesions in Bevacizumab-Treated Malignant Gliomas Are Associated with Improved Survival Compared with Matched Controls
- The Added Value of Apparent Diffusion Coefficient to Cerebral Blood Volume in the Preoperative Grading of Diffuse Gliomas
- Imaging biomarkers of angiogenesis and the microvascular environment in cerebral tumours
- Correlation of MR Relative Cerebral Blood Volume Measurements with Cellular Density and Proliferation in High-Grade Gliomas: An Image-Guided Biopsy Study
- Distinguishing Recurrent Primary Brain Tumor from Radiation Injury: A Preliminary Study Using a Susceptibility-Weighted MR Imaging-Guided Apparent Diffusion Coefficient Analysis Strategy
- Switching on the Lights for Real-Time Multimodality Tumor Neuroimaging: The Integrated Positron-Emission Tomography/MR Imaging System
- Candidate Biomarkers of Extravascular Extracellular Space: A Direct Comparison of Apparent Diffusion Coefficient and Dynamic Contrast-Enhanced MR Imaging--Derived Measurement of the Volume of the Extravascular Extracellular Space in Glioblastoma Multiforme