
Abstract
BACKGROUND AND PURPOSE: Previous (separately performed) perfusion CT (PCT) and PET studies have been inconclusive regarding the correlation of functional tumor characteristics. The purpose of this study was to perform dual assessment of head and neck squamous cell carcinomas (SCCAs) to examine the relationship between perfusion measurements derived from PCT and glucose standardized uptake values (SUV).
MATERIALS AND METHODS: We prospectively evaluated 15 primary and recurrent SCCAs using combined positron-emission tomography (PET) and CT of the head and neck. SUVmean, SUVmax, blood flow (BF), blood volume (BV), mean transit time (MTT), and permeability (PS) values were calculated with use of manually drawn regions of interest (ROIs) over the lesions and the healthy muscle tissue. Parametric comparison test, correlation coefficients, and regression analysis were performed.
RESULTS: The mean (± SD) SUVmean, SUVmax, BF, BV, MTT, and PS values in the tumor tissue were 6.26 (± 1.48), 15.25 (± 3.81), 91.50 (± 24.69), 5.08 (± 1.17), 7.51 (± 2.24), and 23.08 (± 8.77), respectively. All PET/CT and PCT parameters of muscle versus tumor tissue were statistically different (.0001 < P < .001). There were significant correlations between BF and SUVmax as well as SUVmean (r = 0.57; P = .02 and r = 0.63; P = .011, respectively) in the tumors. Significant correlation was also found between PS and SUVmean (r = 0.53; P = .04) in the tumors. Regression analysis showed: SUVmax = 0.09 × BF + 7.2 (R2 = 0.33; P = .02), SUVmean = 0.05 × BF + 2.22 (R2 = 0.45; P = .011), and SUVmean = 0.05 × PS + 5.36 (R2 = 0.35; P = .04). The tumor to nontumor (muscle) SUVmean and SUVmax ratio was 9.45 (± 3.55) and 17.58 (± 4.32), respectively. BF-ratio SUVmean and BF-ratio SUVmax showed significant correlations (r = 0.64; P = .01 and r = 0.53; P = .04, respectively). Regression analysis showed ratio SUVmean = 0.14 × BF-3.48 (R2 = 0.42; P = .01) and ratio SUVmax = 0.14 × BF + 4.51 (R2 = 0.29; P = .04).
CONCLUSION: Tissue perfusion-metabolic coupling is evident in head and neck SCCAs and may provide additional diagnostic information in patients undergoing PET/CT studies.
Initial evidence with perfusion CT (PCT) and absolute quantification of the blood flow (BF), blood volume (BV), mean transit time (MTT), and permeability surface-area product (PS) has revitalized the role of CT in the diagnosis1-4 and therapeutic monitoring of the head and neck tumors.5,6 Positron- emission tomography (PET) with [18F] fluorodeoxyglucose (FDG) has been reported to improve the accuracy in the diagnosis, staging, and detection of recurrence in head and neck cancers.7 It is unclear whether parametric values from these modalities correlate significantly (either in a positive or negative way). There is only very limited evidence in the literature with conflicting results for various organs.8-10 Furthermore, in these reports, the functional studies were separately acquired (and subsequently fused). The PET protocol and the postprocessing of the PCT varied between the studies. In 1 study, the tumor model was examined in animals,9 and only BF was correlated with the mean standardized uptake value (SUV) in PET/CT.
In our study, we sought to address these limitations by examining the relationship between all PCT-derived values, which provide information on the availability of glucose supply to the cells, and maximal as well as mean SUV in head and neck tumors and in healthy muscle tissue in human subjects by means of combined in vivo PCT and PET/CT imaging.
Materials and Methods
Patients
Fifteen patients (mean age [± SD], 61 [± 9] years) with histologically confirmed primary or recurrent head and neck tumor were prospectively evaluated by a combined PET/CT whole-body imaging with a subsequent dedicated PET/CT scanning of the head and neck and PCT. Seven patients had a primary squamous cell carcinoma (SCCA; 5 of the oropharynx, 1 of the larynx, 1 of the skin), 2 patients had a histologically confirmed recurrence of a treated SCCA (1 in the oropharynx and 1 in the hypopharynx), and 6 patients were referred with clinically confirmed (after biopsy) evidence of SCCA recurrence at the treated tumor site (oropharynx in 3 patients, hypopharynx/larynx in 2 patients, and nasopharynx in 1 patient). The SCCAs were classified as T2 in 5 patients, T3 in 8 patients, and T4 in 2 patients according to the TNM staging system. All patients provided informed consent for the imaging studies according to our institutional review board (IRB) guidelines, and we obtained IRB approval.
PET/CT Imaging Protocol
All subjects fasted after midnight and avoided high-carbohydrate meals during the previous 24 hours so that before dose administration, blood glucose levels of the patients were less than 150 mg/dL. Approximately 1 hour after intravenous dosing with 0.5 mg/kg 18F-6-fluoro,-two deoxyglucose (FDG), a scout, followed by low-dose (50 mA) CT attenuation correction scan (CTAC) in a 16-section multidetector CT scanner (Discovery ST; GE Medical Systems, Milwaukee, Wis) was obtained from the top of the head down to the thoracic inlet. Next, a 4-minute per FOV emission scan over 2 FOVs was obtained. A dedicated postprocessing workstation (VoxTool 6.8.6, AW 4.3; GE Medical Systems) produced attenuation-corrected FDG images from ordered subset expectation maximization reconstructions with filtering (2 iterations of 30 subsets with use of a Gaussian blurring filter), along with fused FDG/CTAC images in 3 orthogonal planes. SUVmean and SUVmax values were measured (g/mL) in 3D voxels, which delineated the tumor and nearby muscle. Our choice to also calculate SUVmax was justified by the increased use of these values in the daily practice in oncology for the detection of malignant lesions and prediction of the therapeutic outcome.11 Therefore, we sought to find whether SUVmean or SUVmax correlated more significantly with the perfusion parameters.
PCT Imaging Protocol
We obtained PCT studies in the tumor site using the same multidetector PET/CT scanner after on-line evaluation of the PET/CT SUV maps, which served as localizers for the detection of the location with the pathologic glucose uptake. In the case of tumors exceeding the anatomic coverage of PCT in a craniocaudal direction (20 mm), the levels of interest were centered on the area of gross anatomic distortion, all of which showed abnormal FDG uptake. For the PCT studies (100 mA, 80 kV), 45 mL of a nonionic iodinated contrast agent (Iohexol; Omnipaque, Amersham Health, Princeton, NJ, 300 mg/mL) was injected intravenously at 6 mL/s through a 18-gauge antecubital cannula. The administration of contrast agent was followed by a power-injection of 20 mL of saline at the same flow rate. The PCT was initiated after a 6-second delay, and 4 contiguous 5-mm-thick CT images were acquired every second for 55 seconds at the predetermined levels of interest.
Postprocessing of the PCT and PET/CT Data
The postprocessing was performed by a neuroradiologist in consensus with a nuclear medicine radiologist. The dynamic CT data were off-line transferred to a workstation (AW 4.2; GE Medical Systems) running a commercial software package (Perfusion 3; GE Medical Systems). We generated parametric maps with the mean perfusion values (in concordance with the analysis of the mean SUV) using the central volume principle and a deconvolution-based approach with calculation of the PS: BF (in mL/100 g tissue/min), BV (in mL/100 g tissue), MTT (in s), and PS (in mL/100 g tissue/min). To assess differences between malignant lesions and healthy-appearing structures, we obtained SUV and mean perfusion values using standardized (approximately 20 mm2) regions of interest (ROIs), for the left paraspinous muscles in all patients. We then defined the extent of the pathologic lesions using freehand-drawn ROIs in every level separately on PET/CT and PCT maps, excluding regions with gross necrosis. Functional parameters from the ROIs were calculated by averaging the extracted values for the 4 sections.
Statistical Analysis
All analyses and graphs were performed with SPSS (SPSS 15.0 for Windows; SPSS, Chicago, Ill). Continuous variables are presented as mean ± SD and 95% confidence interval. Normal distribution was determined by the Kolmogorov-Smirnov test for the following PCT and PET variables: BF, BV, MTT, PS, SUVmean, SUVmax, and ratios of both SUV parameters (Ratio SUVmean and Ratio SUVmax) of tumor to nontumor (healthy-appearing muscle tissue). Pearson correlation coefficients and regression analysis (with coefficients of determination R2) were applied to determine relationship among variables for PCT and PET values. A P value of .05 or less was considered to indicate a statistically significant difference for all statistical tests.
Results
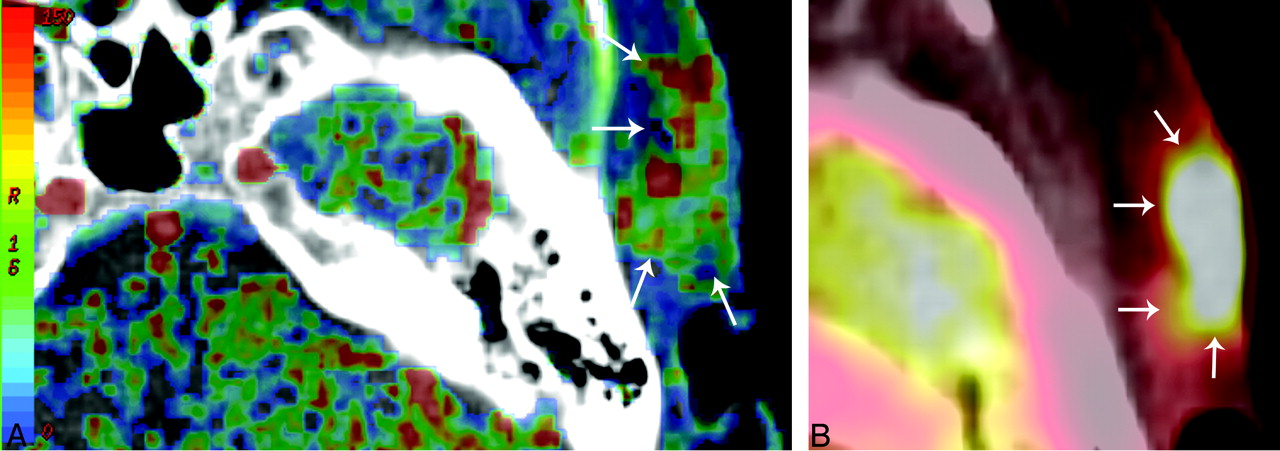
All PET/CT and PCT studies were sequentially acquired without adverse effects and were suitable for further evaluation. The summary statistics for the PET and PCT measurements in the healthy-appearing muscle tissue and in the tumors are demonstrated in Table 1. A representative case of PET/CT and PCT imaging in a patient with primary skin SCCA is shown in Fig 1.

Tissue perfusion CT map (A) and PET/CT SUVmean map (B) of a 54-year-old woman with a SCCA in the skin on the left temporal side. Blood flow (A) map shows a hypervascularized area in the subcutaneous region with infiltration of the cutis (arrows). The increased perfusion of the neoplastic tissue is coupled with increased SUV uptake (B) in the FDG PET/CT imaging (arrows).
Summary statistics mean (SD) and 95% confidence interval of the SUV values (SUVmax and SUVmean) and mean tissue perfusion parameters in healthy-appearing muscle tissue and neoplastic lesions
All functional PET/CT (SUVmean and SUVmax) and PCT parameters (mean BF, BV, MTT, and PS) in tumors were very different from the corresponding parameters in healthy-appearing muscle tissue at a very high level of statistical significance (.0001 < P < .001). In the pooled ROIs (tumor and muscle tissue ROIs) group, significant correlations were observed among SUVmax and SUVmean and the tissue perfusion parameters (Table 2).
Pearson correlation coefficients between SUV values (SUVmax and SUVmean) and mean tissue perfusion parameters in healthy-appearing muscle tissue and neoplastic lesions
Unlike the pooled ROIs in which high correlation coefficients were caused by the linear relationship between healthy and pathologic values,12 further correlation coefficient analysis only in the tumor ROIs revealed limited correlations as follows: between BF and SUVmean (r = 0.63; P = .011), between BF and SUVmax (r = 0.57; P = .02), and between PS and SUVmean (r = 0.53; P = .04). Regression analysis between SUV parameters and BF showed SUVmax = 0.09 × BF + 7.2 (R2 = 0.33; P = .02) and SUVmean = 0.05 × BF + 2.22 (R2 = 0.45; P = .011) (Fig 2). In a similar fashion, regression analysis between PS and SUVmean revealed SUVmean = 0.05 × PS + 5.36 (R2 = 0.35; P = .04).

Regression analysis of the mean BF values in the tumor (triangles) and healthy tissue (circles) with the SUVmean. There is a positive significant correlation (r = 0.63; P = .011) in the tumor ROIs. Linear regression analysis showed SUVmean = 0.05 × BF + 2.22 (R2 = 0.45; P = .011) (regression line). The curved dashed lines show the 95% confidence intervals for the tumor ROIs means. The dashed line depicts the line of perfect agreement (equation line).
The BV values in the tumor ROIs did not demonstrate any significant correlation with the SUVmean and SUVmax (r = 0.06–0.14; P ≥ .62). The MTT values in the tumors showed a negative, but not significant, correlation with the SUVmean(r = −0.3; P = .27) and a weak nonsignificant correlation with SUVmax (r = 0.16, P = .4).
Regarding the tumor-to-nontumor (muscle) SUVmean and SUVmax ratios, descriptive statistics showed that the tumor-to-muscle SUVmean ratio was 9.45 ± 3.55 (8.43–10.78), whereas the SUVmax ratio was 17.58 ± 4.32 (15.48–19.04). Correlation coefficient analysis between BF in tumor tissue and SUV ratios of tumor to muscle demonstrated significant correlations: BF–Ratio SUVmean: r = 0.64; P = .01; BF–Ratio SUVmax: r = 0.53; P = .04. Regression analysis of the above significantly correlated parameter showed Ratio SUVmean = 0.14 × BF–3.48 (R2 = 0.42; P = .01) and Ratio SUVmax = 0.14 × BF + 4.51 (R2 = 0.29; P = .04) (Fig 3). The correlation coefficients between the other perfusion CT parameters and SUV ratios of tumor to muscle were not significant and ranged from −0.08 (MTT-Ratio SUVmean) to 0.35 (BV–Ratio SUVmax; P ≥ .29).

Regression analysis of the mean BF values in the tumor with the SUVmean ratios of tumor-to-nontumor tissue. There is a positive significant correlation (r = 0.64; P = .01) in the tumor ROIs. Linear regression analysis showed Ratio SUVmean = 0.14 × BF–3.48 (R2 = 0.42; P = .01) (regression line). The curved dashed lines show the 95% confidence intervals for means. The dashed line depicts the line of perfect agreement (equation line).
Discussion
The biologic basis of FDG-PET is the increased glucose metabolism of malignant cells compared with noncancerous tissue. After administration of the radiopharmaceutical, FDG is transported into the tumor cell, phosphorylated by hexokinase, and then trapped inside the tumor cell, as it is neither processed in the glycolytic pathway nor able to leave the cell. Thus, it can be visualized on PET scan. The rate of FDG uptake in primary lung cancer has correlated with the degree of differentiation of the tumor; doubling time of the tumor; proliferation rates; and, thus, aggressiveness,13,14 whereas the overexpression of glucose transporters has been associated with poor prognosis in patients with oral SCCA.15 For glucose to be taken up and used by SCCA, an adequate vascular supply, including neoangiogenesis-induced vasculature, is necessary. PCT provides information about tissue perfusion in the intravascular and extravascular extracellular space, which has been shown to correlate also with histopathologic grade and angiogenic stimuli, such as vascular endothelial growth factor.16,17 The relationship between these 2 imaging techniques and whether their roles may be complementary in tumor imaging of different organs have remained controversial topics, partly because direct comparison of these modalities by means of combined imaging has so far not been performed in humans.
The regulation of glucose use in cells is complex and involves various levels and different metabolic pathways. For example, increased glycolysis can be a response to an increase in cellular energy, increase in cell proliferation and synthesis rates, and activation of specific oncogenic pathways even in the presence of adequate oxygen (Warburg effect).18 Tumor hypoxia occurs when a rapidly growing tumor eventually surpasses the host–tissue-derived vascularization that can only provide microcirculatory functions in selected parts of the tumor. Where the tumor must depend on tumor-derived neovascularization, the delivery of oxygen and nutrients is severely compromised, giving rise to chronic or diffusion-limited hypoxia, which is exacerbated by deterioration of blood rheology, platelet aggregation, and increased interstitial pressure within the tumor. Hypoxia is also believed to induce a shift from aerobic to anaerobic glycolysis, which is associated with production of lactate and lower pH values. However, evidence from a direct comparison of SUV with hypoxia markers contradicts this view,19 and discrimination between chronic and acute hypoxic environment may play an important role in understanding the decrease or increase of metabolic activity in the neoplastic tissue, respectively.18 Moreover, tumor hypoxia seems to be a spatially and temporally heterogeneous phenomenon, resulting from the combined effect of many factors, including tumor type and volume, disease site (specific organ or tissue), regional microvessel attenuation, BF, oxygen diffusion and consumption rates, etc. Thus, a consistent pattern has not always been observed between local glucose use and hypoxia as monitored by FDG-PET, fluoromisonidazole-PET imaging, and pO2 measurements.20,21
In our study, we correlated values and ratios of FDG SUV and mean tissue perfusion (BF) as well as other PCT-associated parameters (BV, MTT, and PS) obtained, thereby eliminating any measurement inaccuracies during the coregistration of values obtained from separate PET and CT scans. The mean SUVmean of the SCCA in our study is slightly lower than those reported by Hirasawa et al8 in 16 patients with head and neck tumors and by Miles et al22 in 2 cases with SCCA of the lung. On the other hand, the mean SUVmean of the SCCA in our study is higher compared with the values reported by Tateishi et al10 in 12 patients with SCCA of the lung. The PCT values in tumor tissue reflected also the neovascularity, were in close agreement with those reported in the literature, and were significantly different from those in the muscle tissue.1-3,23 Relatively large SDs in the tumor PS values and muscle BF and PS parameters, as also shown in the initial work of Gandhi et al,3 were evident in our population without affecting the differentiation between the 2 types of tissue.
In our study, there was a statistically significant correlation between SUVmean and SUVmax and mean BF in the tumor tissue. This correlation indicates a coupling between 2 different functional parameters regarding SCCA physiology. This coupling may be anchored in the paradoxical situation in which tumor cells growing in conditions of normal oxygen tension (which may be provided by adequate blood supply) can also show an elevated glycolytic rate (Warburg effect).24 Moreover, a positive relationship between increased perfusion and tissue oxygenation, which is subsequently expressed in glucose metabolism, has been observed in breast and lung tumors.10,25 It is notable that Mankoff et al25 showed a positive correlation between SUV and BF measured with 15H2O-PET (considered the criterion standard in determination of BF) in patients with advanced breast cancer. Other PCT studies8,9 in liver and head and neck cancers have shown that a negative correlation between SUV and tissue perfusion may also exist. In these cases, it has been postulated that the increasing neoangiogenesis of the tumor results in inadequate oxygen supply, which subsequently leads to an uncoupling of glucose uptake and BF.
Previous PCT studies have not examined any correlation between PS values (as a marker of neoangiogenesis) and SUV. It has also been hypothesized that the negative correlation may be because of the hypoxia induced by the massive tumor cell proliferation that distances cells from the vasculature. Such an influence of the size of the tumor on the SUV-BF correlation has been recently observed in lung tumors.22 In contrast to the aforementioned results of an inverse correlation between perfusion and SUV, the results of our study are distinct because the positive correlation between blood glucose metabolism and perfusion was observed in mostly moderately large (T2–3) SCCAs and was accompanied with a weak, but statistically significant, correlation with PS values, which indicated a coupling of the neoangiogenesis with the glucose metabolism. A previous study of separate PET and MR imaging studies in liver metastases of colorectal cancer showed a nonsignificant, negative correlation between rate constant κep (a parameter akin to PS) and the tumor-to-nontumor SUVmean ratio.19 We believe that the different modalities and histologic characteristics of the tumor may be the reasons for this discrepancy. Another study in patients with lung cancer showed a positive correlation between SUV and PS.26 Future studies would need to examine the relationship between SUV and PS (ie, a potential mismatch between PS and SUV would indicate a peritumoral inflammation since it can theoretically have increased SUV but not increased neo-angiogenesis).27 This relationship has to be elucidated in future studies. Our PS results should be interpreted cautiously because the applied postprocessing software may provide a wide range of PS relative to BF in the tumor capillaries, which, in turn, may lead to an inaccurate determination of both parameters.28 Finally, our results may not apply in other head and neck tumor types nor in neoplastic tissue in other organs because of differences in histologic features, tumor size, degrees of cellularity, and necrosis.29
The SUV values in our study did not correlate with BV and MTT in the tumors, though a negative correlation between BF (as well as SUV) and MTT may exist because of the newly formed tumor vasculature, characterized by extensive arteriovenous shunts, that may lead to a rapid washin and washout of the contrast agent and FDG-labeled blood.1 We attribute the lack of correlation between BV and SUV to the different nature of the measured values. The “lumped” BV value in our postprocessing protocol expresses the whole intravascular and extravascular extracellular BV, and thus correlation with cell metabolism may not be achievable.
Initial work on the predictive value of PCT and PET has been already separately performed. Zima et al6 investigated the response prediction of advanced SCCA treated with induction chemotherapy, whereas Hermans et al23 showed a predictive value of BF in the outcome of SCCA treated with radiation therapy. In a similar fashion, SUV measurements performed by Schwartz et al30 showed an association between baseline primary tumor FDG SUV and SCCA outcomes, but no predictive value of the nodal SUV, whereas a recent study of nasopharyngeal carcinoma showed that patients having tumors with high 18F-FDG uptake had a significantly lower 3-year disease-free survival rate than patients with lower tumor uptake.31 The results of our study shed light on the biology of head and neck SCCA and may potentially find application in the dual-technique assessment (which can be rapidly performed in the same setting) of untreated head and neck SCCAs that could determine the contribution (or added value) in predicting the behavior and prognosis of a tumor. For instance, the noninvasive dual-technique pretreatment assessment of SCCAs and the degree of correlation (match or mismatch) between SUV and SCCA perfusion may provide additional information about tissue oxygenation status, which is of significant importance for both radiation and chemotherapy (including induction chemotherapy) outcomes. In such cases, a pixel-to-pixel evaluation of the tumor tissue may be advantageous. Thus, the therapeutic options may potentially be tailored on an individual basis. Beyond this point, the dual functional assessment of SCCA may provide an improved monitoring tool because the evident role of the FDG-PET/CT technique may be enhanced by PCT, for which some preliminary experience exists.1
Our findings were limited by the small patient population and the subsequent lack of a sufficient number of small versus advanced SCCAs. Furthermore, partial volume averaging during the manual delineation of the tumor tissue in FDG PET/CT and PCT was an inevitable limitation. The mean value of perfusion and SUV parameters indicate the value of these variables over the ROI, but it does not reflect the heterogeneity of a tumor. Although tumor heterogeneity was not taken into account in our study, the data were corrected for gross necrosis. Statistical analyses, such as histogram analysis or pixel-to-pixel evaluation, may be used to characterize spatial heterogeneity in future studies. Correlation of our findings with tumor oxygenation measurements by oxygen-sensitive needle electrodes could be performed to determine the relationship of functional imaging and tumor hypoxia.
Conclusions
Our study contributes to the understanding of the relationship between 2 noninvasive promising functional imaging modalities (PET and PCT). The increased and positively correlated SUV and tissue perfusion indices may be based on the increased tissue oxygenation and the lack of any acute or chronic hypoxic conditions in the assessed head and neck SCCAs. Our results may lead to better understanding of tumor pathophysiology, pretherapeutic planning, and follow-up imaging of the patient.
References
- Received February 1, 2008.
- Accepted after revision March 3, 2008.
- Copyright © American Society of Neuroradiology
In this issue


Jump to section
Related Articles
Cited By...
- The Flow-Metabolic Phenotype of Primary Colorectal Cancer: Assessment by Integrated 18F-FDG PET/Perfusion CT with Histopathologic Correlation
- Prediction of Locoregional Control in Head and Neck Squamous Cell Carcinoma with Serial CT Perfusion during Radiotherapy
- CT Perfusion of the Neck: Internal Carotid Artery versus External Carotid Artery as the Reference Artery