
Abstract
BACKGROUND AND PURPOSE: TA is a branch of image processing that seeks to reduce image information by extracting texture descriptors from the image. TA of MR images of anatomic structures in mild AD and aMCI is not well-studied. Our objective was to attempt to find differences among patients with aMCI and mild AD and normal-aging subjects, by using TA applied to the MR images of the CC and the thalami of these groups of subjects.
MATERIALS AND METHODS: TA was applied to the MR images of 17 patients with aMCI, 16 patients with mild AD, and 16 normal-aging subjects. The TA approach was based on the GLCM. MR images were T1-weighted and were obtained in the sagittal and axial planes. The CC and thalami were manually segmented for each subject, and 44 texture parameters were computed for each of these structures.
RESULTS: TA parameters showed differences among the 3 groups for the CC and thalamus. A pair-wise comparison among groups showed differences for AD-control and aMCI-AD for the CC; and for AD-control, aMCI-AD, and aMCI-control for the thalamus.
CONCLUSIONS: TA is a useful technique to aid in the detection of tissue alterations in MR images of mild AD and aMCI and has the potential to become a helpful tool in the diagnosis and understanding of these pathologies.
Abbreviations
- AD
- Alzheimer disease
- aMCI
- amnestic mild cognitive impairment
- ANGSECMOM
- angular second moment
- CC
- corpus callosum
- CORRELAT
- correlation
- CDR
- Clinical Dementia Rating
- cont
- control
- d
- distance
- DIFVARNC
- difference variance
- DTI
- diffusion tensor imaging
- GLCM
- gray level co-occurrence matrices
- IDM
- inverse difference moment
- MCI
- mild cognitive impairment
- θ
- direction
- VBM
- voxel-based morphometry
- SUMAVERG
- sum average
- TA
- texture analysis
AD is the most common type of dementia, affecting more than 25 million people around the world.1 It is a progressive neurodegenerative disorder that gradually deprives the patient of cognitive and behavioral functions. One of the main pathologic features of AD is neuronal loss with consequent brain atrophy, mainly in the medial temporal structures, though several other cerebral regions may be affected even in the early phase of the disease.2
MCI is a widely used term for cognitive problems that do not fulfill the criteria for dementia. It is generally used to refer to a transitional phase between normal cognitive function and clinically probable AD.3 Episodic memory is the most commonly affected cognitive domain, especially the capacity for retaining new information. Thus, MCI is usually classified as aMCI (single and multiple-domain) and nonamnestic (single and multiple-domain). Patients with aMCI have a higher chance of developing AD than age-matched subjects without cognitive problems/findings, and several authors support the idea of a continuum in the brain pathology of normal aging, aMCI, and AD.4
Several MR imaging methods have been applied to study mild AD and its possible prodromal states, like aMCI, aiming to identify the Alzheimer pathology in its earlier phase. These methods include region-of-interest volumetry,5 VBM,6,7 proton spectroscopy,8 and DTI,9 among others. In this work, we used the technique of TA, applied to T1-weighted MR images of the brain, to attempt to differentiate among patients with mild AD, aMCI, and control subjects matched for age and education.
In image analysis, the term “texture” can be understood as a group of image properties that relate to the intuitive notions of coarseness, rugosity, smoothness, and so forth. Many approaches have been developed for extracting texture characteristics from digital images, such as transform-based, structural-based, and statistical-based methods.10 Our study used a statistical approach,11 which extracts texture information from the image on the basis of the gray level distribution of pairs of pixels. This type of approach is very useful in medical images because it does not rely on matching primitive forms as structural approaches do, for example.12
In fact, the application of the TA technique to medical images is not new. It has been applied to a large variety of pathologies, by using many different approaches. For example, Besson et al13 used surface-based features extracted from brain T1 MR images to detect focal cortical dysplasia; Georgiadis et al14 applied co-occurrence and run-length matrices features to the characterization of different types of brain tumors. McLaren et al15 used morphologic, co-occurrence, and Laws texture parameters in MR images for breast cancer diagnosis; Rachidi et al 16 assessed osteoporosis through TA (among other tools). Theocharakis et al17 studied multiple sclerosis by using histogram, co-occurrence, and run-length matrix−based features extracted from fluid-attenuated inversion recovery MR images; Zhang et al18 applied TA based on the polar Stockwell Transform to gadolinium-enhanced T2 MR images, also for the study of multiple sclerosis.
In particular, a few studies have also applied TA to AD. Sayeed et al19 used a trace transform−based approach on brain positron-emission tomography sinograms. In Kaeriyama et al,20 the analysis of brain MR imaging was done by using the run-length matrices; in Freeborough and Fox21 and Torabi et al,22 co-occurrence matrix−based features—as in the present work—were extracted from the whole brain of patients with AD and healthy subjects; and in a more recent study, Kodama et al23 used both co-occurrence and run-length matrix parameters to differentiate among patients with AD, those with Lewy bodies, and control subjects. To the best of our knowledge, however, there have been no reported studies of the application of MR imaging TA to the study of MCI. Also, given that the texture of various brain regions and structures is different, the objective of this work was to apply the TA technique to specific brain structures in MR images (instead of to the whole brain), in an attempt to differentiate patients with AD, those with MCI, and healthy subjects.
We opted to study the thalamus and CC because they are structures with anatomic heterogeneity (especially in AD), which is a characteristic that can be considered more suitable for TA. The thalamus is a complex structure composed of several nuclei, and some of them may be atrophic (especially the limbic nuclei), while others may be anatomically normal in AD.23 The same heterogeneity occurs in the CC, where there is white matter selective damage in areas associated with cortical atrophy (the medial temporal cortex, for example), with relative sparing of areas related to motor or visual function.9 Thus in this work, we studied the level of heterogeneity of the thalamus and CC in patients with AD and aMCI compared with control subjects, and we hypothesized that TA could be a valuable tool to differentiate these clinical conditions from normal aging. Additionally, several recent studies that used volumetric and morphometric approaches have shown thalamic and callosal atrophy in AD, and some of them in MCI.6,25–28
Materials and Methods
We studied 49 subjects older than 50 years of age: 17 with aMCI, 16 with mild AD (treated at the Unit for Neuropsychology and Neurolinguistics, UNICAMP Clinic Hospital), and 16 controls. Routine laboratory examinations for dementia assessment (including B12 and folate dosage, serology for syphilis, and thyroid hormone measurement) and brain CT were performed in all patients. The research was approved by the local ethics committee, and all subjects gave their signed consent for the study.
Diagnosis of aMCI was performed by trained neurologists by using a standardized mental status battery, which includes evaluation of episodic memory, orientation, language, attention, abstract thinking, calculation, and visual perception. The diagnostic process consisted of a detailed interview with the patient and informant (usually a close relative of the patient). Diagnosis of MCI was achieved by using the following criteria of the International Working Group on Mild Cognitive Impairment3: 1) the person is neither healthy nor demented; 2) there is evidence of cognitive deterioration shown by either objectively measured decline with time and/or a subjective report of decline by self and/or informant in conjunction with objective cognitive deficits; and 3) activities of daily living are preserved, and complex instrumental functions are either intact or minimally impaired. Thus, a diagnosis of aMCI was given if the clinical history and cognitive performance pointed to an exclusive memory deficit and CDR29 score of 0.5, with an obligatory and exclusive memory score of 0.5. This classification was performed by using a semistructured interview.
For probable AD diagnosis, we used the criteria of the National Institute of Neurologic and Communicative Disorders and Stroke and Alzheimer Disease and Related Disorders Association,30 including only patients classified as CDR 1. Exclusion criteria were history of other neurologic or psychiatric diseases, head injury with loss of consciousness, use of sedative drugs in the last 24 hours before the neuropsychological assessment, drug or alcohol addiction, and prior chronic exposure to neurotoxic substances. The control group consisted of subjects with CDR 0 without previous history of neurologic or psychiatric disease or memory symptoms.
Scanning Protocol, Segmentation, and TA
High-resolution MR imaging was performed by using a 2T scanner (Elscint Prestige, Haifa, Israel). T1- and T2-weighted images were acquired in axial, coronal, and sagittal planes with 1-mm sections. TA was performed on the T1-weighted images. The segmentation of the CC and thalamus, our structures of interest, was made by using the MaZda program,31 which was used for texture-parameter calculation. This program only allows manual (mouse delineated) segmentation. However, this is acceptable because these structures are easily discernible in the images. Therefore, segmentation was based on anatomic criteria, with the assumption that texture in these structures should be approximately constant along the structure. All segmentations were checked by an expert neurologist. For the CC, we selected 9 sections from each image volume: the central section, 4 to the right, and 4 to the left in the sagittal view. The thalamus was segmented into 5 sections in the axial view. After segmentation, TA was performed for each segmented region of interest in the selected sections, also by using the MaZda program.
The statistical approach adopted here to extract texture parameters from the MR images was based on the GLCMs.10 The GLCMs are N square matrices, where N is the number of gray levels in the image. Each element (i, j) of these matrices reports how many times gray level i co-occurs with gray level j, given the distance d and the direction θ between them (usually d = 1, 2, 3, 4, or 5 pixels and θ = 0°, 45°, 90°, or 135°). From the GLCMs, many texture descriptors31 can be computed. In this work, we used the 11-parameter output of the MaZda program: angular second moment, contrast, correlation, sum of squares, inverse difference moment, sum averages, sum variances, sum entropy, entropy, difference variance, and difference entropy. Formulae for computation of these parameters can be found in the On-line Table. Our aim was to see if any of these parameters showed differences among the groups.
TA was thus achieved computing GLCMs for distances ranging from 1 to 4 pixels and default MaZda directions (θ = 0°, 45°, 90°, or 135°), totaling 16 GLCMs. From these matrices, the aforementioned texture descriptors were calculated, totaling 176 texture parameters for each region of interest.
Because the region-of-interest size for a given structure was not the same in all sections, a weighted average of the 176 texture parameters over the different sections, by using the region-of-interest size as weight, was computed, by using Matlab (MathWorks, Natick, Massachusetts). This resulted in a single set of texture parameters for each structure for each subject. Finally, an average of the parameters over the different GLCM directions was performed (giving 44 parameters per subject) because it was expected that textures should be approximately isotropic (and also, we did not want the positioning of the patient's head to interfere in the texture measurement). These parameter sets were used in the statistical analysis performed with SYSTAT, Version 10.2 (Systat Software, San Jose, California).
Initially a comparison among the 3 groups (AD, aMCI, and control) by using a Kruskal-Wallis test33 was performed. In a second stage, a pair-wise comparison (aMCI-control, aMCI-AD, and AD-control) was performed, by using the Mann-Whitney U test.33 Both analyses sought to find differences among the groups.
Finally, with the aim of providing validation for the technique, we performed a statistical analysis, also by using the Mann-Whitney U test for comparing the texture parameters obtained for the left thalamus versus the right thalamus of all control subjects. Because these were healthy subjects, we expected that there should be no statistically significant differences among the texture parameters of these structures.
Results
In Tables 1 and 2, we present the results obtained with TA for the CC and the thalamus respectively, when all 3 groups of interest (AD, aMCI, and control) were compared. In Tables 3 and 4, we show the results for pair-wise comparison (AD-control, aMCI-control, and aMCI-AD), also for the CC and the thalamus, respectively. Only pairs of groups in which we found differences are shown.
Significant texture parameters obtained for the CC in the comparison among all groups (AD, aMCI and control)a
Significant texture parameters obtained for the thalamus (left and right) in the comparison among all groups (AD, aMCI and control)a
Significant texture parameters obtained for the CC in the pair-wise comparison (AD-control and aMCI-AD)a
Significant texture parameters obtained for the thalamus in the pair-wise comparison (AD-control, aMCI-control, and aMCI-AD)a
In Table 1, our study showed differences among the 3 groups (aMCI, AD, and controls) for the CC. More specifically, 6 (of 44) parameters showed differences in the 3-group comparison for the CC. In particular, the difference variance parameter showed differences for all distances considered (P < .025), and the contrast parameter showed differences between the groups for d = 1 and d = 2 (P < .5).
In Table 2, for the thalamus, different results were found for the left and right sides. In the left side, the sum average was the unique parameter that yielded significant differences (P < .05) for all distances, giving 4/44 significant parameters. On the other hand, in the right side, we found significant differences in 13/44 parameters, namely sum of squares (for d = 1, 2, 3, 4), difference variance (d = 2, 3, 4), contrast (d = 2, 3, 4), sum variance (d = 3), and difference entropy (d = 2, 4).
In Table 3, in the pair-wise comparison for the CC, 14/44 parameters showed differences between AD and controls (contrast and difference variance gave the largest results); and 4/44, between AD and aMCI (difference variance was the most significant); but no differences were found between aMCI and controls.
In Table 4 for the thalamus, 4/44 texture parameters showed differences on the left side and 17/44 parameters showed differences on the right side between AD and controls; 14/44 parameters showed differences on the right side between aMCI and controls (but no parameters were significant for the left side); and 4/44 parameters showed differences on the left side between aMCI and AD (no parameters were significant for the right side).
With regard to the statistical comparison between left and right thalami of the control group, we did not find significant differences for any of the texture parameters studied for any of the pixel distances considered for the computation of the corresponding GLCMs. The smallest P values found were for the distance d = 3 pixels and for the parameters sum entropy (P = .39) and angular second moment (P = .38).
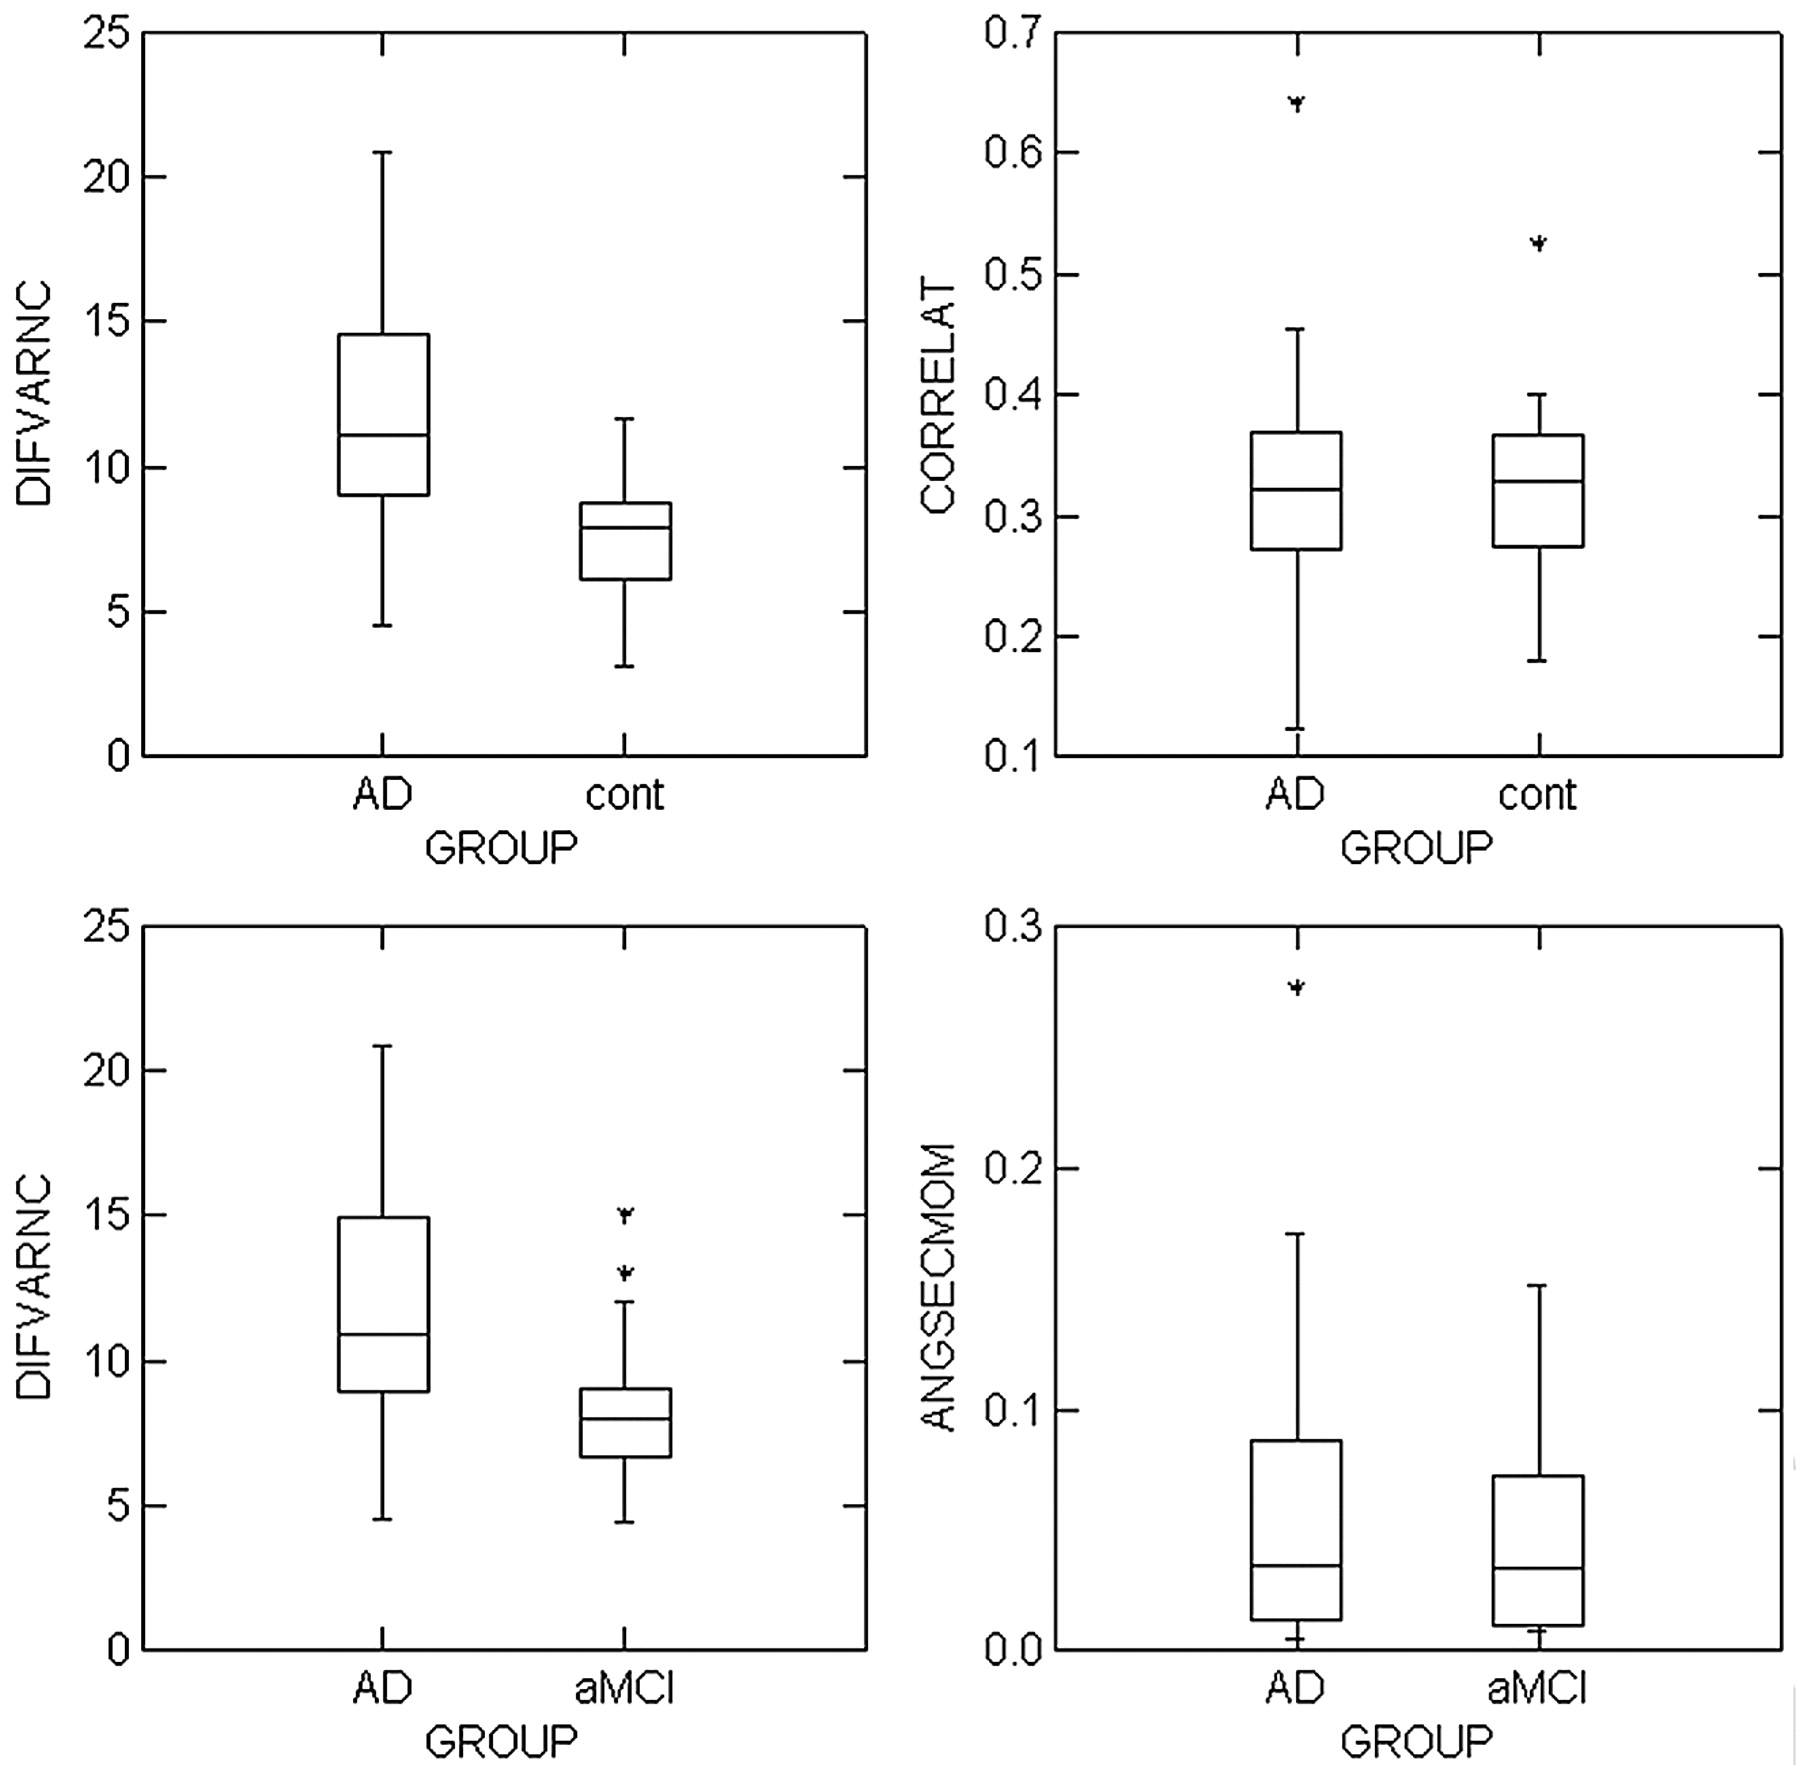
Figures 1 and 2 show boxplots, with examples of the distribution of texture parameters-versus-subject groups, for the comparison among all groups (Fig 1), and for the pair-wise comparison (Fig 2). Figure 1 shows results for the CC and the thalamus, and Fig 2 shows results only for the CC. The left column of these figures shows parameters that were well differentiated among groups, while the right column shows parameters that were not differentiated among groups. In both figures, the boxplots correspond to distance d = 1.

Boxplots for texture parameter-versus-subject groups for the CC (top row) and thalamus (bottom row), for the comparison among all the groups. X-axes show the studied groups, and y-axes show the magnitude of the texture parameter. The left column shows parameters that are differentiated well among groups, and the right column shows parameters that are not differentiated among groups. All plots correspond to distance d = 1.

Boxplots for texture parameter-versus-subject groups for the CC, for the pair-wise comparison between AD-control (top row) and AD-aMCI (bottom row). X-axes show the studied groups, and y-axes show the magnitude of the texture parameter. The left column shows parameters that are differentiated well among groups, and the right column shows parameters that are not differentiated among groups. All plots correspond to distance d = 1.
In Fig 1 (top row), the difference variance parameter showed good differentiation between the AD group and the others, for the CC. Figure 2 also shows the difference variance parameter as a good descriptor to differentiate between AD versus controls and AD versus aMCI for the CC. On the other hand, in these figures, the correlation and the angular second moment parameters almost did not show any differences among the groups.
On the other hand, Fig 1 (bottom row) shows that the sum average parameter showed good differentiation among the groups for the thalamus, while the contrast parameter did not achieve significant differentiation for this structure.
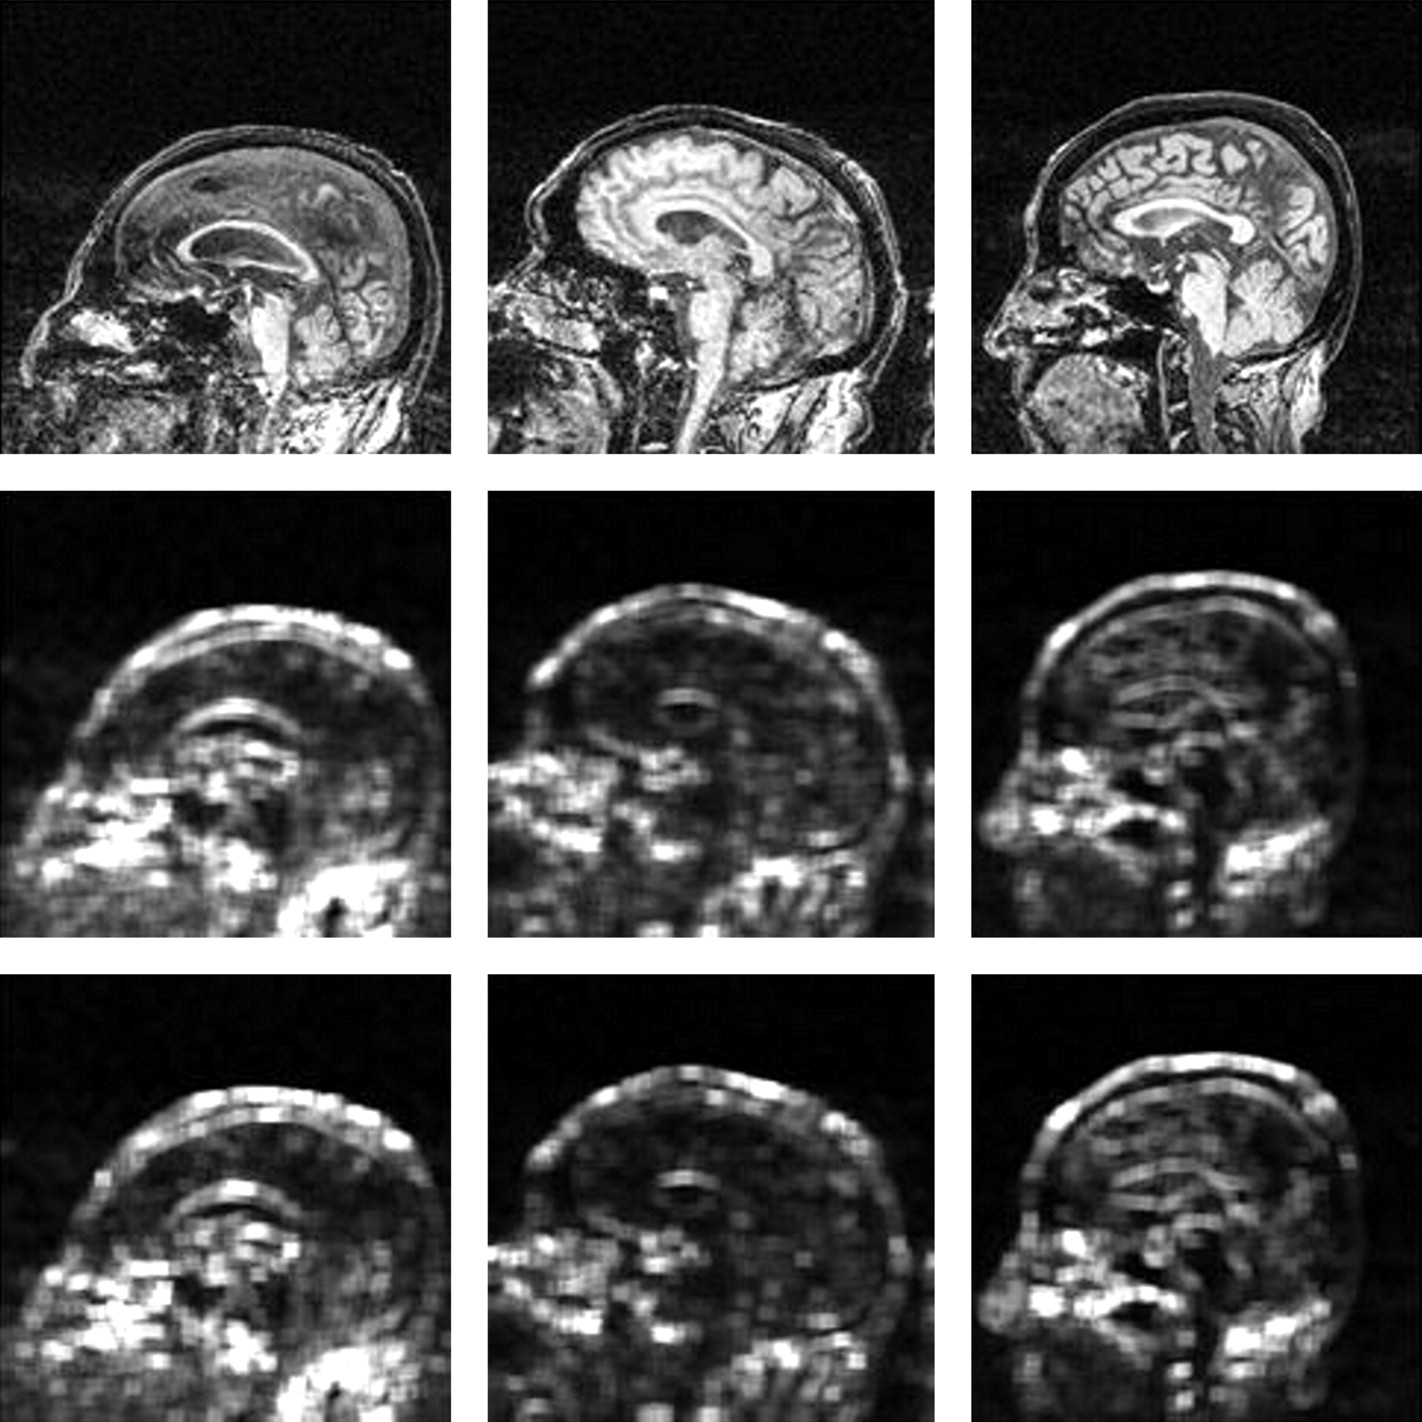
Figure 3 shows sagittal maps of the contrast and difference variance parameters computed for the whole section (instead of the region of interest) for a patient with AD (left), a patient with aMCI (middle), and a control subject (right). These maps were obtained by selecting a small neighborhood (9 × 9 pixels) around each image pixel, computing the texture parameter for that neighborhood, and then attributing the value of this parameter to the pixel. Obviously, this is different from calculating these parameters for the segmented regions of interest, which are not rectangular and are much larger (the thalamus regions of interest have approximately 120–150 pixels and the CC regions of interest have approximately 350–400 pixels, against the 81 pixels of the considered neighborhoods for the map calculations). Nevertheless, these maps give an idea of texture variation along the brain, and more important, they show that there are, indeed, texture differences among the AD, aMCI, and control individuals. The patients with AD and aMCI chosen were those who had the largest values for these texture parameters. From Fig 3, we see that both the contrast and the difference variance maps show clear differences in the CC among these individuals.

Maps of texture parameters computed by the MaZda software. Top row: MR imaging of a patient with AD (left), one with MCI (center), and a control subject (right). The middle and bottom rows show contrast and difference variance maps for these subjects respectively, computed from a GLCM with distance d = 1 pixel and direction θ = 90°. Both parameter maps show a variation in the CC gray level intensity for patients with AD and aMCI; it is brighter in the middle of this structure and darker at the sides. In patients with AD, the whole structure is brighter than that in patients with aMCI. This brightness variation does not occur for the control image. Although calculation of these maps used smaller regions than the segmented regions of interest used to compute the texture parameters shown in Tables 1⇑⇑–4 (see text), these maps give an idea of texture variation along the brain, showing that there are, indeed, texture differences among the AD, aMCI, and control individuals.
Discussion
The application of TA techniques seeks mathematic parameters that can differentiate normal and lesioned tissues. Some of these parameters have an intuitive meaning (On-line Table); however, others are more difficult to comprehend in tangible terms. Nevertheless, all of these parameters are suitable for characterizing the gray level distributions of the regions of interest, which in turn underlie physical properties regarding the imaged tissues. For the images used in this work, the physical property in question corresponds to the T1-weighted MR imaging signal intensity, which, in turn, depends on the T1 constant of the tissue and on the local proton attenuation.34
In this work, we used 11 texture parameters extracted from 4 GLCMs for each region of interest. Although more texture parameters can be extracted from a GLCM (the original article10 presenting this technique proposed 14 parameters), the TA software used here (MaZda program) computes only these 11 parameters. In the future, we intend to develop our own TA software and implement the calculation of the remaining 3 parameters.
As previously mentioned, a few other studies19–23 have already addressed AD with TA techniques; however, the approaches used have been quite different from the one used here. In the studies more similar to the present one, texture parameters were computed for the whole brain: Both Freeborough and Fox21 and Torabi et al22 used GLCMs to differentiate between patients with AD and control subjects. Kaeriyama et al20 used run-length matrices, also for patients with AD and control subjects, and Kodama et al23 used GLCMs and run-length matrices to differentiate among patients with AD, those with Lewy bodies, and controls. All these studies found texture differences between patients and controls. However, because the brain has many structures that possess different textures, we think that our method is more robust than the methods described in those studies, because instead of analyzing the texture of the brain as a homogeneous structure (which it is not), we sought to select meaningful cerebral structures (CC and thalamus) and analyze their textures separately.
The CC is the largest white matter fiber bundle in the human brain. It has been shown to be susceptible to atrophy in AD, mainly as a correlate of wallerian degeneration of commissural nerve fibers of the neocortex.25,27 It is generally assumed that there is a topographic arrangement of axons within the CC, according to their origin, that could justify its texture differences in healthy controls and patients with AD, whose callosal atrophy might be restricted just to axons proceeding from atrophic temporal structures, for example, as shown in a diffusion tensor study by Huang et al.35
In fact, our study found significant differences among the 3 groups for the CC (Table 1), in 6/44 texture parameters—namely, the contrast (for distances 1 and 2) and difference variance (for all distances) parameters. It is better to have fewer significant parameters because in an ideal situation, we would like to have a unique descriptor extracted from the images that could indicate the presence or absence of tissue alterations. In this case, it seems that the difference variance parameter would be a candidate for this role.
In addition, our study also found differences in the pair-wise comparison for the CC, but only for the AD versus controls (14/44 significant parameters) and AD versus aMCI (4/44 significant parameters). The fact that no differences were found between aMCI and controls suggests that the alterations that occur in the CC for patients with aMCI are imperceptible when compared only with controls but are enough to distinguish this group from the others in the 3-group comparison.
The differences in the CC among the groups can actually be visualized in the sample texture maps shown in Fig 3 for a patient with AD (left), one with aMCI (middle), and a control subject (right). Comparing the maps (middle and bottom rows) with the original MR images (top row), we noticed a central brighter area in the CC for the patient with AD and a lesser bright (but quite visible) area for the patients with aMCI for both parameters, which does not happen for the control, whose maps are uniform in this area. TA is thus showing differences among the 3 groups that are not noticeable in the original MR images. The texture parameter maps are based on mathematic operations performed among the pixels, and their analysis differs from the usual clinical analysis for AD. In the texture maps, bright means high values and dark means low values of the parameter, and we are looking only for differences among those (and not necessarily bright or dark values). In particular, the differentiation achieved for the patient with aMCI may help in an early risk assessment of this pathology evolving into AD.
Thalamic involvement in AD and aMCI pathology has been increasingly described in MR imaging studies, and its dysfunction may contribute to cognitive decline, particularly memory performance (the most affected cognitive domain in our patients). Moreover, Teipel et al36 hypothesized that thalamic atrophy may have some prognostic value in the conversion from aMCI to AD. The thalamus is composed of several nuclei, which can be distinguished on the basis of their cytoarchitectonic features, as well as on the basis of the patterns of connections they form with other cortical and subcortical areas.37 The nuclei in the anterior part of the thalamus interact with the medial temporal structures; they receive input from the hippocampus directly through the fornix and indirectly through the mammillary bodies. Also, anterior and dorsomedial nuclei of the thalamus project back to the hippocampus through the cingulum. Damage to these thalamic nuclei causes both anterograde and retrograde episodic memory deficits38 and may have contributed to the poor memory performance of our patients.
As previously mentioned, the 3-group comparison for the thalamus gave different results for the left and right sides (Table 2); 4/44 parameters were significant for the left side, and 13/44 parameters were significant for the right side. The number of significant texture parameters for the left and right sides of the thalamus was also quite different in the pair-wise comparisons (Table 4). Many more parameters were found significant for the right side than for the left side, for both the comparison between AD and controls and aMCI and controls. On the other hand, for the comparison between aMCI and AD, a few parameters on the left side were significant. On the whole, we noticed an asymmetry between the results found for the left and right sides for the comparison between patients (both AD and aMCI) and controls; it seems that the right alterations are more apparent. On the other hand, the statistical comparison performed with the thalami of control subjects did not detect any asymmetry between the left and right sides, suggesting that the asymmetry found in patients could be arising from the pathologies in question. In a longitudinal VBM study, Baron et al5 also found significant asymmetric right thalamic atrophy during the 18-month follow-up period common to both MCI converters and nonconverters to AD.
For the thalamus, TA found differences in the pair-wise comparison between aMCI and controls, which did not happen for the CC.
Thus, thalamic TA results concur with those previously quoted structural neuroimaging studies. These results proved the technique to be effective in distinguishing AD and aMCI from normal aging.
Because in this work we have analyzed multiple parameters (actually 44), it is statistically expected that some of them could be significant due to random errors. The significance level of 5% used in this work amounts to expecting that 44 × 0.05 or 2 parameters could possibly result in false-positives. However, in our analyses, there were always >2 significant texture parameters, which is an indication that some texture difference indeed exists.
At this point, the whole analysis takes a long time (approximately 3 days per subject), particularly due to the manual segmentation of the brain structures, which is the bottleneck of the process. Tools for semiautomatic (user-guided) segmentation of brain structures are already available, which would considerably speed up the analysis. However, the TA software in this work (MaZda) uses an unknown format for the segmented images, which makes segmentation outside this software impractical. Future extensions of this work include developing software for calculating texture parameters, to be used in conjunction with the semiautomatic segmentation tools mentioned.
To use TA in daily clinical practice, more data, from both patients and controls, need to be collected and analyzed, to build a texture model. Then, given a new patient with a suitable clinical evaluation, MR imaging would be performed, followed by segmentation of the structures of interest and then TA of these structures. These results would be compared with the model to help in the diagnosis/prognosis of the disease.
Conclusions
This study presented results of the application of the technique of TA to cerebral MR images of patients with AD and aMCI and of normal-aging subjects, with the aim of evaluating whether the technique can differentiate among those groups. The texture parameters showed differences among the 3 groups for the CC and thalamus as well as between AD and control and AD and aMCI subjects for the CC; and also among AD and control, AD and aMCI, and aMCI and control subjects for the thalamus. This finding suggests that the technique is useful for the detection of regions affected by these kinds of anomalies. Because standard visual analysis of this type of image is generally unable to detect these differences, TA has the potential to become a helpful tool in the diagnosis and understanding of these pathologies. A future extension of this work would be to automate TA of the involved anatomic regions, to make this analysis a fast and easy-to-use tool for neurologists.
Footnotes
-
Indicates article with supplemental on-line tables.
References
- Received February 23, 2010.
- Accepted after revision May 29, 2010.
- Copyright © American Society of Neuroradiology
In this issue


Jump to section
Related Articles
Cited By...
- Mixed Models Quantify Annual Volume Change; Linear Regression Determines Thalamic Volume as the Best Subcortical Structure Volume Predictor in Alzheimers Disease and Aging
- Diencephalic or hippocampal amnesia - different etiologies, common mechanisms
- Magnetic resonance imaging texture predicts progression to dementia due to Alzheimer disease earlier than hippocampal volume