AJDRAJNR - American Journal of Neuroradiology

This Article
Right arrow Abstract Freely available
Right arrow Full Text
Right arrow Full Text (PDF)
Right arrow Alert me when this article is cited
Right arrow Alert me if a correction is posted
Right arrow Citation Map
Services
Right arrow Similar articles in this journal
Right arrow Similar articles in PubMed
Right arrow Alert me to new issues of the journal
Right arrow Download to citation manager
Right arrow reprints & permissions
Citing Articles
Right arrow Citing Articles via HighWire
Right arrow Citing Articles via CrossRef
Right arrow Citing Articles via Google Scholar
Google Scholar
Right arrow Articles by Flemming, K.
Right arrow Articles by Jansen, O.
Right arrow Search for Related Content
PubMed
Right arrow PubMed Citation
Right arrow Articles by Flemming, K.
Right arrow Articles by Jansen, O.

MR Spectroscopic Findings in a Case of Alpers-Huttenlocher Syndrome

Katharina Flemminga, Stefan Ulmera, Barbara Duisbergb, Andreas Hahnb and Olav Jansena

a Section of Neuroradiology, Clinic of Neurosurgery, Christian-Albrechts-Universität Kiel, Kiel, Germany
b Clinic of Neuropediatrics, Christian-Albrechts-Universität Kiel, Kiel, Germany


View larger version (152K):

[in a new window]
 
FIG 1. Diffusion-weighted (5100/137 [TR/TE]; acquisition time, 20 s; number of acquisitions, one) images show cytotoxic edema in the right frontal and left parieto-occipital cortices as an expression of an acute phase of encephalopathy. Proton spectra were acquired from the right frontal cortex (A) and from the normal-appearing right parietal cortex (B).
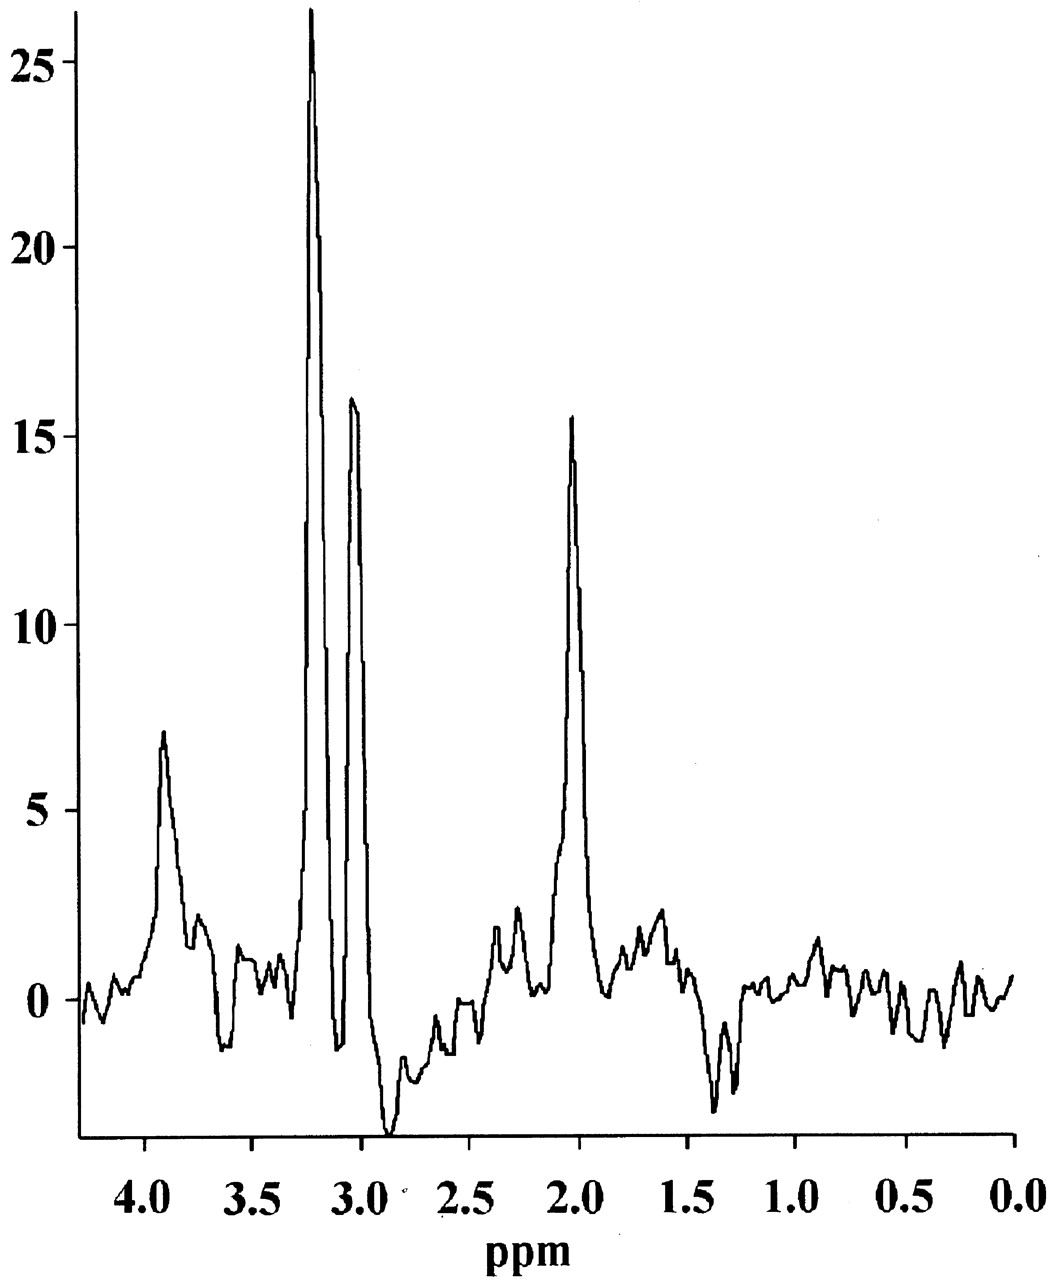


View larger version (19K):

[in a new window]
 
FIG 2. Spectrum (1500/135; acquisition time, 6 minutes 31 seconds; number of acquisitions, 256; voxel size, 8 mL) acquired from voxel A of the diffusion-weighted image (Fig 1) (abnormal right frontal cortex), reveals a distinct lactate peak and a reduced NAA/Cr ratio.
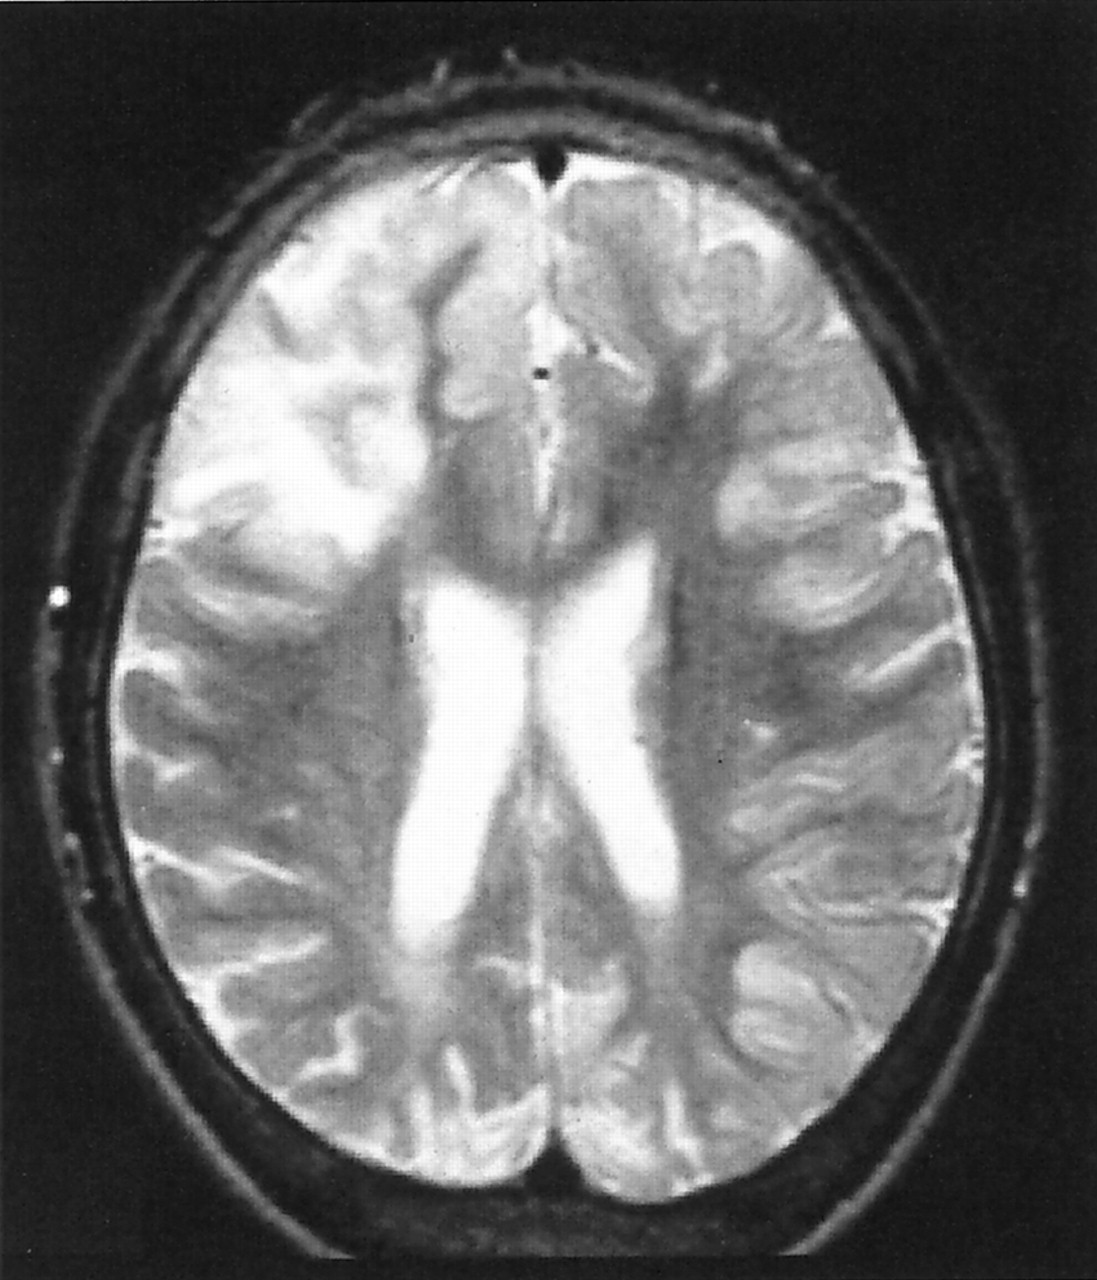


View larger version (21K):

[in a new window]
 
FIG 3. Spectrum (same parameters as those in Fig 2) acquired from voxel B of the diffusion-weighted image (Fig 1) (normal-appearing right parietal cortex, which also appeared normal on T2-weighted MR images), displays no lactate but a reduced NAA/Cr ratio, although not as distinctly as for voxel A.


View larger version (149K):

[in a new window]
 
FIG 4. T2-weighted (3000/120; acquisition time, 7 minutes 16 seconds; number of acquisitions, one) MR image shows cortical thickening and edema in the right frontal and left parieto-occipital cortices. The right parietal cortex appears normal in the T2-weighted images.