
- Fig 1.
Clinical-imaging correlation plotting the patient’s serum sodium concentration, imaging studies, and quantitative ADC measurements. “Hospital days” are counted from the day the patient presented at the outside hospital with hyponatremic encephalopathy. The patient was transferred to a tertiary care center on day 11. MR image was obtained on day 12 (day following hospital transfer) and showed restricted diffusion within the central pons and no signal abnormality on the remaining conventional MR images.
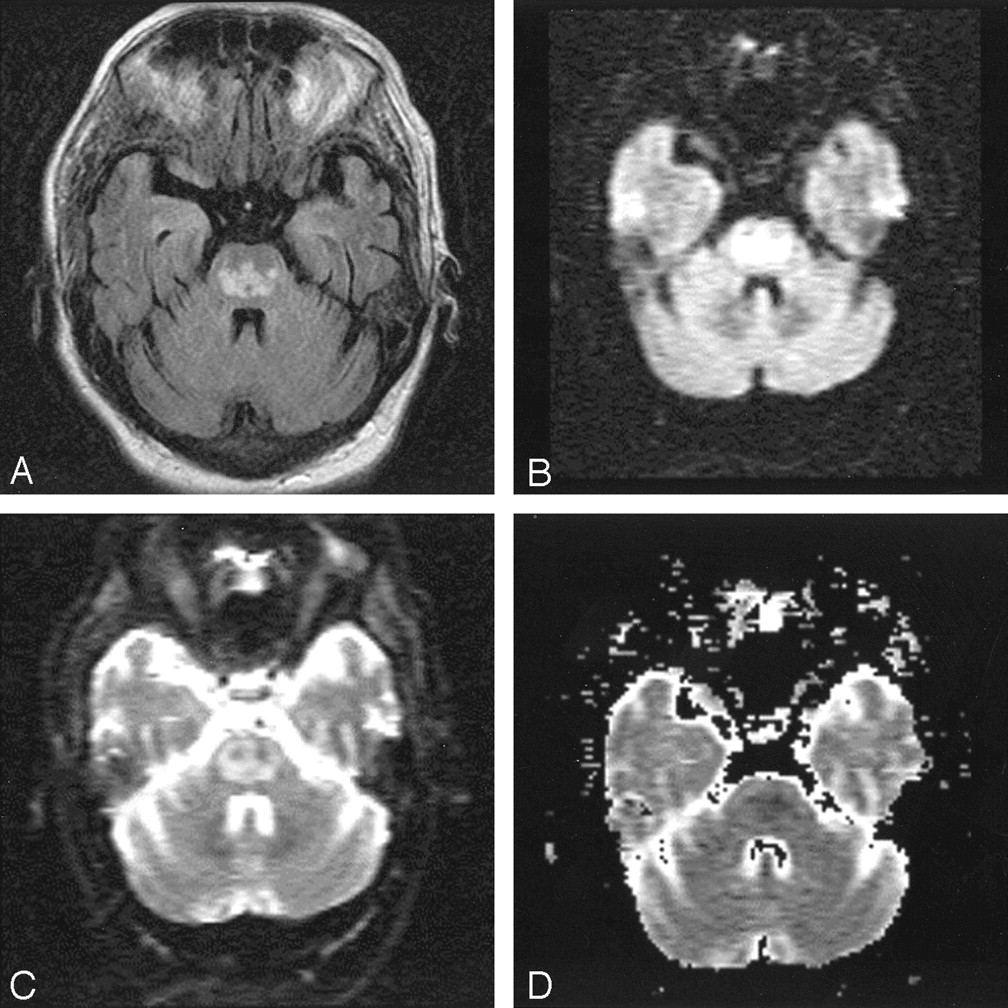
- Fig 2.
MR image of the patient’s head obtained on hospital day 12, 1 day after maximum hypernatremia, and within 24 hours of onset of tetraplegia.
A, FLAIR image (TR, 11,002; TE, 140; NEX, 1) is normal, as were proton density–and T2-weighted spin-echo images (not shown).
B, An abnormally hyperintense finding is present within the central pons on the isotropic DWI obtained with a b value of 1000.
C, There little change noted on the echo planar image obtained at b = 0.
D, The ADC map shows that hyperintensity at DWI does indeed represent restricted diffusion. (See Figure 1 for quantitative ADC results.)
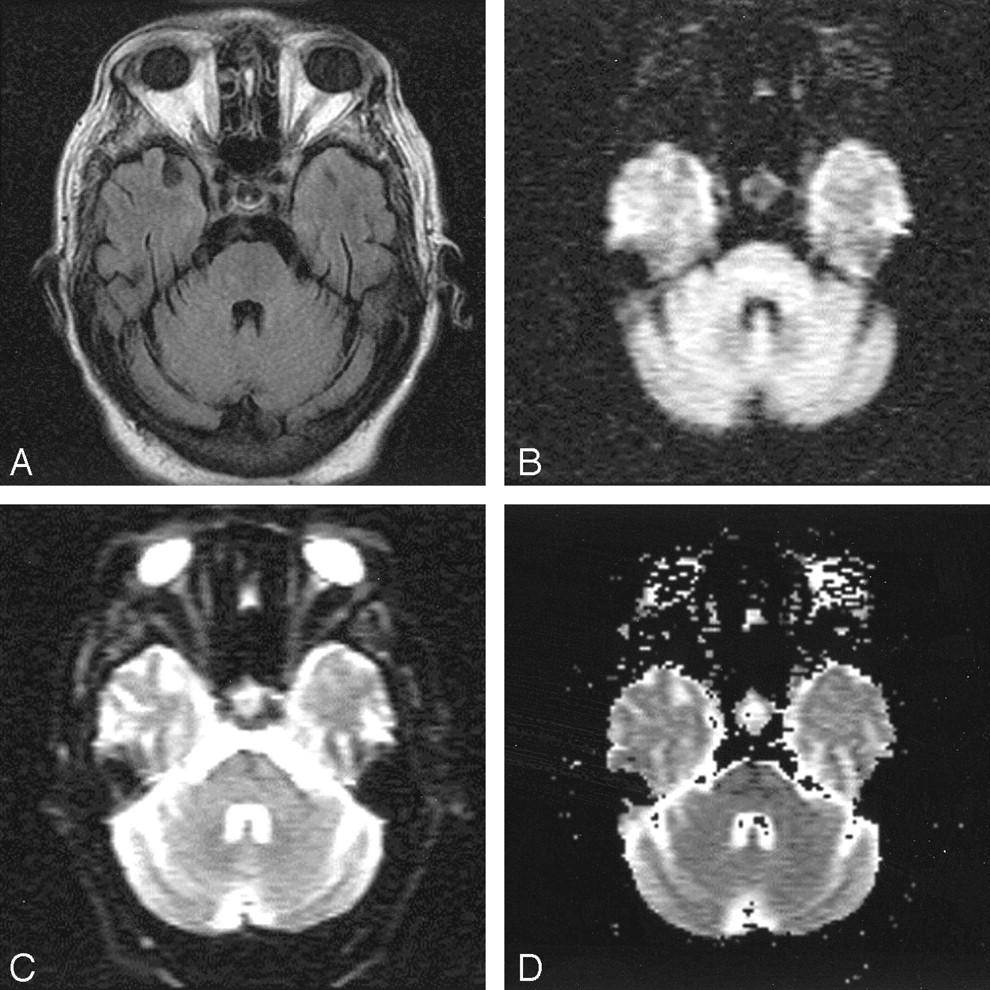
- Fig 3.
MR images of the patient’s head, obtained on hospital day 17, 3 days after renormalization of overcorrected hypernatremia.
A, FLAIR image now demonstrates the classic trident-shaped pontine signal intensity abnormality.
B, The extent of DWI signal intensity abnormality in the pons has also become more extensive, assuming a trident-shape.
C, The b = 0 image has also become abnormal in the interim.
D, The ADC map again shows that the high DWI signal intensity corresponds to restricted diffusion (see Figure 1).


- Copyright © American Society of Neuroradiology
In this issue


Jump to section
Related Articles
Cited By...
- Potentially Reversible and Recognizable Acute Encephalopathic Syndromes: Disease Categorization and MRI Appearances
- Treatment response in osmotic demyelination syndrome presenting as severe parkinsonism, ptosis and gaze palsy
- Response to IV immunoglobulin in a case of osmotic demyelination syndrome
- What to see when you are looking at confusion: a review of the neuroimaging of acute encephalopathy
- "Dazed and diffused": making sense of diffusion abnormalities in neurologic pathologies
- An unusual case of quadriparesis
- Isolated extra pontine myelinolysis presenting as acute onset parkinsonism
- Imaging evaluation of demyelinating processes of the central nervous system
- A trident in the brain, central pontine myelinolysis
- Central pontine myelinolysis in a case of cerebral malaria