
Abstract
Summary: Alpers-Huttenlocher syndrome, considered a mitochondrial disease, combines encephalopathy and liver failure. An 11-year-old boy with Alpers-Huttenlocher syndrome underwent conventional MR imaging, diffusion-weighted imaging, and proton MR spectroscopy. Diffusion-weighted imaging showed cytotoxic edema interpreted as acute-phase encephalopathy. MR spectroscopy revealed a lactate peak in the cortex that appeared abnormal on diffusion-weighted images, possibly representing respiratory deficiency with anaerobic metabolism. MR spectroscopy proved to be more sensitive regarding lactate detection than did neurometabolic examination of serum and CSF. A reduced N-acetylaspartate-creatine ratio was detected in both the cortex that appeared abnormal and the cortex that appeared normal on the diffusion-weighted images, indicating neuronal damage that was widespread, even beyond the boundaries of conventional MR imaging changes.
Progressive neuronal degeneration of childhood with liver disease (Alpers-Huttenlocher syndrome [AHS]) is a recessively inherited syndrome (1) that combines encephalopathy and liver failure and is now considered a mitochondrial disease in most cases (1–3). Enzyme activity deficiencies of the respiratory chain (eg, cytochrome-C oxidase deficiency) have been identified in muscle mitochondria (1, 2, 4), and morphologic abnormalities of mitochondria were shown in liver tissue (1). The typical clinical course of AHS is fatal, with intractable seizures, neurologic deterioration, and liver failure subsequent to a period of developmental delay during early infancy (5). In some cases, acute hepatic failure and progressive neurologic symptoms are associated with valproic acid medication (1, 2, 6). Cerebral changes in AHS include cortical atrophy with neuronal loss, spongiosis, and astrocytosis and a predilection for the visual cortex (5) that results in cortical blindness (4, 6). However, MR imaging abnormalities have also been found in the basal ganglia and thalamus (4).
Proton MR spectroscopy has been frequently used to noninvasively assess cerebral metabolic changes. MR spectroscopy delivers a frequency spectrum of metabolites reflecting physiologic changes that can be correlated to conventional MR imaging, yielding anatomic information. Two metabolites in particular are of interest in this case: lactate as an indicator of a switch from oxidative to anaerobic metabolism (7) and N-acetylaspartate (NAA) as a marker for neuronal viability (8, 9).
In a case of AHS, Worle et al (4) showed elevated lactate in the CSF. We performed MR spectroscopy in a patient with clinically diagnosed AHS to show a lactate signal intensity and a reduction of the NAA signal intensity in the affected cortex, as shown by diffusion-weighted imaging.
Case Report
We report on a case of an 11-year-old boy in whom mental and motor developmental delay had been identified when he was 4 years old. At the age of 7 years, strabismus convergens occurred, at which time a detailed neurologic examination and cranial MR imaging revealed no abnormalities. After a squint operation, the patient developed headache and nausea and then presented with a generalized tonic-clonic seizure. Subsequently, myoclonia appeared, and recurrent focal motor seizures evolved into epilepsia partialis continua. An otherwise intractable focal motor status prompted the application of valproate. One week later, life-threatening hepatopathy led to valproate discontinuation, and AHS was diagnosed. An extensive neurometabolic workup, including lactate determination in serum and CSF and muscle biopsy, disclosed no abnormalities. During the first 4 months of his illness, the boy became blind and incontinent and lost his ability to walk freely. During the ensuing years, a further slight loss of mental and motor capabilities and several episodes of status epilepticus occurred. The boy was hospitalized because of epilepsia partialis continua, affecting the right hand, arm, and face, triggered by an upper airway infection.
Imaging Technique and MR Spectroscopy Findings
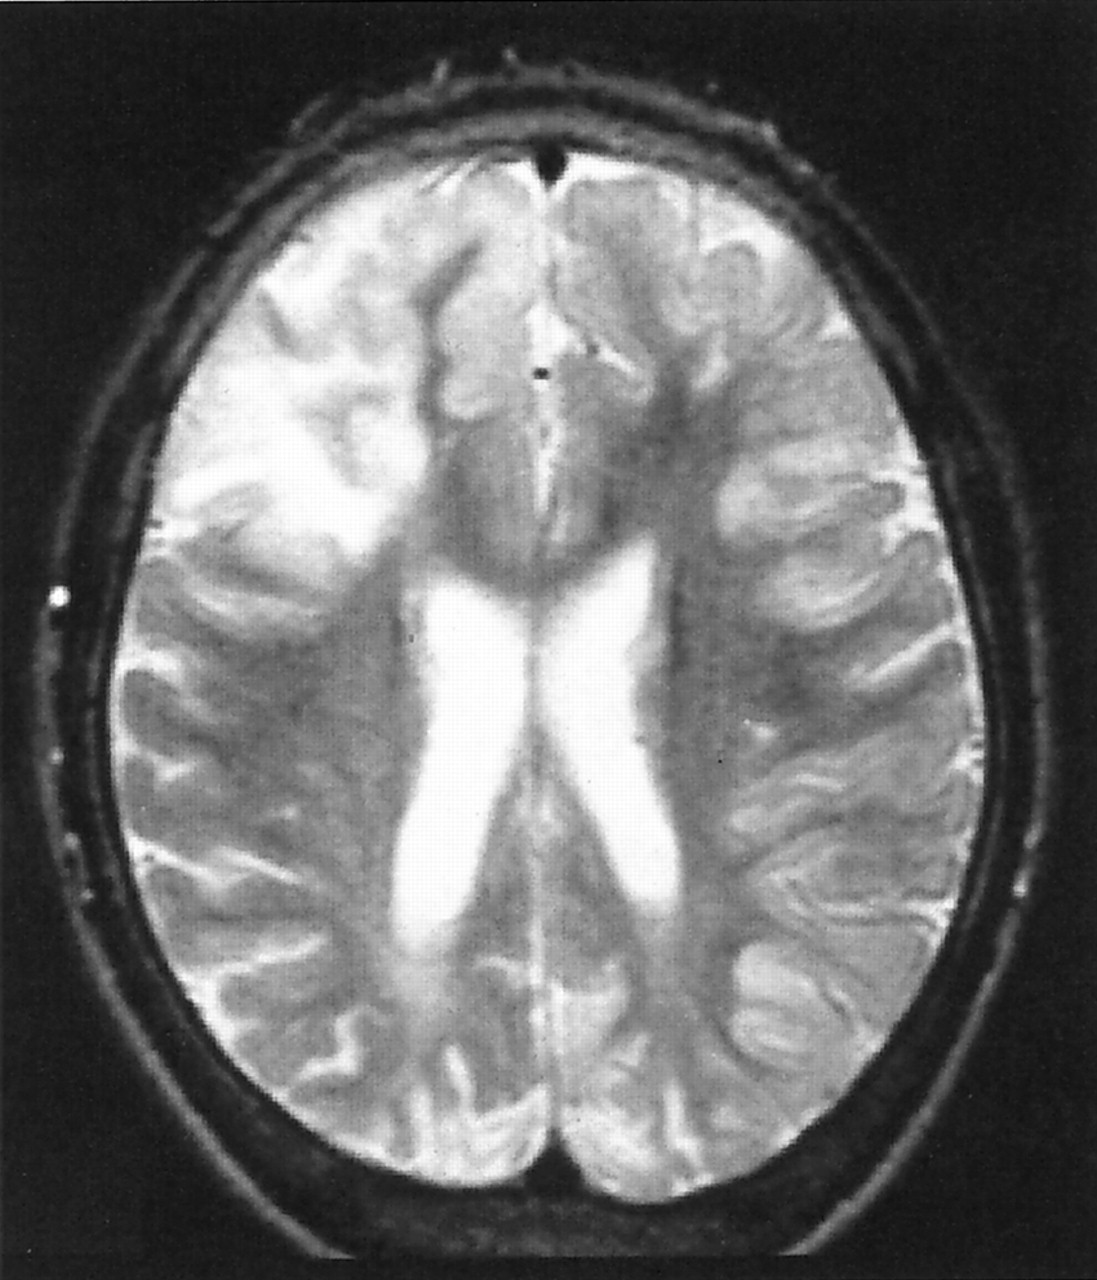
Conventional MR imaging, diffusion-weighted imaging, and proton MR spectroscopy were performed by using a 1.5-T echo-planar imaging-equipped whole-body imager. Conventional MR imaging revealed a bilateral occipital cortical atrophy, consistent with the AHS predilection. Diffusion-weighted imaging showed cytotoxic edema in the right frontal and left parieto-occipital cortices (Fig 1) and bilaterally in the basal ganglia. For proton single-voxel MR spectroscopy, one voxel was placed in the right frontal cortex that appeared abnormal on diffusion-weighted images, and the spectrum obtained was compared with another one resulting from a voxel positioned in the normal-appearing right parietal cortex.

Diffusion-weighted (5100/137 [TR/TE]; acquisition time, 20 s; number of acquisitions, one) images show cytotoxic edema in the right frontal and left parieto-occipital cortices as an expression of an acute phase of encephalopathy. Proton spectra were acquired from the right frontal cortex (A) and from the normal-appearing right parietal cortex (B).
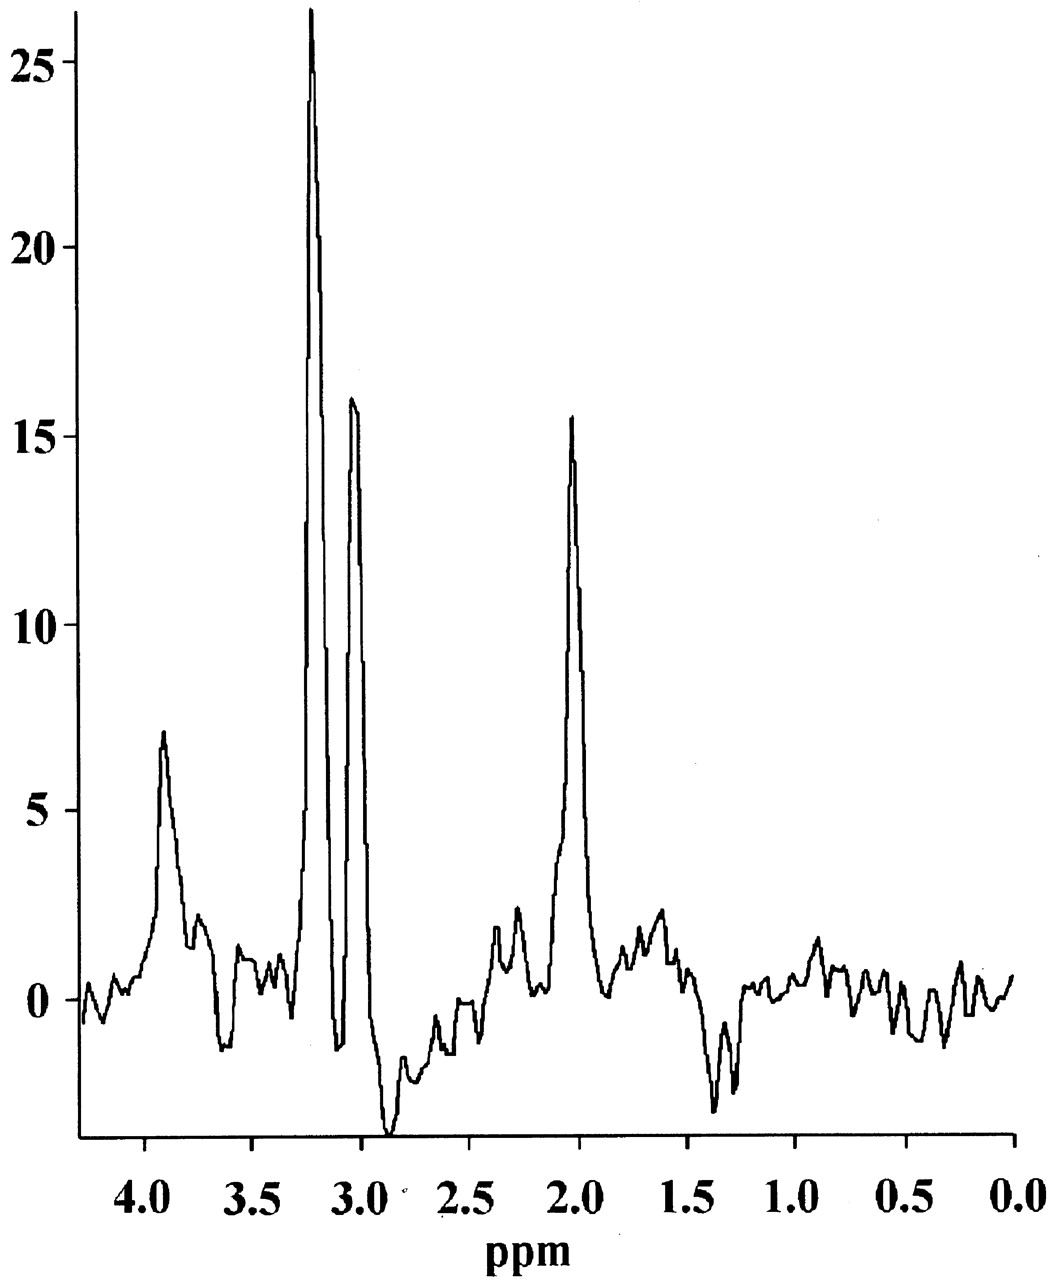
On the diffusion-weighted images, an abnormal-appearing right frontal cortex revealed a distinct lactate peak at 1.3 ppm and a reduced NAA-creatine (Cr) ratio of 1.18 (our normal standard, NAA/Cr = 2.2 ± 0.4) (Fig 2). The spectrum acquired from the right parietal cortex (Fig 3), which appeared normal on T2-weighted (Fig 4) and diffusion-weighted (Fig 1) images, displayed no lactate, whereas the NAA/Cr was 1.35 and was therefore reduced, although not as distinctly as in the area on abnormal diffusion-weighted images.

Spectrum (1500/135; acquisition time, 6 minutes 31 seconds; number of acquisitions, 256; voxel size, 8 mL) acquired from voxel A of the diffusion-weighted image (Fig 1) (abnormal right frontal cortex), reveals a distinct lactate peak and a reduced NAA/Cr ratio.


T2-weighted (3000/120; acquisition time, 7 minutes 16 seconds; number of acquisitions, one) MR image shows cortical thickening and edema in the right frontal and left parieto-occipital cortices. The right parietal cortex appears normal in the T2-weighted images.
Discussion
MR imaging in patients with chronic hepatic encephalopathy shows symmetric hyperintensities in globus pallidus and other basal ganglia structures on T1-weighted images (10). This pattern even anticipates hepatocerebral disease, increases after portosystemic shunt implantation, and decreases after successful liver transplantation (10). The basal ganglia hyperintensities reflect the severity and duration of liver disease and are probably caused by manganese (11). However, these MR imaging abnormalities do not correlate with the severity of acute hepatic encephalopathy (12).
In contrast to chronic hepatic encephalopathy, there are no specific cerebral MR imaging findings for patients with acute liver failure. To our knowledge, there are no reports concerning diffusion-weighted imaging abnormalities for patients with acute liver failure. Animal experiments have shown that the brain lactate level measured by MR spectroscopy rises during fulminant hepatic failure (13).
Although there are no reports about specific imaging findings for patients with acute hepatic encephalopathy, reversible cytotoxic edema detected by diffusion-weighted imaging has been shown in a patient with mitochondrial myopathy, encephalopathy, lactic acidosis, and strokelike episodes syndrome (MELAS) during recurrent status epilepticus (14). In another case of MELAS, a persistent increase of the lactate signal intensity measured by MR spectroscopy has paralleled the continuous production of lactate in cells with respiratory deficiency (15). In five patients with mitochondrial disease, three with Leighs disease and two with MELAS, a distinct lactate peak that is largest at the areas of acute or subacute processes has been shown. These areas generally have shown T2 prolongation at conventional imaging (16).
In our case, it has to be discussed whether the MR findings reflect the cerebral manifestation of liver failure or cerebral abnormalities directly caused by the underlying mitochondrial disorder. Our patient had clinically diagnosed AHS. The only chronic findings on conventional MR images are bilateral occipital cortical atrophy, consistent with AHS predilection. None of the MR imaging findings described for patients with chronic hepatic encephalopathy could be shown in our case. However, the disseminated hyperintense abnormalities on diffusion-weighted images of the right frontal and left parieto-occipital cortices (Fig 1) and bilaterally of the basal ganglia showed similarities to findings for patients with other mitochondrial disorders. We interpret these findings as an expression of the acute phase of encephalopathy, with cytotoxic edema and acute cellular damage induced by an acute deficit in the respiratory chain in a patient with an underlying mitochondrial disease. Exactly in this area of abnormal-appearing cortex on diffusion-weighted images, a distinct lactate peak is found in the proton spectrum. In normal human brain, lactate is below MR spectroscopic detectability. Any detectable increase in lactate is therefore considered abnormal (17). The lactate peak in our case possibly represents respiratory deficiency with anaerobic metabolism in the area affected most in diffusion-weighted imaging, consistent with findings in a case of MELAS (15).
Conclusion
In our case, MR spectroscopy proved to be more sensitive regarding lactate detection than did neurometabolic examination of serum and CSF. Neuronal loss, reflected by a reduced NAA/Cr ratio, is observed not only in the abnormal but also in the normal-appearing cortex, indicating that neuronal damage is widespread, even over the boundaries of conventional MR imaging changes.
References
- Received August 20, 2001.
- Accepted after revision April 12, 2002.
- Copyright © American Society of Neuroradiology


