
Abstract
BACKGROUND AND PURPOSE: Cerebral hemodynamics abnormality in Alzheimer disease (AD) is not fully understood. Our aim was to determine whether regional hypoperfusion due to AD is associated with abnormalities in regional arterial blood volume (rABV) and regional arterial transit time (rATT) as measured by quantitative arterial spin-labeling (ASL) with multiple-delay time sampling.
MATERIALS AND METHODS: Nineteen patients with AD (9 men and 10 women; mean age, 74.5 ± 8.6 years) and 22 cognitively healthy control subjects (11 men and 11 women; mean age, 72.8 ± 6.8 years) were studied by using a quantitative ASL method with multiple-delay time sampling. From the ASL data, maps of regional cerebral blood flow (rCBF), rABV, and rATT were generated. A region of hypoperfusion due to AD was determined by statistical parametric mapping (SPM) analysis. Mean rCBF, rABV, and rATT values within the hypoperfused region were compared between the AD and control groups.
RESULTS: Despite the significantly lower rCBF (P = .0004) in patients with AD (27.8 ± 7.1 mL/100 g/min) in comparison with control subjects (36.7 ± 6.3 mL/100 g/min), no significant difference in rATT was observed between the control (0.48 ± 0.09 seconds) and AD (0.47 ± 0.10 seconds) groups. Mean rABV was lower in the AD group (0.22 ± 0.10%) than in the control group (0.27 ± 0.12%), though the difference did not reach the level of statistical significance.
CONCLUSIONS: Our results revealed that regional hypoperfusion in AD is not associated with rATT prolongation, suggesting that the mechanism of hypoperfusion is distinct from that in cerebrovascular diseases.
Alzheimer disease (AD) is associated with regional decreases of cerebral blood flow (CBF). Typical sites of hypoperfusion include cortical regions over the posterior cingulate gyrus and precunei and the temporoparietal association cortices.1,2 Such hypoperfusion is most commonly evaluated by using single-photon emission CT (SPECT) and has been used to discriminate individuals affected by AD from healthy individuals.3 The pathophysiologic mechanism of the hypoperfusion is assumed to be either degeneration of local neural tissue or a “remote effect” from the neurodegeneration in a distant brain region that has a strong functional connection with the hypoperfused region4 and is considered to be distinct from hemodynamic impairment due to lowered perfusion pressure, which is seen in ischemic cerebrovascular diseases. To date, there has been only a limited number of imaging studies on cerebral hemodynamics in AD. One of these studies used positron-emission tomography (PET) and showed that hypoperfusion in AD is not associated with prolongation of vascular transit time (or mean transit time [MTT]) or depression of vascular reserve (VR).5 These findings not only provide insight into the pathophysiology of AD but may also be useful in distinguishing AD from vascular dementia (VD), which is another major cause of dementia.
Arterial spin-labeling (ASL) is an MR imaging method that allows noninvasive measurement of regional cerebral perfusion.6 It uses arterial blood as an intrinsic tracer and therefore needs no radioactive tracer or contrast agent. ASL has been previously used to measure regional CBF (rCBF) in AD.7,8 However, ASL has never been used to measure other hemodynamic parameters in patients with AD because most conventional pulsed ASL techniques acquire labeled images only at a single postlabeling time point. Recently, ASL pulse sequences with multiple-delay time sampling became available on clinical 3T MR imagers, allowing measurement of other hemodynamic parameters such as arterial blood volume (ABV) and arterial transit time (ATT). ABV represents the volume fraction of the arterial lumen in a given voxel, whereas ATT represents the duration of the labeled blood flowing from the labeling region to the vascular compartment of imaging sections. ATT is different from MTT, which is calculated by dividing the cerebral blood volume by CBF measured by PET. MTT is a physiologic parameter that represents the average time it takes for blood to traverse from the arterial to the venous side of the cerebral vasculature. Unlike MTT, ATT is not a physiologic parameter, but it is known to be correlated with MTT.9 We hypothesized that regional hypoperfusion in AD is not associated with ATT prolongation, whereas it can be associated with decreased ABV. To determine whether regional hypoperfusion due to AD is associated with abnormalities in these hemodynamic parameters, we used a quantitative ASL technique with multiple-delay time sampling.
Materials and Methods
Subjects
This study was approved by the local institutional review board, and informed consent was obtained from each healthy subject. Acquisition of consent was waived for the retrospective use of MR images and clinical data of patients with AD.
MR imaging data of 19 patients with clinically diagnosed AD (9 men and 10 women; age range, 55–89 years; mean age, 74.5 ± 8.6 years) were retrospectively analyzed. All patients received the Japanese version of the Mini-Mental State Examination (MMSE),10 and their scores ranged from 11 to 24 points (mean, 20.1 ± 4.3 points). Twenty-two healthy individuals (11 men and 11 women; age range, 50–81 years; mean age, 72.8 ± 6.8 years) were recruited from the general population as control subjects. Individuals with any history of hypertension, diabetes mellitus, cardiovascular diseases, stroke, brain tumor, epilepsy, Parkinson disease, dementia, depression, drug abuse, or head trauma were excluded. Their MMSE scores ranged from 27 to 30 (mean, 29.4 ± 0.9).
MR Imaging
MR images were obtained by using a 3T MR imaging unit (Achieva Quasar Dual; Philips Medical Systems, Best, the Netherlands) and an 8-channel head array receiving coil for sensitivity encoding (SENSE) parallel imaging.
ASL was performed by using quantitative signal-intensity targeting by alternating radio-frequency pulse labeling of arterial regions (QUASAR), which is a pulsed ASL method developed by Petersen et al.11 Details of the sequence and the calculation method for the perfusion parameters have been described elsewhere,11 but we will provide a brief summary here: QUASAR is characterized by multiple-delay time sampling based on the Look-Locker technique,12 which enables observation of the postlabeling time course of perfusion-related signals in each imaging voxel. Our protocol consisted of 42 pairs of labeled and nonlabeled image acquisitions, of which 24 pairs were acquired with crusher gradients (velocity encoding = 4 cm/s) and 12 pairs were acquired without crushers. These 36 pairs were acquired at a flip angle of 35°. The other 6 pairs were acquired at a lower flip angle (11.7°) without crushers to estimate the actual flip angle, which might vary across the brain due to the inhomogeneity of B1. The actual imaging parameters were as follows: labeling slab thickness, 150 mm; gap between the labeling and imaging slabs, 15 mm; SENSE factor, 2.5; TR, 4000 ms; TE, 22 ms; sampling interval, 300 ms; sampling time points, 13; FOV, 230 mm; matrix size, 64 × 64; imaging time, 5 minutes 52 seconds. Seven 6-mm-thick transverse sections (gap, 2 mm) covered a 54-mm-thick imaging volume above a plane including anterior and posterior commissures.
In addition to ASL, high-resolution 3D T1-weighted images of the whole brain were obtained by using the magnetization-prepared rapid acquisition of gradient echo sequence: TR, 8.3 ms; TE, 3.8 ms; TI, 240 ms; FA, 8°; SENSE factor, 2; number of signal average, 1; FOV, 240 mm; matrix size, 240 × 240; section thickness, 1 mm; imaging time, 5 minutes 20 seconds. The images were obtained in sagittal planes and were reconstructed into 1-mm-thick consecutive transverse images.
Image Analysis
MR imaging data were analyzed on a Windows computer (Microsoft, Redmond, Wash). Maps of rCBF, regional ABV (rABV), and regional ATT (rATT) were obtained by using dedicated software running on IDL (Research Systems, Boulder, Colo), which was developed and provided by Petersen et al (National Neuroscience Institute, Singapore).11 Perfusion-related signals were obtained by subtracting labeled data from nonlabeled data. Absolute rCBF was calculated through deconvolution of the perfusion-related signal intensity in each voxel by the local arterial input function (AIF). AIF was obtained by subtracting the crushed data from noncrushed data. The following constants were used in the CBF calculation: T1 of arterial blood, 1.65 seconds; inversion efficiency, 95%; blood-brain partition coefficients for gray and white matter, 0.98 and 0.82, respectively. rABV was calculated as the ratio of the area of the local AIF to the area of blood-filled voxel.11 rATT was measured by detecting the onset of the perfusion-related tissue-signal-intensity rise in each voxel by using the edge-detection algorithm proposed by Canny.13
Areas of hypoperfusion due to AD were determined by statistical parametric mapping (SPM) analysis on SPM2 software (Wellcome Trust Center for Neuroimaging, London, UK). The rCBF map of each subject was coregistered to the corresponding high-resolution T1-weighted image. First, raw ASL images before subtraction, which were in exactly the same position as the corresponding rCBF maps and had more anatomic details than the rCBF maps themselves, were coregistered to the T1-weighted images, and the transformation matrix was obtained. The same transformation matrix was applied for coregistration of the rCBF map. The coregistered rCBF maps were then spatially normalized by using the T1 template provided with the SPM2 software (ICBM-152). The spatially normalized rCBF maps were smoothed by using an isotropic gaussian kernel with 12-mm full width at half maximum to reduce the noise and residual anatomic difference among the brains. For the statistical comparison of the rCBF maps, mask images were created. This was done to limit the spatial extent of the voxelwise comparison with the voxels within the brain parenchyma, excluding the voxels within ventricles and cerebral fissures.
The mask images were generated in the following steps: First, a map of the longitudinal relaxivity (R1) of each subject was generated from the ASL data. The R1 maps of all subjects were coregistered to the corresponding high-resolution T1-weighted image and then spatially normalized following the same steps as those used for the rCBF maps. In the normalized R1 map of each subject, brain region was segmented by thresholding the map at an arbitrary R1 value (0.35/s). Finally, binary mask images were generated by selecting voxels that were included in the brain region in all subjects.
A 2-sample t test was used to compare the rCBF between the AD and control groups at a voxel-level significance threshold of P < .001 uncorrected for multiple comparisons. Only clusters of 50 voxels or larger were taken into account. The area of hypoperfusion due to AD defined by the SPM analysis was used as a 3D region of interest for the subsequent analyses. The maps of rABV and rATT were coregistered to the corresponding high-resolution T1-weighted image and then spatially normalized. The 3D region of interest for the hypoperfused area defined by the SPM analysis was applied to the normalized rABV and rATT maps, and mean values of rCBF, rABV, and rATT within the hypoperfused area were thus measured for each subject. Measured perfusion indices (rCBF, rABV, and rATT) were statistically compared between the AD and control groups by using a t test. P values < .05 after Bonferroni correction for multiple comparisons (3 comparisons) were considered to be significant.
Results
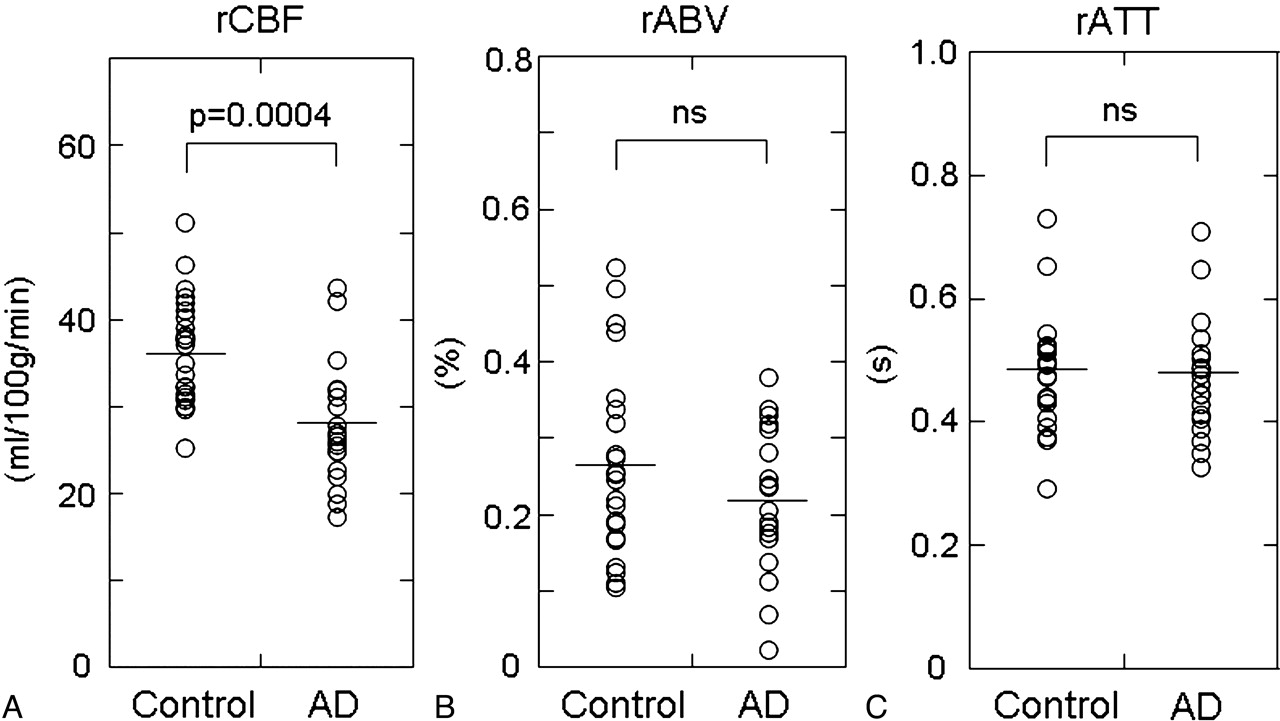
Figures 1 and 2 show maps of rCBF, rABV, and rATT of a healthy subject and a patient with AD, respectively. SPM analysis revealed a significant CBF decrease in areas of the bilateral precunei and the left posterior cingulate gyrus (Fig 3). Figure 4 summarizes the results of the intergroup comparison of the mean values of the 3 hemodynamic parameters (rCBF, rABV, and rATT) within the region of interest. The comparison of rCBF values revealed that the mean rCBF was significantly lower in the AD group (mean, 27.8 ± 7.1 mL/100 g/min) than the control group (36.7 ± 6.3 mL/100 g/min) (P = .0004) (Fig 4A). The comparison of rABV showed that the mean rABV was also lower in the AD group (0.22 ± 0.10%) than the control group (0.27 ± 0.12%), though the difference did not reach the level of statistical significance (P > .05) (Fig 4B). The comparison of rATT showed no difference between the 2 groups (0.47 ± 0.10 seconds for the AD group and 0.48 ± 0.09 seconds for the control group) (P > .05) (Fig 4C).

Maps of the rCBF, rABV, and rATT of a 70-year-old healthy woman. Note the relative prolongation of ATT in the anterior and posterior border zones (arrows), which is a normal finding.
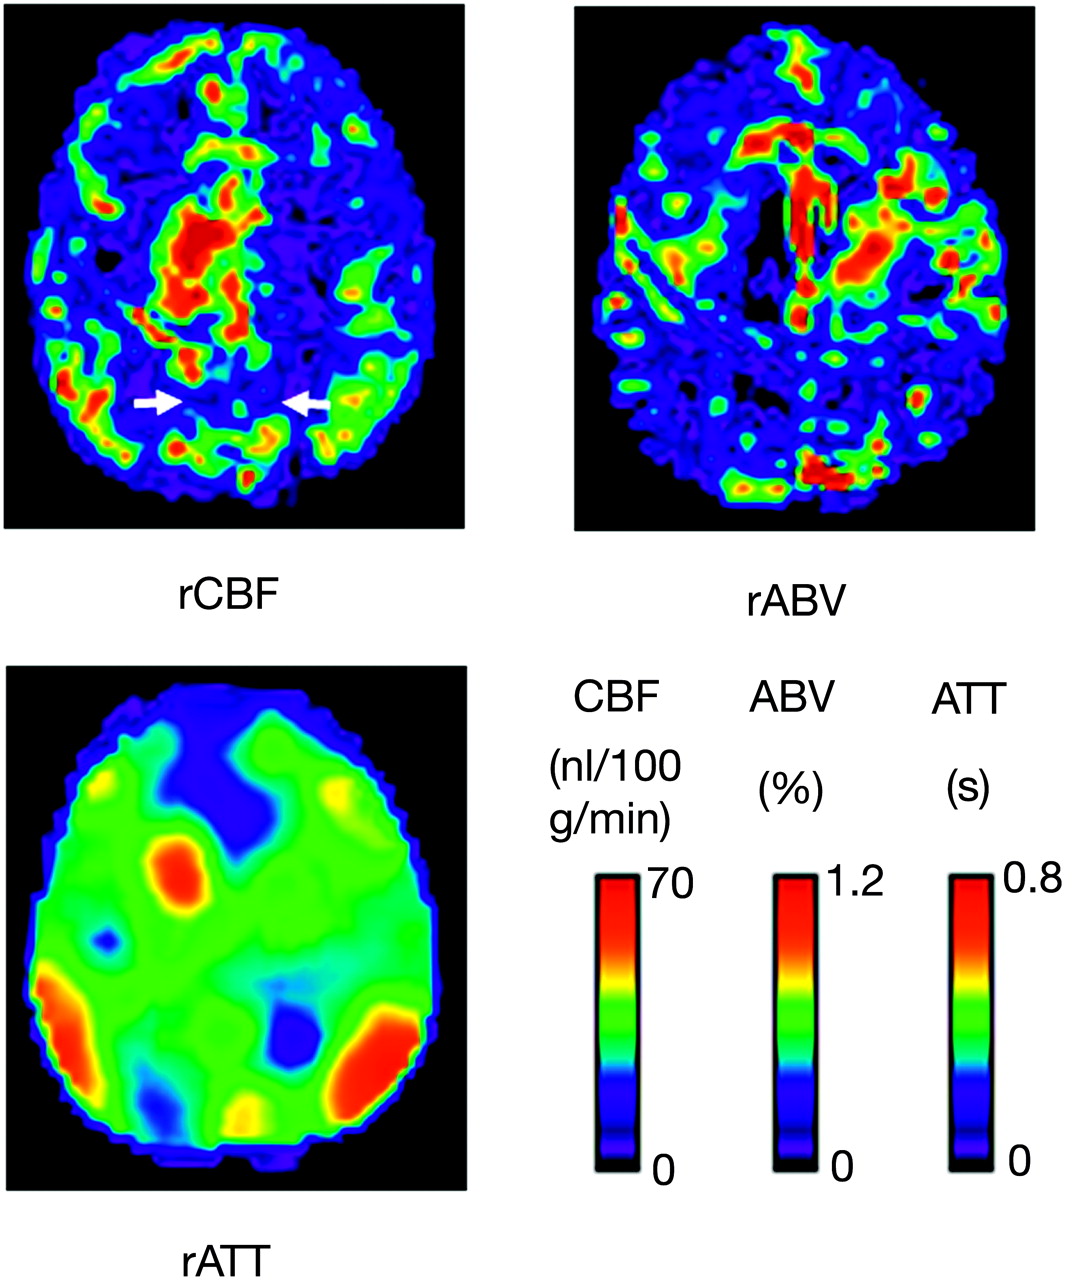
Maps of the rCBF, rABV, and rATT of a 57-year-old male subject with AD. Note that the rCBF is diffusely decreased in comparison with that in a healthy subject (Fig 1). Hypoperfusion is evident, especially in the bilateral precunei (arrows) and frontal lobes. rABV also appears to be reduced in the corresponding regions. Despite the decreased rCBF, no prolongation of ATT is observed in these regions, whereas normal prolongation of ATT is observed in the borderzones.
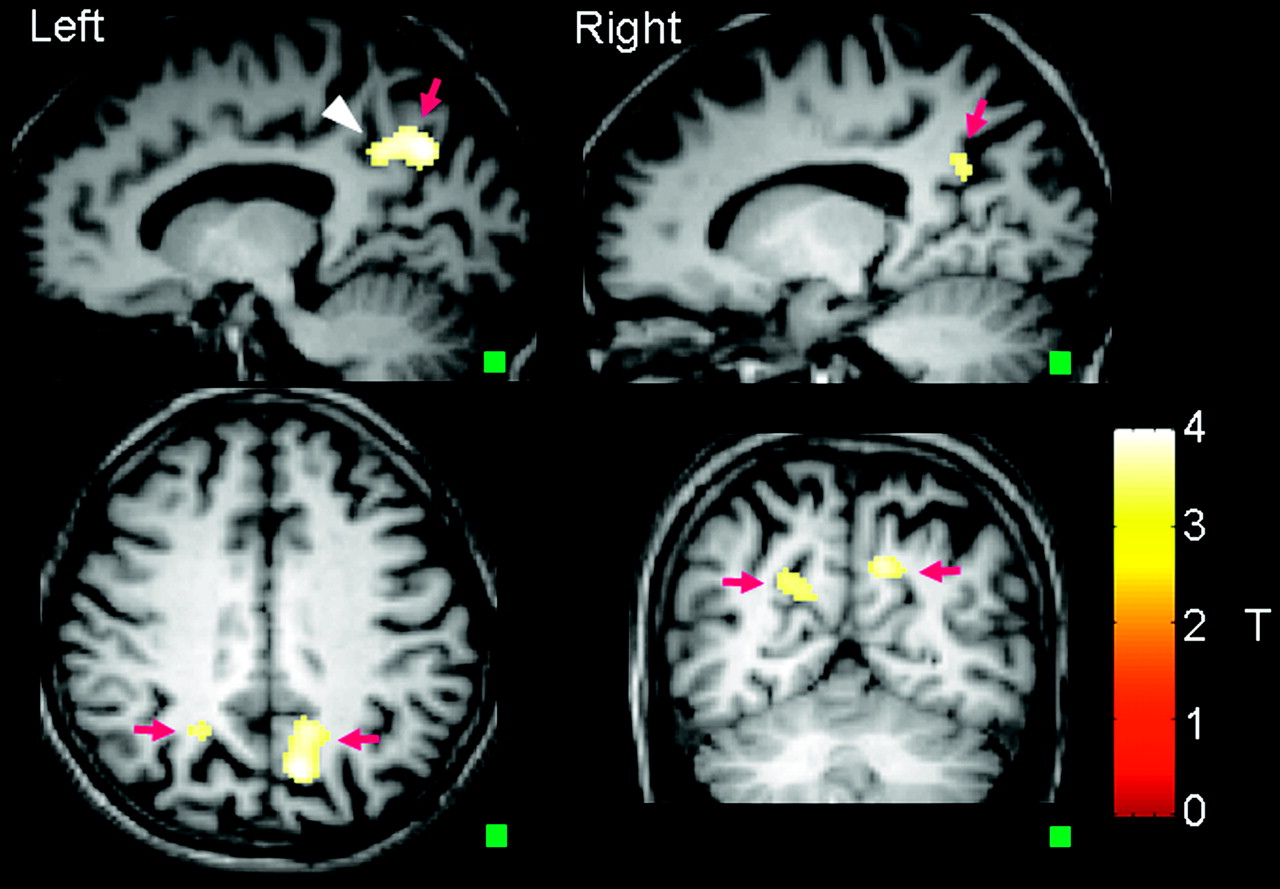
Regions of hypoperfusion defined by SPM analysis. Note that the hypoperfusion is seen in the bilateral precunei (arrows) and the left posterior cingulate gyrus (arrowhead). A small square in the lower right-hand corner of each image indicates a cube of 50 voxels, the size of the cluster used in the SPM analysis.

Plots of the averaged rCBF (A), rABV (B), and rATT (C) values within the region of interest of significant hypoperfusion determined by the SPM analysis. Note that there is no significant difference in rATT (C) between control and AD groups, whereas rCBF is significantly lower in the AD group in comparison with the control group (A). rABV is slightly lower in the AD group, though the difference is not statistically significant (B).
Discussion
Our results revealed no significant rATT prolongation in the hypoperfused area in patients with AD, despite a relatively profound CBF deficit (lower than that of the control group by 24.2% on average). rABV was lower in patients with AD, though the difference was not statistically significant. These findings are distinct from those seen in cerebrovascular disease, where lowered perfusion pressure results in the dilation of small resistance vessels and the prolongation of MTT in local tissue.14 The findings seem consistent with the hypothesized mechanism of the degeneration of local neural tissue and/or the secondary transneuronal effect from such degeneration in remote brain regions. Hemodynamic abnormalities of AD have been explored by several researchers. For example, Nagata et al5 measured MTT and VR to carbon dioxide inhalation in patients with AD and VD and found that MTT was prolonged and VR was depressed in patients with VD, whereas the 2 indices were preserved in patients with AD.5
Impairment in the responsiveness to vascular activation in VD was reported by De Reuck et al,15 whereas other groups found no such impairment in AD based on SPECT16–18 and xenon-enhanced CT19 analysis. Moreover, Puls et al20 revealed, by using transcranial sonography, that tissue transit time is prolonged in VD but not in degenerative dementia. Most interesting, Nagata et al5 also found a mildly increased oxygen extraction fraction in AD and speculated that hypoperfusion in AD may be attributable to a perfusion abnormality at the level of the capillaries or the blood-brain barrier. This finding supports the hypothesis that cerebral hypoperfusion is a cause rather than a consequence of neurodegeneration. Thus, the mechanism of perfusion abnormality in AD is still debatable. Nevertheless, differential hemodynamic findings can be clinically useful to distinguish AD from VD.
ASL has been primarily used to measure CBF and only rarely to measure other hemodynamic parameters such as ATT and ABV. Measurement of ATT by ASL is technically challenging; thus, there have been very few reports on its clinical application.21,22 QUASAR is capable of ATT measurement with its multiple-delay time-sampling technique. There are a few more technical reports of ASL-based methods to measure transit time or its equivalents. For example, Wang et al23 proposed a method called “flow encoding arterial spin tagging.”23 Unlike our method based on multiple-delay time sampling, this technique derives the tissue transit time from the ratio between the perfusion signals in the vascular and microvascular compartments, which are obtained by using flow-encoding bipolar gradients.23
ABV is another parameter that characterizes the local hemodynamic status. As with ATT, ASL measurement of ABV has been reported only rarely.24 Our results showed a slightly decreased ABV in AD, which may represent a decrease in the volume of the vascular bed.
As demonstrated in this study, ASL with multiple-delay time sampling can noninvasively provide quantitative cerebral hemodynamic parameters, including CBF, ABV, and ATT, simultaneously. These new features along with the use of a high-field MR imager would expand the clinical application of ASL.
Our study has several limitations. The number of subjects was relatively small (22 control subjects and 19 patients with AD). The retrospective nature of this study may have lead to biased patient selection. A low signal intensity-to-noise ratio is inherent to the ASL measurement, even at 3T MR imaging. The spatial resolution of the ASL was also limited; this feature may have resulted in partial volume contamination of different types of tissues (gray matter, white matter, and CSF) in each imaging voxel. rABV values reported in this study were lower than previously reported values in gray matter.11 This finding is likely due to smoothing in the SPM analysis. Many previous imaging studies have demonstrated hypoperfusion in patients with AD in the areas of the bilateral tempoparietal cortices and in the bilateral posterior cingulate gyri and precunei. Our data revealed only hypoperfusion in the latter regions, and the hypoperfusion in the bilateral parietal lobes was not depicted in the SPM analysis. We assume that hypoperfusion in these regions was less consistent among our patients in the CBF maps than that in the regions of the posterior cingulate gyri and precunei.
A previous study on the reliability of ASL methods at 1.5T reported a regional variability of reliability in perfusion signal intensity, namely lower reliability in the frontal brain regions than in the posterior regions.25 In this report, the authors speculated that this was due to stronger magnetic susceptibility artifacts in these regions. Our data obtained at a higher magnetic field strength (3T) had more chance to be affected by susceptibility effect and may have resulted in more pronounced regional variability in reliability. To our knowledge, this issue has not been specifically elucidated and, therefore, remains a subject of future studies.
Conclusions
We measured rABV and rATT in the hypoperfused area in patients with AD by using a quantitative ASL method. No prolongation of rATT was observed, whereas rABV was slightly decreased. The lack of rATT prolongation suggests that the mechanism of hypoperfusion is distinct from that in cerebrovascular diseases.
References
- Received December 10, 2008.
- Accepted after revision January 25, 2009.
- American Society of Neuroradiology
In this issue


Jump to section
Related Articles
Cited By...
- Multi-scale Assessment of Brain Blood Volume and Perfusion in the APP/PS1 Mouse Model of Amyloidosis
- Arterial Spin-Labeling Parameters Influence Signal Variability and Estimated Regional Relative Cerebral Blood Flow in Normal Aging and Mild Cognitive Impairment: FAIR versus PICORE Techniques
- Regional Cerebral Arterial Transit Time Hemodynamics Correlate with Vascular Risk Factors and Cognitive Function in Men with Coronary Artery Disease
- Hemodynamic Alterations in Vertebrobasilar Large Artery Disease Assessed by Arterial Spin-Labeling MR Imaging