
Abstract
BACKGROUND AND PURPOSE: VRSs are the perivascular spaces surrounding the deep perforating arteries in the brain. Although VRS variations with age and disease pathologies have been reported previously, the radiologic characteristics of the VRS in relation to AD are poorly understood. This study investigated the prevalence, spatial distribution, and severity of the VRS in AD, MCI, and older adults who were CN. It also investigated the relationship of the VRS to white matter changes.
MATERIALS AND METHODS: Structural MR imaging data were acquired from 158 participants (AD = 37, MCI = 71, CN = 50, mean age = 74.97 ± 7.20 years) who had undergone T1WI at 3T. The severity of VRS in the white matter, basal ganglia, hippocampus, and brain stem structures was evaluated by using a semiquantitative scale, adapted from existing rating scales. A VRS total score summarizing the subscales was calculated to assess the whole-brain VRSs.
RESULTS: VRSs were observed in multiple brain regions of all participants, typically presented as <2-mm well-margined symmetric round-, oval- and linear-shaped hypointensities on T1WI. The VRS total score increased with leukoaraiosis, atrophy, and advanced age (P < .001). Individuals with AD and MCI showed greater levels of VRS than control subjects. The VRS total score discriminated individuals with AD and those who were CN with an accuracy of 0.79 (95% CI, 0.69–0.89).
CONCLUSIONS: VRSs are common in older adults and are more severe in AD and MCI than in CN. Whether increased VRSs can be reliably used to aid in AD diagnosis warrants further investigation.
Abbreviations
- AD
- Alzheimer disease
- ADNI
- Alzheimer Disease Neuroimaging Initiative
- ANOVA
- analysis of variance
- AUC
- area under the curve
- BG
- basal ganglia region
- BS
- brain stem
- CDR
- Clinical Dementia Rating
- CI
- confidence interval
- CN
- cognitively normal
- CS
- centrum semiovale
- FL
- frontal lobe
- HP
- hippocampal area
- ICC
- interclass correlation
- MCI
- mild cognitive impairment
- MMSE
- Mini-Mental State Examination
- OL
- occipital lobe
- PL
- parietal lobe
- ROC
- receiver operating characteristic curve analysis
- T1WI
- T1-weighted imaging
- T2WI
- T2-weighted imaging
- TL
- temporal lobe
- VRS
- Virchow-Robin space
VRSs are the perivascular spaces surrounding the deep perforating arteries in the brain.1,2 VRSs have been described in older adults and other age groups, in the basal ganglia, centrum semiovale, midbrain, and subcortical white matter regions.3,4 On T1WI, the VRSs appear as hypointensities,4,5 and their pathologic dilation has been reported in vascular, neuroinflammatory, metabolic, and genetic diseases and in traumatic brain injury.5–9 Several mechanisms may underlie the neuropathologic enlargement of VRS, including increased permeability of the arterial wall, brain atrophy and tissue fibrosis, perivascular demyelination, and obstruction of lymphatic drainage pathways and/or CSF circulation.3,10
VRSs have been identified as a biomarker indicative of microvascular disease and are strongly related to systemic vascular disease; a possible association of VRS with vascular risk factors has been proposed.5,11–13 Many vascular risk factors are also risk factors for AD14,15 so vascular and degenerative mechanisms are considered to have parallel effects. If the severity of VRSs could be an independent feature indicating vascular impairment with involvement of cerebral arteries, then it is arguable that increased VRS severity should also be associated with AD. Indeed, both pathologic enlargement of VRS in AD16–18 and relations of VRS MR imaging features with cognitive decline have been reported.19 Even so, to date no study has directly compared the radiologic characteristics of VRSs in patients with AD and older adults who are CN. Therefore, to our knowledge, direct association between AD and changes of MR imaging features of VRSs has not been examined. The objectives of the present study were the following: 1) to assess the radiologic characteristics of the VRS; 2) to compare the frequency and severity of the VRSs in individuals with AD and MCI and in older adults who are CN; and 3) to investigate the relations of VRSs to brain atrophy, white matter changes, and cognitive decline.
Materials and Methods
Data
Data used for this study were obtained from the ADNI.20 The ADNI was launched in 2003 by multiple nonprofit organizations as a 5-year public-private partnership. The primary goal of the ADNI has been to test whether serial MR imaging, positron-emission tomography, other biologic markers, and the progression of MCI and early AD. The study intended to determine sensitive and specific markers of very early AD progression to aid researchers and clinicians in developing new treatments and in monitoring their effectiveness, as well as lessening the time and cost of clinical trials. Patient categorization was made by ADNI site physicians on the basis of the National Institute of Neurological and Communicative Disorders and Stroke/Alzheimer's Disease and Related Disorders Association criteria and was reviewed by ADNI clinical monitors (http://adni.loni.ucla.edu/wp-content/uploads/2010/09/ADNI_GeneralProceduresManual.pdf).
Subjects (AD = 37, MCI = 71, CN = 50), 56.35–91.15 years of age (mean = 74.97 ± 7.20 years) who had a 3D T1WI scanning at 3T between October 2005 and September 2008 were included in the study (Table 1). The 3D T1WI used a gradient-echo sequence (TR = 2300–3000 ms, TI = 853–900 ms, FOV = 25–260 × 240 mm, flip angle = 8°–9°).21 Cognitive measures included the MMSE and the CDR scale.
Demographic and clinical features of the subjects
Rating of the VRS
Previous studies have been designed to rate VRSs in specific brain regions, such as the basal ganglia areas and parts of the white matter.11,12,19 To be able to grade VRSs in various brain regions where the VRSs can be present, we used a visual rating scale by adapting existing semiquantitative rating scales.11,12,19 The VRS attenuation was rated on the basis of high-resolution (1 mm3) T1WI. The VRSs were scored independently in 8 brain regions, including structures in the white matter (subregions of the frontal lobe, temporal lobe, parietal lobe, occipital lobe, and the centrum semiovale), basal ganglia region (including the caudate, lentiform nuclei, thalamus, internal capsule, substantia innominata, and insular area), brain stem, and hippocampal area (including the hippocampus, parahippocampal gyrus, and amygdalae). Scaling grades varied by structures, given the anatomy and VRS attenuation within these structures. Specifically, a 6-grade (0–5) scale was used for each of the white matter subregions (where 0 = none; 1 = ≤5 per side; 2 = 5–10 on the severe side; 3 = >10 on the severe side; 4 = >10, with any VRS ≥3 mm on 1 side; 5 = >10, with any VRS ≥3 mm on both sides). Similarly, 5 grades (0–4) were assigned for the basal ganglia region (where 0 = ≤10 on the severe side; 1 = 10–20 on the severe side; 2 = >20 on the severe side; 3 = >20, with any VRS ≥3 mm on 1 side; 4 = >20, with any VRS ≥3 mm on both sides) and for the hippocampal area (where 0 = none; 1 = ≤5 on the severe side; 2 = >5 on the severe side; 3 = >5 and at least 1 VRS ≥3 mm on 1 side; 4 = >5, with any VRS ≥3 mm on both sides). Four grades (0–3) were assigned for the brain stem (0 = none; 1 = ≤5; 2 = >5; 3 = >5, with any VRS ≥3 mm). Examples of the VRS rating are given in Fig 1. Summarizing the subscales of various structures resulted in a total score ranging between a minimum of zero and a possible maximum of 36. Severe VRSs within a structure were defined as subscale ≥2.

Examples of the VRSs, white matter abnormalities, and atrophy in different regions of the brain. A, The VRSs in the basal ganglia region (score = 2). B, Magnified focal area in A. C, Magnified focal area in the frontal lobe in D (score = 2). D, The VRSs in the frontal and occipital lobes. E, Magnified focal area in the occipital lobe in D (score = 3). F, The VRSs in the brain stem (score = 2). G, Magnified focal area in F. H, The perivascular and deep white matter hypointensities (both scores = 3). I, Brain atrophy (score = 2)..
The VRSs and lacunar infarctions were separated primarily on the basis of their size. As documented in the literature,16 lacunar infarctions are usually >5 mm in diameter, larger than VRSs, which are usually <2 mm. Additional discrimination was based on their shape. VRSs are typically symmetrically presented across both hemispheres, while lacunar infarctions are usually asymmetric.
Rating of White Matter Abnormality and Atrophy
To determine the relationship of the VRSs with whole-brain atrophy and white matter changes, we constructed a brain atrophy and lesion index22 for each subject. The periventrical white matter abnormalities were scored by using 4 grades (0 = absence; 1 = “caps” or pencil-thin lining; 2 = smooth “halo”; 3 = irregular periventricular abnormal signal intensities extending into the deep white matter). The deep white matter lesions were scored with 6 grades (0 = absent; 1 = punctuate foci; 2 = beginning of confluence foci; 3 = large confluent areas; 4 = large confluent white matter areas involving all cerebral lobes; 5 = complete confluent white matter disease). This resulted in a 9-level score for leukoaraiosis. Global atrophy was scored as follows: 0 = no obvious atrophy; 1 = mild atrophy; 2 = moderate atrophy; 3 = severe atrophy (Fig 1H−J).
Statistical Analysis
The inter-rater agreement rate was evaluated by using the ICC on a random sample of 20% of the subjects in the dataset, with raters as independent variables. All images were independently assessed by 2 experienced neuroradiologists, blinded to the participants' demographic and cognitive statuses. One rater has 8 and the other has 15 years of experience. Differences among diagnostic groups were compared by using ANOVA. Interrelations between the VRS score and confounders, including atrophy and leukoaraiosis, clinical diagnosis, sex, age, the MMSE score, and the vascular risk factors, were examined by using regression models. The performance of VRS total score in distinguishing individuals with AD from those who were CN was evaluated by using the AUC and ROC. Statistics were performed by using the Statistical Package for the Social Sciences, Version 15.0 software (SPSS, Chicago, Illinois) and codes developed by using Matlab, Version 2007 (MathWorks, Natick, Massachusetts). Significance level was set at P < .05, 2-tailed.
Results
The inter-rater agreement analysis showed high reliability (ICC = 0.91; 95% CI, 0.81–0.96 for VRS score; ICC = 0.89, 95% CI, 0.81–0.93 for white matter lesions; and ICC = 0.86, 95% CI, 0.80–0.91 for atrophy).
There was no difference in age between diagnostic groups; but the MCI group consisted of more men compared with the AD or CN groups (63.4% versus <40%). More patients with AD and MCI had a history of stroke and hypertension, compared with healthy controls (Table 1).
VRSs were observed in the brains of all subjects regardless of diagnostic group, even though not everyone showed VRSs in all structures. Within each group, the VRS score differed among people with different vascular profiles. For example, individuals with AD with a history of hypertension had a mean VRS number of 17.56 ± 2.61, which was significantly higher than that of patients with AD who did not have hypertension (15.19 ± 4.78, P = .002). The VRSs were most common in the bilateral basal ganglia regions. The greatest percentage of severe VRSs was found in the parietal lobe (82.3%), followed by the central semiovale (69.0%) and frontal lobe (65.2%). Diffused VRSs in the whole brain were observed in 7.0% of subjects, with a higher frequency in patients with AD (10.8%) and MCI (7.1%) than in those who were CN (4%). Significant group differences were found in VRS subscales (F = 3.52–13.76, P < .05) and total score (F = 16.50, P < .001; AD>MCI>CN; On-line table).
Correlations among VRS subscales appeared to be diagnosis-dependent. The VRS subscales in the white matter structures were correlated in each diagnostic group. However, correlations between the VRSs in the white matter and basal ganglia or brain stem were observed only in the CN subjects, while the VRSs in the basal ganglia or brain stem were correlated both CN and MCI subjects. In no group were the hippocampal VRSs correlated with VRS subjects in other structures, ie, white matter, basal ganglia, or brain stem. (Table 2).
Interrelations among individual subscales
The VRS total score increased with age in CN and MCI (P < .001, Fig 2 A), with group differences in initial VRS levels and rates of change. In contrast, individuals with AD showed a high initial value, which did not increase with age. Most subscales were closely related to age (except the parietal lobe and hippocampal subscales) (r = 0.16–0.27, P = .001–.044).

Changes of the total VRS score as a function of age (A) and of the MMSE (B). The relationship of the VRS score with age (A) could be described by using linear regressions y = a + bx. Stars and the dashed line represent MCI (a = 3.70, b = 0.30, r = 0.30, P = .010), open circles and dotted lines represent CN (a = −18.33, b = 0.47, r = 0.47, P = .001), and filled circles represent AD (P > .05). The relationship of the VRS score with MMSE (B) could be described by using linear regressions y = a + bx for all subjects, where a = 28.33, b = −0.21, r = 0.20, P = .009.
A negative correlation between the VRS total score and the MMSE score was observed for all subjects (r = −0.21, P = .009; Fig 2B). The basal ganglia (r = −0.37, P < .001), frontal lobe (r = −0.23, P = .004), brain stem (r = −0.17, P = .034), and hippocampal area (r = −0.17, P = .038) subscales were each related to the MMSE scores.
The VRS total score increased with atrophy severity in CN (r = 0.31, P < .001) but not in MCI or AD subjects. The VRS total score (Fig 3 ) and most subscales (except the hippocampal subscale) were correlated with leukoaraiosis (r = 0.55, P < .001 for VRS total score; r = 0.29–0.49, P < .001 for the subscales). Leukoaraiosis accounted for 29.6% of the VRS variability, while diagnosis accounted for 10.6% and MMSE for 1.1%. Age, sex, and atrophy were insignificant in a multivariate model. Of note, the effect of leukoaraiosis on VRSs was more evident in CN (31.8%) and MCI (33.8%) than in AD (18.1%) subjects. The VRS total score distinguished 78.9% of individuals with AD from those who were CN (Fig 4 ) subjects.

VRS total scores at different levels of leukoaraiosis. Significant differences are found among leukoaraiosis levels within each diagnosis.
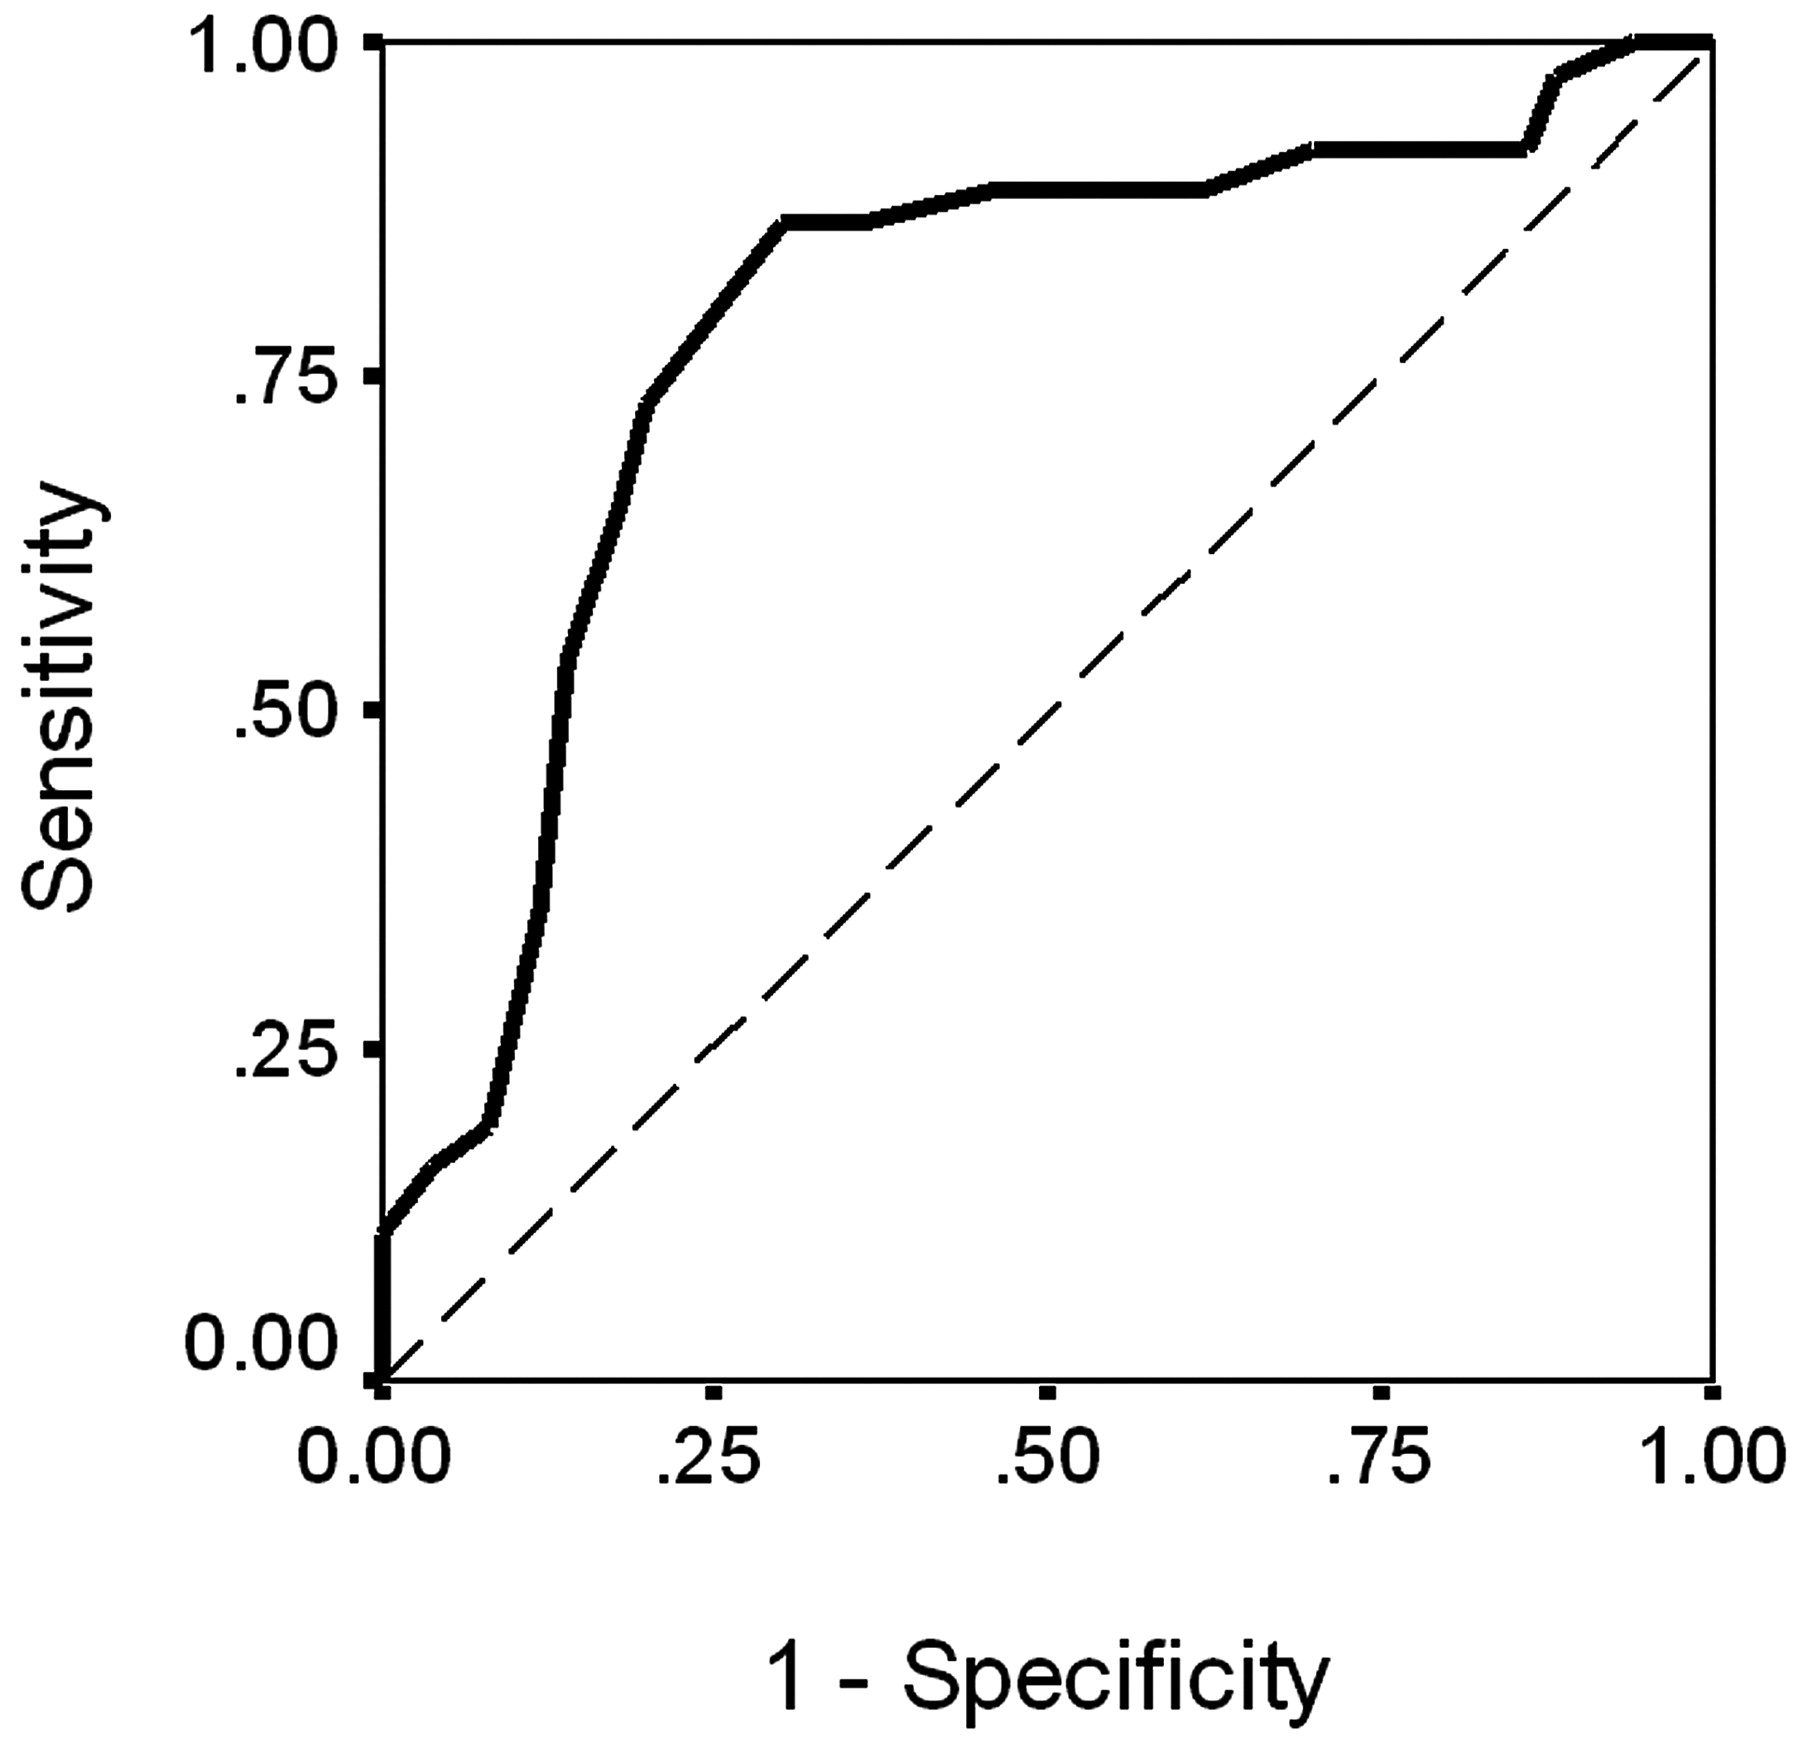
The ROC for the VRS score in identifying individuals with AD and CN (solid line: AUC = 0.789; 95% CI, 0.688–0.891). The dashed line represents AUC = 0.50.
Of the 71 patients with MCI, 18 (25.4%) converted to AD within 12 months. Most of the converters had a VRS total score that was above the MCI group mean VRS value (16.38 ± 4.79 for the converters versus 14.62 ± 3.44 for nonconverters). A higher correlation coefficient for the VRSs and leukoaraiosis was observed for the converters (r = 0.71) than for the nonconverters (r = 0.54, P < .01 in both cases).
Discussion
This is the first attempt to understand the whole-brain VRSs in relation to AD and MCI by using MR imaging. Results showed a higher VRS frequency in AD. The distribution and severity of VRSs were correlated with age, cognitive decline, white matter changes, and brain atrophy. This finding strongly suggests that AD is associated with significant small-vessel impairments, in accordance with white matter lesions and atrophy.
The observation that not only were the VRSs more frequently present in AD but that the severity of VRSs also differed with vascular deficits suggests that VRSs may be an independent feature indicating systemic vascular disease with involvement of cerebral arteries. This is in support of the current literature suggesting that VRSs are indicative of microvascular brain disease and are strongly related to systemic vascular disease.11–13
An AD-associated increase of VRS attenuation in the white matter has been suggested by histologic studies.23,24 A higher attenuation of VRSs in the basal ganglia in AD has also been seen in other MR imaging studies and has been proposed to differentiate AD from vascular dementia.11 Our data are consistent with these findings. In addition, our data show that the VRS attenuation in the whole brain (ie, not just white matter) was higher in AD and MCI than in CN subjects. The mechanisms underlying such increase are not fully understood but likely include the impact of vascular risk factors on AD neuropathogenesis.25,26–28
Our results show that VRS and leukoaraiosis changes are related, though they may represent different aspects of brain changes, for which the disease may impact on 1 aspect more than on the other. It seemed that changes in VRS features were not identical to those of white matter lesions and were more likely to be affected by AD pathology, as shown by the group difference. Whether a causal relationship exists between VRSs and leukoaraiosis is unclear. Even so, leukoaraiosis was more prominent for VRSs than other factors such as global atrophy, consistent in the present and other studies.19,29,30 Indeed, the VRSs and leukoaraiosis have similar pathogenesis; both are triggered by the slow occlusion of interstitial fluid due to the deposition of β-amyloid in the cortical and leptomeningeal arteries in AD.24,31 It is known that the prevalence of VRSs increases with advanced age,3,4 and our data verify this. Our data further suggest that the relationship with age (and with atrophy) varied with diagnosis (ie, a stronger relationship was observed in CN individuals and it disappeared in patients with AD). This result is not surprising: Complex factors may be associated with AD process, in addition to age-associated vascular burdens, which may affect VRS formation and other neuropathologic changes.24,31
Note the differences of VRSs in the basal ganglia region among the AD, MCI, and CN groups. These may potentially serve as a novel criterion for diagnosis.11 Nevertheless, currently the basal ganglia substructures (eg, the caudate nucleus, lentiform nucleus, substantia innominata, and so forth) have not been separated in the VRS rating, and it is not understood whether any substructures in this region may be more important than the others. Such separation appears to be beneficial because variations in the VRS frequency have been found among basal ganglia substructures, related to the characteristics of their functional anatomy.3,32 Future research should take this into consideration.
Our data must be interpreted with caution. This study applied T1WI to score VRSs. Previous studies have shown that 3D T1WI might be superior to T2WI for visualizing VRSs; however, it might not be optimal.11 Even so, T1WI is one of the most accessible sequences that have been repeatedly used to show advantages for detecting VRSs. The 3D high-resolution T1WI is particularly appealing, considering that it can display the VRSs better than other imaging involving intersection gaps.3 In multiple brain regions, the VRSs were detectable in 100% of the subjects with AD or MCI and in healthy controls. These findings are largely attributed to the improved signal intensity–to-noise ratio and imaging contrast at higher MR imaging field strengths3,4 as well as to the high-resolution T1WI that can allow even small-sized VRSs to be visualized.3,11
Furthermore, it is difficult to completely rule out small lacunar infarctions from the VRSs. This was the case in the basal ganglia area and brain stem, where numerous signal-intensity variations are present. Although small lacunes and VRSs have different pathologic features, they sometimes can have similar appearances on MR imaging. On the other hand, in practice, the VRSs appear to have an upper size limit and seldom reach a diameter of 5 mm. The hypointensities on T1WI are more likely to be lacunes rather than VRSs if they are ≥5 mm.3,4 VRSs also have sharp edges, while lacunes may show irregular edges because of gliosis around the lesion. Furthermore, VRSs are usually symmetric, while lacunes are asymmetrically distributed across the hemispheres. In this study, lacunar infarctions (>5 mm) were found in <5% of the subjects, with no significant difference among the 3 groups.
As a visual scale, the rating is inherently imprecise, compared with volumetric measurements. In particular, white matter changes could be better measured in volume than by using a rating scale. Even so, visual rating scales are much faster and do not require intensive expert input and, thus, are applicable in clinical and research settings, especially when time is a concern. The current rating system was adapted from well-validated scaling systems and included detailed location-specific subscales for improved usability.
Conclusions
This article evaluated the radiologic features of the VRS in AD, MCI, and CN subjects. VRSs were presented in multiple brain structures with higher densities in patients with AD and MCI compared with those with normal aging. The distribution and severity of VRSs were correlated with age, cognitive decline, and white matter changes. This study provides novel evidence suggesting that AD is associated with small-vessel impairments, in accordance with other structural changes in the brain. Because the present study primarily has a cross-sectional design, it is not completely clear whether dilation of VRSs precedes the development of clinically overt AD. In the future, larger scale longitudinal MR imaging studies with outcomes regarding dementia and/or cognitive decline will help validate whether the VRS features can be used to help with AD diagnosis.
Acknowledgments
We thank Dr Jihua Liu for help with inter-rater reliability assessment, and Carmen Archibald, Holly Bell, and Elizabeth Vandermolen, for proofreading of the manuscript.
Footnotes
-
Data used in preparation of this article were obtained from the ADNI data base (www.loni.ucla.edu/ADNI). As such, the investigators within the ADNI contributed to the design and implementation of ADNI and/or provided data but did not participate in analysis or writing of this report. ADNI is the result of efforts of many coinvestigators from a broad range of academic institutions and private corporations. The principal investigator is Michael W. Weiner, MD, VA Medical Center and University of California, San Francisco. A complete listing of ADNI investigators is available at http://www.loni.ucla.edu/ADNI/Collaboration/ADNI_Manuscript_Citations.pdf.
-
Indicates article with supplemental on-line table.
-
Disclosures: Data collection and sharing for this project was funded by the ADNI (National Institutes of Health grant U01 AG024904). ADNI is funded by the National Institute on Aging, the National Institute of Biomedical Imaging and Bioengineering, and through generous contributions from the following: Abbott, AstraZeneca AB, Bayer Schering Pharma AG, Bristol-Myers Squibb, Eisai Global Clinical Development, Elan Corporation, Genentech, GE Healthcare, GlaxoSmithKline, Innogenetics, Johnson & Johnson, Eli Lilly and Co, Medpace Inc, Merck and Co Inc, Novartis AG, Pfizer Inc, F. Hoffman-La Roche, Schering-Plough, Synarc Inc, and Wyeth, as well as nonprofit partners, the Alzheimer's Association and Alzheimer's Drug Discovery Foundation, with participation from the US Food and Drug Administration. Private sector contributions to ADNI are facilitated by the Foundation for the National Institutes of Health (www.fnih.org). The grantee organization is the Northern California Institute for Research and Education, and the study is coordinated by the Alzheimer Disease Cooperative Study at the University of California, San Diego. ADNI data are disseminated by the Laboratory for Neuro Imaging at the University of California, Los Angeles. This research was also supported by the Nova Scotia Health Research Foundation (Grant NSHRF-MED2086), the Capital Health Research Foundation (grant CDHA-RO33), the National Natural Science Foundation of China (grant 30730036), the National Basic Research Program of China (973 Program 2010CB732500), the National Institutes of Health grants P30 AG010129, K01 AG030514, and the Dana Foundation. Wei Chen received a National Research Council Canada fellowship from the Chinese Ministry of Education as a joint PhD student.
Indicates open access to non-subscribers at www.ajnr.org
References
- Received October 25, 2010.
- Accepted after revision December 30, 2010.
- © 2011 by American Journal of Neuroradiology
In this issue


Jump to section
Related Articles
Cited By...
- Divergent enlarged perivascular spaces volumes in early versus late age-of-onset Alzheimers disease
- Association of MRI Indices of Glymphatic System With Amyloid Deposition and Cognition in Mild Cognitive Impairment and Alzheimer Disease
- Lesion Volume in Relapsing Multiple Sclerosis is Associated with Perivascular Space Enlargement at the Level of the Basal Ganglia
- Physiology and Clinical Relevance of Enlarged Perivascular Spaces in the Aging Brain
- MRI-Visible Perivascular Spaces in the Centrum Semiovale Are Associated with Brain Amyloid Deposition in Patients with Alzheimer Disease-Related Cognitive Impairment
- Association of Enlarged Perivascular Spaces and Measures of Small Vessel and Alzheimer Disease
- Quantitative MRI of Perivascular Spaces at 3T for Early Diagnosis of Mild Cognitive Impairment
- Prevalence of hippocampal enlarged perivascular spaces in a sample of patients with hypertension and their relation with vascular risk factors and cognitive function
- Perivascular Spaces in Old Age: Assessment, Distribution, and Correlation with White Matter Hyperintensities
- White Matter Perivascular Spaces Are Related to Cortical Superficial Siderosis in Cerebral Amyloid Angiopathy
- Evaluation of Common Structural Brain Changes in Aging and Alzheimer Disease with the Use of an MRI-Based Brain Atrophy and Lesion Index: A Comparison Between T1WI and T2WI at 1.5T and 3T
- Rating Method for Dilated Virchow-Robin Spaces on Magnetic Resonance Imaging