Advertisement

Main menu

  • Home
  • Content
    • Current Issue
    • Accepted Manuscripts
    • Article Preview
    • Past Issue Archive
    • Video Articles
    • AJNR Case Collection
    • Case of the Week Archive
    • Case of the Month Archive
    • Classic Case Archive
  • Special Collections
    • AJNR Awards
    • ASNR Foundation Special Collection
    • Most Impactful AJNR Articles
    • Photon-Counting CT
    • Spinal CSF Leak Articles (Jan 2020-June 2024)
  • Multimedia
    • AJNR Podcasts
    • AJNR SCANtastic
    • Trainee Corner
    • MRI Safety Corner
    • Imaging Protocols
  • For Authors
    • Submit a Manuscript
    • Submit a Video Article
    • Submit an eLetter to the Editor/Response
    • Manuscript Submission Guidelines
    • Statistical Tips
    • Fast Publishing of Accepted Manuscripts
    • Graphical Abstract Preparation
    • Imaging Protocol Submission
    • Author Policies
  • About Us
    • About AJNR
    • Editorial Board
    • Editorial Board Alumni
  • More
    • Become a Reviewer/Academy of Reviewers
    • Subscribers
    • Permissions
    • Alerts
    • Feedback
    • Advertisers
    • ASNR Home

User menu

  • Alerts
  • Log in

Search

  • Advanced search
American Journal of Neuroradiology

American Journal of Neuroradiology

ASHNR American Society of Functional Neuroradiology ASHNR American Society of Pediatric Neuroradiology ASSR
  • Alerts
  • Log in

Advanced Search

  • Home
  • Content
    • Current Issue
    • Accepted Manuscripts
    • Article Preview
    • Past Issue Archive
    • Video Articles
    • AJNR Case Collection
    • Case of the Week Archive
    • Case of the Month Archive
    • Classic Case Archive
  • Special Collections
    • AJNR Awards
    • ASNR Foundation Special Collection
    • Most Impactful AJNR Articles
    • Photon-Counting CT
    • Spinal CSF Leak Articles (Jan 2020-June 2024)
  • Multimedia
    • AJNR Podcasts
    • AJNR SCANtastic
    • Trainee Corner
    • MRI Safety Corner
    • Imaging Protocols
  • For Authors
    • Submit a Manuscript
    • Submit a Video Article
    • Submit an eLetter to the Editor/Response
    • Manuscript Submission Guidelines
    • Statistical Tips
    • Fast Publishing of Accepted Manuscripts
    • Graphical Abstract Preparation
    • Imaging Protocol Submission
    • Author Policies
  • About Us
    • About AJNR
    • Editorial Board
    • Editorial Board Alumni
  • More
    • Become a Reviewer/Academy of Reviewers
    • Subscribers
    • Permissions
    • Alerts
    • Feedback
    • Advertisers
    • ASNR Home
  • Follow AJNR on Twitter
  • Visit AJNR on Facebook
  • Follow AJNR on Instagram
  • Join AJNR on LinkedIn
  • RSS Feeds

AJNR is seeking candidates for the AJNR Podcast Editor. Read the position description.

Research ArticleBrain
Open Access

Reliability of Longitudinal Brain Volume Loss Measurements between 2 Sites in Patients with Multiple Sclerosis: Comparison of 7 Quantification Techniques

F. Durand-Dubief, B. Belaroussi, J.P. Armspach, M. Dufour, S. Roggerone, S. Vukusic, S. Hannoun, D. Sappey-Marinier, C. Confavreux and F. Cotton
American Journal of Neuroradiology November 2012, 33 (10) 1918-1924; DOI: https://doi.org/10.3174/ajnr.A3107
F. Durand-Dubief
aFrom Service de Neurologie A et Fondation Eugène Devic EDMUS pour la Sclérose en Plaques (F.D.-D., M.D., S.R., S.V., C.C.), Hôpital Neurologique Pierre Wertheimer, Hospices Civils de Lyon, Bron, France
bCREATIS, UMR5220 CNRS & U1044 INSERM & Université de Lyon (F.D.-D., S.H., D.S.-M., F.C.), Villeurbanne, France
cUniversité de Lyon (F.D.-D., M.D., S.R., S.V., S.H., D.S.-M., C.C., F.C.), Lyon, France
  • Find this author on Google Scholar
  • Find this author on PubMed
  • Search for this author on this site
B. Belaroussi
dBIOCLINICA (B.B.), Lyon, France
  • Find this author on Google Scholar
  • Find this author on PubMed
  • Search for this author on this site
J.P. Armspach
eInstitut de Physique Biologique (J.P.A.), Strasbourg, France
  • Find this author on Google Scholar
  • Find this author on PubMed
  • Search for this author on this site
M. Dufour
aFrom Service de Neurologie A et Fondation Eugène Devic EDMUS pour la Sclérose en Plaques (F.D.-D., M.D., S.R., S.V., C.C.), Hôpital Neurologique Pierre Wertheimer, Hospices Civils de Lyon, Bron, France
cUniversité de Lyon (F.D.-D., M.D., S.R., S.V., S.H., D.S.-M., C.C., F.C.), Lyon, France
  • Find this author on Google Scholar
  • Find this author on PubMed
  • Search for this author on this site
S. Roggerone
aFrom Service de Neurologie A et Fondation Eugène Devic EDMUS pour la Sclérose en Plaques (F.D.-D., M.D., S.R., S.V., C.C.), Hôpital Neurologique Pierre Wertheimer, Hospices Civils de Lyon, Bron, France
cUniversité de Lyon (F.D.-D., M.D., S.R., S.V., S.H., D.S.-M., C.C., F.C.), Lyon, France
  • Find this author on Google Scholar
  • Find this author on PubMed
  • Search for this author on this site
S. Vukusic
aFrom Service de Neurologie A et Fondation Eugène Devic EDMUS pour la Sclérose en Plaques (F.D.-D., M.D., S.R., S.V., C.C.), Hôpital Neurologique Pierre Wertheimer, Hospices Civils de Lyon, Bron, France
cUniversité de Lyon (F.D.-D., M.D., S.R., S.V., S.H., D.S.-M., C.C., F.C.), Lyon, France
fLyon Neuroscience Research Center (S.V., C.C.), INSERM U1028, CNRS UMR5292, Université Lyon 1, Lyon, France
  • Find this author on Google Scholar
  • Find this author on PubMed
  • Search for this author on this site
S. Hannoun
bCREATIS, UMR5220 CNRS & U1044 INSERM & Université de Lyon (F.D.-D., S.H., D.S.-M., F.C.), Villeurbanne, France
cUniversité de Lyon (F.D.-D., M.D., S.R., S.V., S.H., D.S.-M., C.C., F.C.), Lyon, France
gDépartement IRM-CERMEP-Imagerie du Vivant (S.H., D.S.-M.), Bron, France
  • Find this author on Google Scholar
  • Find this author on PubMed
  • Search for this author on this site
D. Sappey-Marinier
bCREATIS, UMR5220 CNRS & U1044 INSERM & Université de Lyon (F.D.-D., S.H., D.S.-M., F.C.), Villeurbanne, France
cUniversité de Lyon (F.D.-D., M.D., S.R., S.V., S.H., D.S.-M., C.C., F.C.), Lyon, France
gDépartement IRM-CERMEP-Imagerie du Vivant (S.H., D.S.-M.), Bron, France
  • Find this author on Google Scholar
  • Find this author on PubMed
  • Search for this author on this site
C. Confavreux
aFrom Service de Neurologie A et Fondation Eugène Devic EDMUS pour la Sclérose en Plaques (F.D.-D., M.D., S.R., S.V., C.C.), Hôpital Neurologique Pierre Wertheimer, Hospices Civils de Lyon, Bron, France
cUniversité de Lyon (F.D.-D., M.D., S.R., S.V., S.H., D.S.-M., C.C., F.C.), Lyon, France
fLyon Neuroscience Research Center (S.V., C.C.), INSERM U1028, CNRS UMR5292, Université Lyon 1, Lyon, France
  • Find this author on Google Scholar
  • Find this author on PubMed
  • Search for this author on this site
F. Cotton
bCREATIS, UMR5220 CNRS & U1044 INSERM & Université de Lyon (F.D.-D., S.H., D.S.-M., F.C.), Villeurbanne, France
cUniversité de Lyon (F.D.-D., M.D., S.R., S.V., S.H., D.S.-M., C.C., F.C.), Lyon, France
hService de Radiologie (F.C.), Centre Hospitalier de Lyon Sud, Pierre Bénite, France.
  • Find this author on Google Scholar
  • Find this author on PubMed
  • Search for this author on this site
  • Article
  • Figures & Data
  • Info & Metrics
  • Responses
  • References
  • PDF
Loading

Abstract

BACKGROUND AND PURPOSE: Brain volume loss is currently a MR imaging marker of neurodegeneration in MS. Available quantification algorithms perform either direct (segmentation-based techniques) or indirect (registration-based techniques) measurements. Because there is no reference standard technique, the assessment of their accuracy and reliability remains a difficult goal. Therefore, the purpose of this work was to assess the robustness of 7 different postprocessing algorithms applied to images acquired from different MR imaging systems.

MATERIALS AND METHODS: Nine patients with MS were followed longitudinally over 1 year (3 time points) on two 1.5T MR imaging systems. Brain volume change measures were assessed using 7 segmentation algorithms: a segmentation-classification algorithm, FreeSurfer, BBSI, KN-BSI, SIENA, SIENAX, and JI algorithm.

RESULTS: Intersite variability showed that segmentation-based techniques and SIENAX provided large and heterogeneous values of brain volume changes. A Bland-Altman analysis showed a mean difference of 1.8%, 0.07%, and 0.79% between the 2 sites, and a wide length agreement interval of 11.66%, 7.92%, and 11.94% for the segmentation-classification algorithm, FreeSurfer, and SIENAX, respectively. In contrast, registration-based algorithms showed better reproducibility, with a low mean difference of 0.45% for BBSI, KN-BSI and JI, and a mean length agreement interval of 1.55%. If SIENA obtained a lower mean difference of 0.12%, its agreement interval of 3.29% was wider.

CONCLUSIONS: If brain atrophy estimation remains an open issue, future investigations of the accuracy and reliability of the brain volume quantification algorithms are needed to measure the slow and small brain volume changes occurring in MS.

ABBREVIATIONS:

BBSI
brain boundary shift integral
GM
gray matter
JI
Jacobian integration
KN-BSI
robust boundary shift integral
SEM
standard error of measurement
TBM
tensor-based morphometry

Conventional MR imaging has proved to be the best way of monitoring inflammation in MS. However, it lacks a reliable evaluation of the neurodegenerative component of the disease. In the last decade, conventional MR-imaging–based methods have been developed to provide sensitive and reproducible assessments of brain volume loss that have increased the interest in brain atrophy as an index of accurate assessment and monitoring of MS progression.

Different approaches have been developed to assess brain volume loss. Several algorithms are available to perform its quantification, based either on direct or indirect measurements. Thus, they are classified as segmentation-based and registration-based techniques, respectively. Segmentation-based techniques1,2 are based on tissue classification (CSF, GM, and WM) in a semiautomated or automated way and provide brain volume measures at a given time. While semiautomated techniques are time-consuming and less reproducible, automated techniques are found to be less accurate.3 Segmentation-based techniques such as brain parenchymal fraction3,4 and brain to intracranial capacity ratio5 can be used for cross-sectional studies by including normalization for head size. FreeSurfer (http://surfer.nmr.mgh.harvard.edu), one of the most recent automatic segmentation-based algorithms, allows the measurement of specific brain anatomic regions.6

Registration-based methods have been developed to improve longitudinal evaluations. They include brain edge motion analysis for BBSI, KN-BSI,7,8 SIENA (http://www.fmrib.ox.ac.uk/fsl),9,10 voxel-based statistical analysis for voxel-based morphometry, statistical parametric mapping,11 and local Jacobian determinant analysis after nonlinear matching between coregistered images.12⇓–14

However, brain volume loss estimations are affected by physiopathologic factors such as dehydration, inflammation, or steroid therapy15⇓⇓⇓⇓⇓⇓⇓⇓–24 and by technical factors such as MR imaging contrast quality, signal-to-noise ratio, upgrades of the MR imaging system, field inhomogeneity, and geometric distortions related to gradients.25⇓⇓⇓–29 Brain volume loss estimation also depends on the reliability of the postprocessing algorithms used. As no reference standard technique is available, the robustness of each algorithm is thus difficult to estimate. Recently, simulated brain volume loss measurements became available and provide data of known atrophy.12,14,30⇓–32 Despite extensive use in epidemiologic series or clinical trials, validation of different techniques remains a major problem.

In this article, our objective was to compare the reliability of brain volume change measurements across 2 MR imaging sites of acquisition while using 7 different quantification algorithms. The algorithms used for this comparison are a segmentation-classification algorithm, FreeSurfer, BBSI, KN- BSI, SIENA, SIENAX (http://www.fmrib.ox.ac.uk/fsl), and a JI algorithm.

Materials and Methods

Patients

Nine patients were selected from a large cohort of 90 patients with MS participating in a longitudinal, biannual clinical and MR imaging follow-up. Patients were recruited from the MS clinic at the Neurologic Hospital, Lyon, France. Inclusion criteria were definite MS, according to the McDonald et al criteria,33 and age 18–50 years. All clinical subtypes were represented: clinically isolated syndromes, relapsing-remitting MS, secondary-progressive MS, and primary-progressive MS. Exclusion criteria were pregnancy at inclusion and any contraindication to a MR imaging examination. Immunoactive treatments were allowed. All patients gave written informed consent to participate in the longitudinal follow-up study, which was approved by the local ethics committee. The 9 patients (2 women and 7 men; 3 relapse-remitting MS, 3 secondary-progressive MS and 3 primary-progressive MS) were selected because they underwent MR imaging examinations on 2 different MR imaging systems at 3 separate time points over 1 year of follow-up—at inclusion and at 6 and 12 months. Mean age at the inclusion was 41 years (range, 27–46 years), mean disease duration was 8 years (range, 2–18 years), and mean Expanded Disability Status Scale score was 4.5 (range, 2–6.5). Six patients received an immunoactive treatment during the period of observation.

MR Imaging Follow-Up

MR imaging examinations were performed at the 3 evaluations over a period of 1 year at each radiologic site. Images were acquired at least 1 month after a clinical relapse and/or a course of steroids. At each time point, 2 MR imaging scans were consecutively performed on 2 different systems: a 1.5T Intera (Philips Healthcare, Best, The Netherlands), located within the radiology department at the Neurologic Hospital of Lyon (hereafter, MRI1), and a 1.5T Sonata system (Siemens, Erlangen, Germany), located in the MR imaging department of CERMEP-Imagerie du vivant (hereafter, MRI2). The MR imaging protocol consisted of the acquisition of 3D millimetric T1 images without gadolinium injection using a 3D T1 fast-field echo sequence (TR, 7.56 ms; TE, 3.69 ms; matrix, 256 × 256; section thickness, 2 mm; reconstructed in 1 mm; 180 sections; scan time 7 minutes and 10 seconds) with MRI1, and a MPRAGE 3D T1 (inversion recovery–turbo-flash; TR, 1970 ms; TE, 3.93 ms; TI, 1100 ms; matrix, 256 × 256; section thickness, 1 mm; integrated parallel acquisition techniques, 2, 176 sections; scan time 4 minutes and 37 seconds) with MRI2. The overall image count obtained in this follow-up was 27 acquisitions on each MR imaging system.

Image Analysis

Seven postprocessing software programs were assessed, including 2 segmentation-based algorithms—a Bayesian tissue classification algorithm and FreeSurfer—and 5 registration-based algorithms: BBSI, KN-BSI, SIENA, SIENAX, and JI. Image analysis was performed randomly on the 27 pairs of images, blinded to patient clinical characteristics and clinical status.

Preprocessing

With the exception of SIENA, SIENAX, and FreeSurfer, which have their own preprocessing pipeline as part of the processing package, preprocessing steps consisted of the following: automatic extraction of the intracranial cavity mask at baseline; correction of intensity inhomogeneities using the N3 technique34 for all time points; rigid registration of follow-up scans on the baseline scan, by optimizing mutual information to correct for rotations and translations inside the magnet; and differential bias field correction35 to correct for differences in intensity inhomogeneity artifacts.

Markov Random Field–Based Tissue Classification

The unsupervised and adaptive classification algorithm used for automatic segmentation of brain tissue into CSF, GM, and WM is detailed elsewhere.36 The algorithm allows unsupervised classification of the data in any number of tissue classes. It uses a statistical model that includes Bayesian distributions for brain tissue intensities and Gibbs Random Fields–based spatial contiguity constraints. Unsupervision is derived from the data and adaptivity is achieved through the variation of the size of the neighborhoods used for the estimation of the intensity characteristics. This allows slow variations of signal intensity in space to account for MR imaging intensity nonuniformity. Each scan was independently processed and reviewed by an experienced neurologist. Manual editing was performed to correct for classification errors.

FreeSurfer

The volume-based subcortical segmentation and surface-based cortical reconstruction on 3D T1-weighted images was performed using FreeSurfer software. The volume-based stream is an automated process that resections 3D spoiled gradient-echo T1WI to approximately 1 mm3 voxel size for whole-brain tissue segmentation and specific subcortical region tissue volumes. The stream consists of 5 different stages.6 Initially, the MR imaging volumes are registered to the Talairach space and the output images are intensity normalized. At the next stage, the skull is automatically stripped off the 3D anatomic dataset by a hybrid method that uses both watershed algorithms and deformable surface models. After skull stripping, the output brain mask is labeled using a probabilistic atlas, where each voxel in the normalized brain mask volume is assigned 1 of the following labels: cerebral white matter, cerebral cortex, lateral ventricle, inferior lateral ventricle, cerebellum white matter, cerebellum cortex, thalamus, caudate, putamen, pallidum, hippocampus, amygdala, accumbens area, third ventricle, fourth ventricle, brain stem, and CSF. For this study, FreeSurfer was run automatically with the default parameters.

BBSI and KN-BSI

BBSI is a semiautomated measure of global cerebral atrophy rates from serial MR imaging images.7,37 The BBSI estimates the changes in cerebral volume using differences in voxel intensities between 2 serial MR imaging volume scans at the boundary region of the brain. BBSI assumes that differences between registered scans near the boundaries of cerebral structures are associated solely with the shifting of adjacent tissue. To compute the BBSI, the baseline and follow-up whole-brain regions are first delineated, using the classification algorithm previously described. A boundary and internal regions are obtained from the pair of whole brain regions. Then, intensities of the baseline and follow-up images are normalized by dividing these by the mean intensity inside the internal regions, respectively. Finally, the BBSI is computed within the boundary region using a prespecified manually chosen intensity window (I1/I2 = 0.65/0.45 for site 1 and 0.50/0.70 for site 2). KN-BSI was proposed to improve the robustness and reproducibility of boundary shift integral brain atrophy measurements in multisite image studies.38 There are 2 main improvements of the boundary shift integral: a specific intensity normalization is achieved by using K-means clustering of brain tissues and linear regression between their mean intensities. The intensity window is automatically computed from K-means clustering results, independently for each image.

SIENA

SIENA gives a fully automated analysis of whole-brain atrophy.9,10 It includes 2 stages of segmentation: Brain Extraction Tool and the Automated Segmentation Tool from the FMRIB Software Library (http://www.fmrib.ox.ac.uk/fsl). Brain Extraction Tool makes a histogram of intensities and then transforms the image into a binary mask (object/background), which defines the center of gravity.10 The 2 brain images are registered to each other using the skull images.39,40 Then, FMRIB Automated Segmentation Tool classifies voxels within the brain mask of Brain Extraction Tool, in at least 3 or 4 classes, according to their intensities, to distinguish CSF from brain parenchyma and background, with or without GM-WM separation.41 The resulting mask corresponds to brain parenchyma. Edge displacement between the 2 time points is then estimated by aligning the peaks of the spatial derivatives of the intensity profiles of both images, to subvoxel accuracy. Finally, the mean edge displacement is converted into a global estimate of percentage brain volume change between the 2 time points. Full automation limits the interactivity of the software. Errors during 1 of the processing steps require a restart of the whole procedure. For this study, SIENA was run with no manual correction and with the default parameters.

SIENAX

SIENAX gives a fully automated quantification of brain volume with a normalization for head size.10 The algorithm extracts the skull and brain masks from 1 time-point image, which are then registered to the Montreal Neurological Institute 152 space. Images are thereby normalized for head size using the skull images to determine the registration scaling. Tissue segmentation is then realized to calculate the brain and gray and white matter volumes. The outputs provide normalized and un-normalized volumes. For this study, SIENAX was run automatically with the default parameters.

3D JI Using Tensor-Based Morphometry

TBM identifies regional structural differences, after nonlinear warping, between an image and a common anatomic template, for cross-sectional analysis, or between 2 images of the same subject, for longitudinal analysis.42⇓–44 A Jacobian matrix (referred to as “J”) is obtained for each voxel by taking gradient derivatives of the deformation field resulting from the nonlinear warping.45 The determinant of these Jacobian matrices (J) represent an expansion (J > 1) or a contraction (J < 1) of each voxel after nonlinear warping, and can be represented in 3D. These voxel changes, or Jacobian determinant changes, are then integrated over the brain region to obtain an atrophy estimation of that region. TBM requires little manual interaction and is recognized as a favorable technique for large-scale brain studies.46 The TBM techniques differ in the nonlinear registration algorithms used for the warping.47 In this study, the nonlinear registration technique detailed in Vemuri et al48 is used for warping, and brain atrophy is estimated by comparing each follow-up scan to the baseline scan. The expansion of the total intracranial CSF is quantified as an indirect marker of the brain parenchyma volume loss in order to limit any influence of the inflammatory activity within the brain parenchyma.

Statistical Analysis

The statistical analysis compared the results of brain volume loss obtained from each site. Intersite variability was measured by comparing the results obtained by each technique in both sites, MRI1 and MRI2. Comparisons were performed using first the Wilcoxon signed rank for the comparison of the mean percentage of brain volume loss, and then a Spearman correlation coefficient was established and tested. A Bland-Altman analysis was also performed. Finally, the SEM was estimated as: Embedded Image

Results

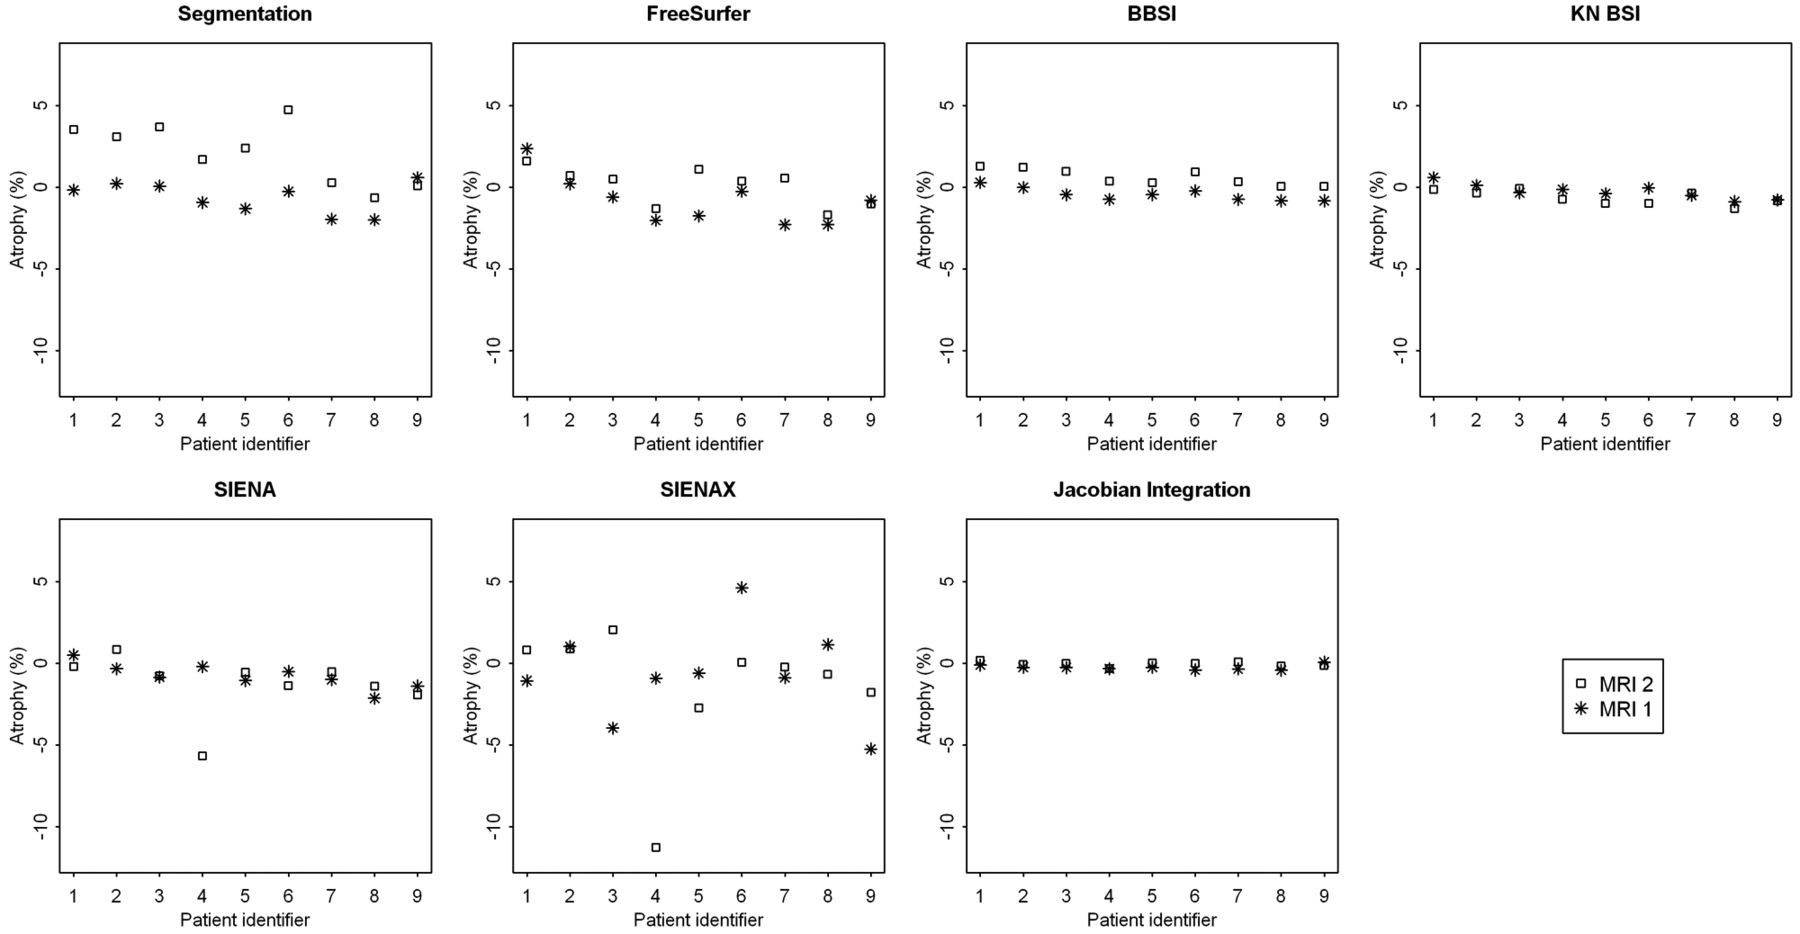
A description of the means, standard deviations, and median percentages of brain volume changes between the 7 techniques is presented for each time point and each site, MRI1 (Table 1) and MRI2 (Table 2). Fig 1 represents the changes in brain volume obtained in both sites from the 7 techniques for each patient. The results showed significant differences in percentages between the 2 sites for segmentation-based techniques, such as the segmentation-classification algorithm and FreeSurfer. In contrast, the BBSI, KN-BSI, and JI methods provided fairly stable results between the 2 sites. The results were also similar for SIENA, except for 1 patient (number 4) who presented a wide range of differences. SIENAX provided variable and heterogeneous results between the 2 sites.

Fig 1.
  • Download figure
  • Open in new tab
  • Download powerpoint
Fig 1.

Representation of the percentages of brain volume change at 12 months obtained between sites MRI1 (*) and MRI2 (□amp;) by each of the 7 techniques: the segmentation-classification algorithm, FreeSurfer, BBSI, KN-BSI, SIENA, SIENAX, and JI.

View this table:
  • View inline
  • View popup
Table 1:

Description of the mean, standard deviation, and median percentages of atrophy between the 7 techniques at 6 and 12 months on MRI1

View this table:
  • View inline
  • View popup
Table 2:

Description of the mean, standard deviation and median percentages of atrophy between the 7 techniques at 6 and 12 months on MRI2

The Wilcoxon signed rank test used to compare the results obtained from the 2 sites showed no significant differences between the 7 techniques. The Spearman correlation coefficients were not significant. However, the Bland-Altman analysis showed that segmentation-based techniques and SIENAX provided greater mean differences and wider agreement intervals than registration-based techniques (Fig 2 ). The segmentation-classification algorithm obtained a mean difference of 1.80% between the 2 sites, with a large length agreement interval of 11.66%. FreeSurfer provided a smaller mean difference, close to 0.07%, but kept a large length agreement interval of 7.92%. In contrast, registration-based techniques such as BBSI, KN-BSI, and JI algorithms were less sensitive to MR imaging system changes. The mean difference for these 3 techniques was equal to 0.45%, with a mean length agreement interval of 1.55%. SIENA obtained a reduced mean difference of 0.12% but a wider agreement interval of 3.29%. As estimated by the SEM and the delta values, the variability was larger for segmentation-based techniques and lower for registration-based techniques (Table 3).

Fig 2.
  • Download figure
  • Open in new tab
  • Download powerpoint
Fig 2.

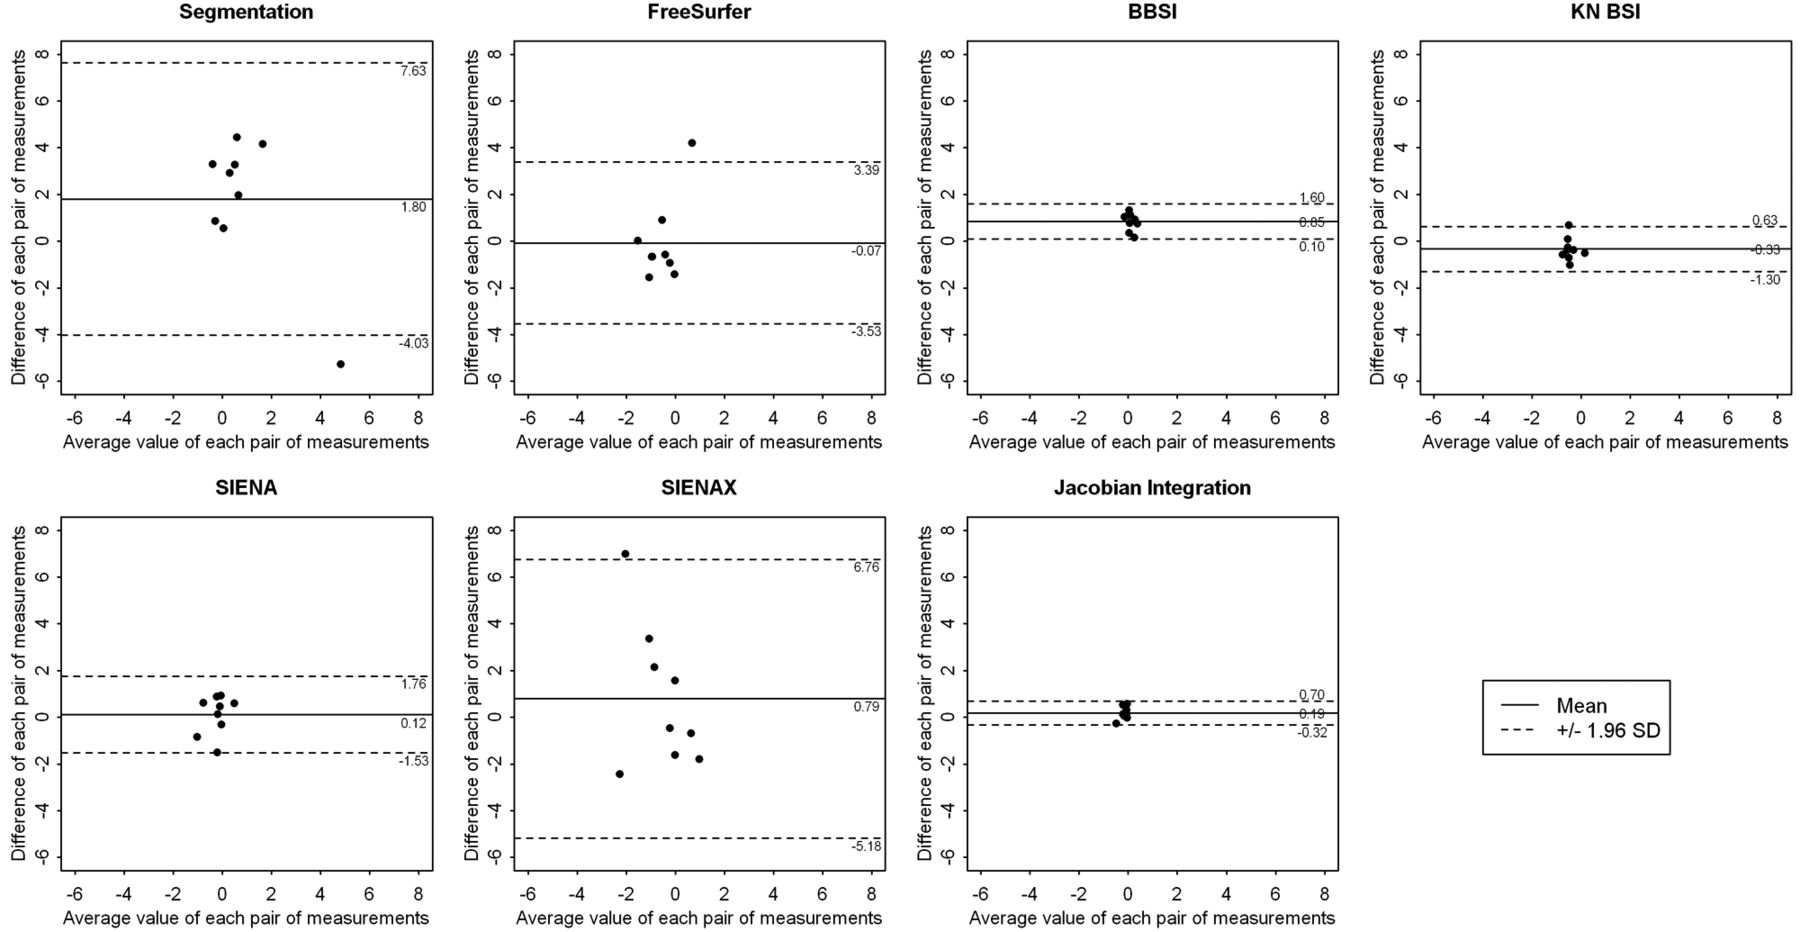
Representation of the results of the Bland-Altman analysis for comparing the results obtained between site MRI1 and MRI2 at 6 months by each of the 7 techniques: the segmentation-classification algorithm, FreeSurfer, BBSI, KN-BSI, SIENA, SIENAX, and JI. These graphics represent the difference between the 2 sites, against the average value, of each pair of measurements. A continuous line and 2 dotted lines were added to each scatterplot and depict the mean difference between the 2 sites and the limits of agreement, respectively.

View this table:
  • View inline
  • View popup
Table 3:

Bland-Altman analysis and standard error of measurement and corresponding delta values for the results obtained by the seven techniques between the 2 sites MRI1 and MRI2

Discussion

As atrophy is a slow process leading to small changes, the techniques used for its quantification have to be accurate and reliable.49 In this work, we performed a comparative study of brain volume changes measured on 2 MR imaging systems, across 3 time points over 1 year, to evaluate the intersite variability and robustness. The acquisitions were performed on 9 MS patients and postprocessed by 7 different methods. The main findings showed that segmentation-based techniques provided larger and more heterogeneous values of brain volume changes than registration-based techniques. Segmentation-based algorithms used in a semiautomatic way (with manual correction) are theoretically considered as reference standard techniques, as they provide data for each brain volume measurement from segmented masks validated by an observer. However, due to necessary manual corrections, these algorithms are time consuming and less reproducible. Thus, automatic segmentation-based algorithms are preferred.50 The most recent automatic segmentation algorithm is FreeSurfer, which seemed more reliable than the classification algorithm used in this work. Nevertheless, segmentation-based algorithms are influenced by the quality of the acquisitions. BBSI, KN-BSI, JI, and, to a lesser extent, SIENA algorithms were less sensitive to MR imaging changes. The mean difference for BBSI, KN-BSI and JI was close to 0.45% and for SIENA was 0.12%. Mean length agreement intervals were, respectively, 1.55% for BBSI, KN-BSI and JI and 3.29% for SIENA. This is probably related to fewer errors induced by the postprocessing based on registration. Otherwise, the results obtained by SIENAX were more heterogeneous and discordant, confirming that SIENAX should be reserved for cross-sectional studies.

No matter which algorithm of quantification is used, several factors of variability may interfere with the evaluation of brain volume loss at a given time. Significant physiologic changes related to age and state of hydration15,28,51 can lead to amplitude of variation up to 0.70% of the brain volume.16,17 In MS, inflammatory activity corresponding to the occurrence of acute lesions transiently increases brain volume.18 At the opposite end, treatments with high doses of corticosteroids or disease-modifying treatments may significantly and temporarily reduce brain volume.19⇓⇓⇓–23,52 These physiopathologic factors have a greater impact than the variations cause by scan–rescan.17,53 In this study, these factors may not have influenced the results, as each patient was explored with each MR imaging system on the same day, under the assumption that changes caused by physiopathologic processes are not likely to occur during that time. Acquisition-related factors may also affect automated quantitative analysis results and lead to an incorrect quantification.25 Within the same scanner platform, upgrades do not significantly modify the results, but differences of field strength may introduce a slight bias.27,28 However, in this study, the 2 systems were not upgraded and the B0 fields were the same. In addition, inhomogeneity of the B1 field can affect the reliability of tissue segmentation, as it creates image intensity distortions. However, recent studies using FreeSurfer software showed no significant changes when using or not using a correction of B1 image intensity inhomogeneities.27,32 Patient positioning (Z-positioning) has an effect on morphometric analyses in within-site or multisite evaluations.26,29 It increases the mean absolute main error of SIENA from 0.17% to 0.40%.26 The authors propose a correction for the gradient distortion, which reduced this mean absolute error to 0.15%.26 The combination of datasets obtained from different manufacturer MR imaging platforms introduces a bias that should be considered in multisite studies.27,28

Conclusions

In this article, we evaluated the impact of changing MR imaging systems on the results of brain volume quantification and assessed the robustness of 7 postprocessing algorithms. Intersite variability showed that segmentation-based techniques provided larger and more heterogeneous results than registration-based techniques. Segmentation-based algorithms are influenced by the quality of the acquisitions, and their use in longitudinal studies might not be recommended because of their variability. In contrast, this study showed a better reproducibility of the registration-based algorithms, such as BBSI, KN-BSI, JI, and, to a lesser extent, SIENA, which provided lower and more homogeneous results. Quantification algorithms insensitive to the quality of MR imaging acquisitions should be preferred, as MR imaging acquisitions are usually performed on different MR imaging systems in clinical practice. Nevertheless, MR imaging acquisitions should be performed at the same MR imaging site in case of longitudinal follow-ups. In the future, new postprocessing algorithms using field inhomogeneity and geometric distortion correction are needed to improve the accuracy of brain volume change quantification.

Acknowledgments

The authors would like to express their gratitude to the staff of CERMEP-Imagerie du Vivant for their assistance in the acquisition of the data. We are grateful to Dr. Salem Hannoun for his help in preparing the manuscript and useful comments.

Footnotes

  • This research was sponsored by the French government grant PHRC 2004, referenced 2003.338 and entitled “Evaluation de l'atrophie cérébrale en IRM comme marqueur individuel de neurodégénérescence progressive du malade atteint de SEP,” and by the ARSEP Foundation (Fondation pour l'Aide à la Recherche sur la Sclérose en Plaques). This project was also supported by a public grant from the French Agence Nationale de la Recherche within the context of the Investments for the Future program, referenced ANR-10-COHO-002 and entitled “Observatoire Français de la sclérose en plaques” (OFSEP).

  • Disclosures: Françoise Durand-Dubief—RELATED: Grant: PHRC (Programme Hospitalier de Recherche Clinique) Régional 2004.* Sandra Vukusic—UNRELATED: Board Membership: Merck-Serono, Biogen-Idec, Sanofi-Aventis, Teva Pharma, Bayer, Novartis; Consultancy: Merck-Serono, Biogen-Idec, Sanofi-Aventis, Teva Pharma, Bayer, Novartis; Grants/Grants Pending: Merck-Serono, Biogen-Idec, Sanofi-Aventis, Teva Pharma, Bayer, Novartis; Payment for Lectures (including service on speakers bureaus): Merck-Serono, Biogen-Idec, Sanofi-Aventis, Teva Pharma, Bayer, Novartis; Payment for Development of Educational Presentations: Biogen-Idec, Novartis; Travel/Accommodations/Meeting Expenses Unrelated to Activities Listed: Merck-Serono, Biogen-Idec, Sanofi-Aventis, Teva Pharma, Bayer, Novartis. Christian Confavreux—UNRELATED: Board Membership: Biogen-Idec, Genzyme, Novartis, Sanofi-Aventis, Teva Pharma, UCB Pharma; Consultancy: Biogen Dompé, Biogen-Idec, Gemacbio, Genzyme, Hertie Foundation, Novartis, Sanofi-Aventis, Teva Pharma, UCB Pharma; Grants/Grants Pending: Bayer Schering,* Biogen-Idec,* Merck-Serono,* Novartis,* Sanofi-Aventis,* Teva Pharma; Payment for Lectures (including service on speakers bureaus): Bayer Schering, Biog-Idec, Merck-Serono, Novartis, Sanofi-Aventis, Teva Pharma; Royalties: Elsevier, Comments: McAlpine's Multiple Sclerosis, Edition 4. (*Money paid to institution)

Indicates open access to non-subscribers at www.ajnr.org

References

  1. 1.↵
    1. Filippi M,
    2. Mastronardo G,
    3. Rocca MA,
    4. et al
    . Quantitative volumetric analysis of brain magnetic resonance imaging from patients with multiple sclerosis. J Neurol Sci 1998;158:148–53
    CrossRefPubMed
  2. 2.↵
    1. Simon JH,
    2. Jacobs LD,
    3. Campion MK,
    4. et al
    . A longitudinal study of brain atrophy in relapsing multiple sclerosis: the Multiple Sclerosis Collaborative Research Group (MSCRG). Neurology 1999;53:139–48
    Abstract/FREE Full Text
  3. 3.↵
    1. Horsfield MA,
    2. Rovaris M,
    3. Rocca MA,
    4. et al
    . Whole-brain atrophy in multiple sclerosis measured by two segmentation processes from various MRI sequences. J Neurol Sci 2003;216:169–77
    CrossRefPubMed
  4. 4.↵
    1. Sharma J,
    2. Sanfilipo MP,
    3. Benedict RH,
    4. et al
    . Whole-brain atrophy in multiple sclerosis measured by automated versus semiautomated MR imaging segmentation. AJNR Am J Neuroradiol 2004;25:985–96
    Abstract/FREE Full Text
  5. 5.↵
    1. Collins DL,
    2. Montagnat J,
    3. Zijdenbos AP,
    4. et al
    . Automated estimation of brain volume in multiple sclerosis with BICCR. Lect Notes Comput Sci 2001;2082:141–47
    CrossRef
  6. 6.↵
    1. Fischl B,
    2. Salat DH,
    3. Busa E,
    4. et al
    . Whole brain segmentation: automated labeling of neuroanatomical structures in human brain. Neuron 2002;33:341–55
    CrossRefPubMed
  7. 7.↵
    1. Freeborough PA,
    2. Fox NC.
    . The boundary shift integral: an accurate and robust measure of cerebral volume changes from registered repeat MRI. IEEE Trans Med Imaging 1997;16:623–29
    CrossRefPubMed
  8. 8.↵
    1. Freeborough PA,
    2. Fox NC,
    3. Kitney RI.
    . Interactive algorithms for the segmentation and quantitation of 3-D MRI brain scans. Comput Methods Programs Biomed 1997;53:15–25
    CrossRefPubMed
  9. 9.↵
    1. Smith SM,
    2. De Stefano N,
    3. Jenkinson M,
    4. et al
    . Normalized accurate measurement of longitudinal brain change. J Comput Assist Tomogr 2001;25:466–75
    CrossRefPubMed
  10. 10.↵
    1. Smith SM.
    . Fast robust automated brain extraction. Hum Brain Mapp 2002;17:143–55
    CrossRefPubMed
  11. 11.↵
    1. Ashburner J,
    2. Friston KJ.
    . Voxel-based morphometry—the methods. Neuroimage 2000;11:805–21
    CrossRefPubMed
  12. 12.↵
    1. Camara O,
    2. Schnabel JA,
    3. Ridgway GR,
    4. et al
    . Accuracy assessment of global and local atrophy measurement techniques with realistic simulated longitudinal Alzheimer's disease images. Neuroimage 2008;42:696–709
    CrossRefPubMed
  13. 13.↵
    1. Boyes RG,
    2. Rueckert D,
    3. Aljabar P,
    4. et al
    . Cerebral atrophy measurements using Jacobian integration: comparison with the boundary shift integral. Neuroimage 2006;32:159–69
    CrossRefPubMed
  14. 14.↵
    1. Camara O,
    2. Schweiger M,
    3. Scahill R,
    4. et al
    . Phenomenological model of diffuse global and regional atrophy using finite-element methods. IEEE Trans Med Imaging 2006;25:1417–30
    CrossRefPubMed
  15. 15.↵
    1. Cotton F,
    2. Weiner HL,
    3. Jolesz FA,
    4. et al
    . MRI contrast uptake in new lesions in relapsing–remitting multiple sclerosis followed at weekly intervals. Neurology 2003;30:640–46
  16. 16.↵
    1. Duning T,
    2. Kloska S,
    3. Streinstrater O,
    4. et al
    . Dehydration confounds the assessment of brain atrophy. Neurology 2005;64:548–50
    Abstract/FREE Full Text
  17. 17.↵
    1. Sampat MP,
    2. Healy BC,
    3. Meier DS,
    4. et al
    . Disease modelling in multiple sclerosis: assessment and quantification of sources of variability in brain parenchymal fraction measurements. Neuroimage 2010;52:1367–73
    CrossRefPubMed
  18. 18.↵
    1. Dalton CM,
    2. Chard DT,
    3. Davies GR,
    4. et al
    . Early development of multiple sclerosis is associated with progressive grey matter atrophy in patients presenting with clinically isolated syndromes. Brain 2004;127:1101–07
    Abstract/FREE Full Text
  19. 19.↵
    1. Gordon N.
    . Apparent cerebral atrophy in patients on treatment with steroids. Dev Med Child Neurol 1980;22:502–06
    PubMed
  20. 20.↵
    1. Hoogervorst EL,
    2. Polman CH,
    3. Barkhof F.
    . Cerebral volume changes in multiple sclerosis patients treated with high-dose intravenous methylprednisolone. Mult Scler 2002;8:415–19
    Abstract/FREE Full Text
  21. 21.↵
    1. Rao AB,
    2. Richert N,
    3. Howard T,
    4. et al
    . Methylprednisolone effect on brain volume and enhancing lesions in MS before and during IFNbeta-1b. Neurology 2002;59:688–94
    Abstract/FREE Full Text
  22. 22.↵
    1. Fox RJ,
    2. Fisher E,
    3. Tkach J,
    4. et al
    . Brain atrophy and magnetization transfer ratio following methylprednisolone in multiple sclerosis: short-term changes and long-term implications. Mult Scler 2005;11:140–45
    Abstract/FREE Full Text
  23. 23.↵
    1. Meier D,
    2. Weiner H,
    3. Guttmann C.
    . MR imaging intensity modelling of damage and repair in multiple sclerosis: relationship of short-term lesion recovery to progression and disability. AJNR Am J Neuroradiol 2007;28:1956–63
    Abstract/FREE Full Text
  24. 24.↵
    1. Pelletier D,
    2. Garrison K,
    3. Henry R.
    . Measurement of whole-brain atrophy in multiple sclerosis. J Neuroimaging 2004;14:11S–19S
    CrossRefPubMed
  25. 25.↵
    1. Bellon EM,
    2. Haacke EM,
    3. Coleman PE,
    4. et al
    . MR artifacts: a review. AJR Am J Roentgenol 1986;147:1271–81
    CrossRefPubMed
  26. 26.↵
    1. Caramanos Z,
    2. Fonov VS,
    3. Francis SJ,
    4. et al
    . Gradient distortion in MRI: characterizing and correcting for their effects on SIENA-generated measures of brain volume change. Neuroimage 2010;49:1601–11
    CrossRefPubMed
  27. 27.↵
    1. Jovicich J,
    2. Czanner S,
    3. Han X,
    4. et al
    . MRI-derived measurements of human subcortical, ventricular and intracranial brain volumes: reliability effects of scan sessions, acquisition sequences, data analyses, scanner upgrade, scanner vendors and field strengths. Neuroimage 2009;46:177–92
    CrossRefPubMed
  28. 28.↵
    1. Han X,
    2. Jovicich J,
    3. Salat D,
    4. et al
    . Reliability of MRI-derived measurements of human cerebral cortical thickness: the effects of field strength, scanner upgrade and manufacturer. Neuroimage 2006;32:180–94
    CrossRefPubMed
  29. 29.↵
    1. Jovicich J,
    2. Czanner S,
    3. Greve D,
    4. et al
    . Reliability in multi-site structural MRI studies: effects of gradient non-linearity correction on phantom and human data. Neuroimage 2006;30:436–43
    CrossRefPubMed
  30. 30.↵
    1. Karaçali B,
    2. Davatzikos C.
    . Simulation of tissue atrophy using a topology preserving transformation model. IEEE Trans Med Imaging 2006;25:649–52
    CrossRefPubMed
  31. 31.↵
    1. Pieperhoff P,
    2. Sudmeyer M,
    3. Homke L,
    4. et al
    . Detection of structural changes of the human brain in longitudinally acquired MR images by deformation field morphometry: methodological analysis, validation and application. Neuroimage 2008;43:269–87
    CrossRefPubMed
  32. 32.↵
    1. Sharma S,
    2. Noblet V,
    3. Rousseau F,
    4. et al
    . Evaluation of brain atrophy estimation algorithms using simulated ground-truth data. Med Image Anal 2010;14:373–89
    CrossRefPubMed
  33. 33.↵
    1. McDonald WI,
    2. Comtston DAS,
    3. G Edan G,
    4. et al
    . Diagnostic criteria for MS: guidelines from the international panel on the diagnosis of MS. Ann Neurol 2001;50:121–27
    CrossRefPubMed
  34. 34.↵
    1. Sled JG,
    2. Zijdenbos AP,
    3. Evans ACA.
    . Nonparametric method for automatic correction of intensity nonuniformity in MRI data. IEEE Trans Med Imaging 1998;1:87–97
  35. 35.↵
    1. Boyes RG,
    2. Gunter JL,
    3. Frost C,
    4. et al
    . Intensity non-uniformity correction using N3 on 3-T scanners with multichannel phased array coils. Neuroimage 2008;39:1752–62
    CrossRefPubMed
  36. 36.↵
    1. Pachai C,
    2. Zhu YM,
    3. Guttmann C,
    4. et al
    . Unsupervised and adaptive segmentation of multispectral 3D magnetic resonance images of human brain: a generic approach. Int Conf Med Image Comput Comput Assist Interv 2001;4:1067–74
  37. 37.↵
    1. Fox NC,
    2. Freeborough PA.
    . Brain atrophy progression measured from registered serial MRI: validation and application to Alzheimer's disease. J Magn Reson Imaging 1997;7:1069–75
    PubMed
  38. 38.↵
    1. Leung KK,
    2. Clarkson MJ,
    3. Bartlett JW,
    4. et al
    . Robust atrophy rate measurement in Alzheimer's disease using multi-site serial MRI: tissue-specific intensity normalization and parameter selection. Neuroimage 2010;50:516–23
    CrossRefPubMed
  39. 39.↵
    1. Jenkinson M,
    2. Smith S.
    . A global optimisation method for robust affine registration of brain images. Med Image Anal 2001;36:143–56
  40. 40.↵
    1. Jenkinson M,
    2. Bannister P,
    3. Brady M,
    4. et al
    . Improved optimization for the robust and accurate linear registration and motion correction of brain images. Neuroimage 2002;17:824–41
  41. 41.↵
    1. Zhang Y,
    2. Brady M,
    3. Smith S.
    . Segmentation of brain MR images through a hidden Markov random field model and the expectation maximization algorithm. IEEE Trans Med Imaging 2001;20:45–57
    CrossRefPubMed
  42. 42.↵
    1. Christensen GE,
    2. Rabbitt RD,
    3. Miller MI.
    . Deformable templates using large deformation kinematics. IEEE Trans Med Imaging 1996;5:1435–47
  43. 43.↵
    1. Davatzikos C,
    2. Vaillant M,
    3. Resnick SM,
    4. et al
    . A computerized approach for morphological analysis of the corpus callosum. J Comput Assist Tomogr 1996;20:88–97
    CrossRefPubMed
  44. 44.↵
    1. Thompson PM,
    2. Giedd JN,
    3. Woods RP,
    4. et al
    . Growth patterns in the developing brain detected by using continuum mechanical tensor maps. Nature 2000;404:190–93
    CrossRefPubMed
  45. 45.↵
    1. Calmon G,
    2. Roberts N.
    . Automatic measurement of changes in brain volume on consecutive 3D MR images by segmentation propagation. Magn Reson Imaging 2000;18:439–53
    CrossRefPubMed
  46. 46.↵
    1. Hua X,
    2. Leow AD,
    3. Parikshak N,
    4. et al
    . Tensor-based morphometry as a neuroimaging biomarker for Alzheimer's disease: an MRI study of 676 AD, MCI, and normal subjects. Neuroimage 2008;43:458–69
    CrossRefPubMed
  47. 47.↵
    1. Klein A,
    2. Andersson J,
    3. Ardekani BA,
    4. et al
    . Evaluation of 14 nonlinear deformation algorithms applied to human brain MRI registration. Neuroimage 2009;46:786–802
    CrossRefPubMed
  48. 48.↵
    1. Vemuri BC,
    2. Ye J,
    3. Chen Y,
    4. et al
    . Image registration via level-set motion: applications to atlas-based segmentation. Med Image Anal 2003;7:1–20
    CrossRefPubMed
  49. 49.↵
    1. Wei X,
    2. Guttman CR,
    3. Warfeild SK,
    4. et al
    . Has your patient's multiple sclerosis lesion burden and brain atrophy actually changed? Mult Scler 2004;10:402–06
    Abstract/FREE Full Text
  50. 50.↵
    1. Jasperse B,
    2. Valsasina P,
    3. Neacsu V,
    4. et al
    . Intercenter agreement of brain atrophy measurement in multiple sclerosis patients using manually-edited SIENA and SIENAX. J Magn Reson Imaging 2007;26:881–85
    CrossRefPubMed
  51. 51.↵
    1. Dickerson BC,
    2. Fenstermacher E,
    3. Salat DH,
    4. et al
    . Detection of cortical thickness correlates of cognitive performance: reliability across MRI scan sessions, scanners, and field strengths. Neuroimage 2008;39:10–18
    CrossRefPubMed
  52. 52.↵
    1. Miller DH.
    . Biomarkers and surrogate outcomes in neurodegenerative disease: lessons from multiple sclerosis. Neuroradiology 2004;1:284–94
  53. 53.↵
    1. Bermel RA,
    2. Sharma J,
    3. Tjoa CW,
    4. et al
    . A semiautomated mesure of whole-brain atrophy in multiple sclerosis. J Neurol Sci 2003;208:57–65
    CrossRefPubMed
  • Received November 18, 2011.
  • Accepted after revision January 30, 2012.
  • © 2012 by American Journal of Neuroradiology
PreviousNext
Back to top

In this issue

American Journal of Neuroradiology: 33 (10)
American Journal of Neuroradiology
Vol. 33, Issue 10
1 Nov 2012
  • Table of Contents
  • Index by author
Advertisement
Print
Download PDF
Email Article

Thank you for your interest in spreading the word on American Journal of Neuroradiology.

NOTE: We only request your email address so that the person you are recommending the page to knows that you wanted them to see it, and that it is not junk mail. We do not capture any email address.

Enter multiple addresses on separate lines or separate them with commas.
Reliability of Longitudinal Brain Volume Loss Measurements between 2 Sites in Patients with Multiple Sclerosis: Comparison of 7 Quantification Techniques
(Your Name) has sent you a message from American Journal of Neuroradiology
(Your Name) thought you would like to see the American Journal of Neuroradiology web site.
CAPTCHA
This question is for testing whether or not you are a human visitor and to prevent automated spam submissions.
Cite this article
F. Durand-Dubief, B. Belaroussi, J.P. Armspach, M. Dufour, S. Roggerone, S. Vukusic, S. Hannoun, D. Sappey-Marinier, C. Confavreux, F. Cotton
Reliability of Longitudinal Brain Volume Loss Measurements between 2 Sites in Patients with Multiple Sclerosis: Comparison of 7 Quantification Techniques
American Journal of Neuroradiology Nov 2012, 33 (10) 1918-1924; DOI: 10.3174/ajnr.A3107

Citation Manager Formats

  • BibTeX
  • Bookends
  • EasyBib
  • EndNote (tagged)
  • EndNote 8 (xml)
  • Medlars
  • Mendeley
  • Papers
  • RefWorks Tagged
  • Ref Manager
  • RIS
  • Zotero
0 Responses
Respond to this article
Share
Bookmark this article
Reliability of Longitudinal Brain Volume Loss Measurements between 2 Sites in Patients with Multiple Sclerosis: Comparison of 7 Quantification Techniques
F. Durand-Dubief, B. Belaroussi, J.P. Armspach, M. Dufour, S. Roggerone, S. Vukusic, S. Hannoun, D. Sappey-Marinier, C. Confavreux, F. Cotton
American Journal of Neuroradiology Nov 2012, 33 (10) 1918-1924; DOI: 10.3174/ajnr.A3107
del.icio.us logo Twitter logo Facebook logo Mendeley logo
  • Tweet Widget
  • Facebook Like
  • Google Plus One
Purchase

Jump to section

  • Article
    • Abstract
    • ABBREVIATIONS:
    • Materials and Methods
    • Results
    • Discussion
    • Conclusions
    • Acknowledgments
    • Footnotes
    • References
  • Figures & Data
  • Info & Metrics
  • Responses
  • References
  • PDF

Related Articles

  • No related articles found.
  • PubMed
  • Google Scholar

Cited By...

  • Cortical Thin Patch Fraction Reflects Disease Burden in MS: The Mosaic Approach
  • Effects of Ibudilast on MRI Measures in the Phase 2 SPRINT-MS Study
  • Detection of Volume-Changing Metastatic Brain Tumors on Longitudinal MRI Using a Semiautomated Algorithm Based on the Jacobian Operator Field
  • Teriflunomide slows BVL in relapsing MS: A reanalysis of the TEMSO MRI data set using SIENA
  • Lipoic acid in secondary progressive MS: A randomized controlled pilot trial
  • Cortical Thickness of Native Tibetans in the Qinghai-Tibetan Plateau
  • Predictive value of early brain atrophy on response in patients treated with interferon {beta}
  • Qualitative and Quantitative Analysis of MR Imaging Findings in Patients with Middle Cerebral Artery Stroke Implanted with Mesenchymal Stem Cells
  • Crossref (74)
  • Google Scholar

This article has been cited by the following articles in journals that are participating in Crossref Cited-by Linking.

  • Effect of high-dose simvastatin on brain atrophy and disability in secondary progressive multiple sclerosis (MS-STAT): a randomised, placebo-controlled, phase 2 trial
    Jeremy Chataway, Nadine Schuerer, Ali Alsanousi, Dennis Chan, David MacManus, Kelvin Hunter, Val Anderson, Charles R M Bangham, Shona Clegg, Casper Nielsen, Nick C Fox, David Wilkie, Jennifer M Nicholas, Virginia L Calder, John Greenwood, Chris Frost, Richard Nicholas
    The Lancet 2014 383 9936
  • Clinical Relevance of Brain Volume Measures in Multiple Sclerosis
    Nicola De Stefano, Laura Airas, Nikolaos Grigoriadis, Heinrich P. Mattle, Jonathan O’Riordan, Celia Oreja-Guevara, Finn Sellebjerg, Bruno Stankoff, Agata Walczak, Heinz Wiendl, Bernd C. Kieseier
    CNS Drugs 2014 28 2
  • Lipoic acid in secondary progressive MS
    Rebecca Spain, Katherine Powers, Charles Murchison, Elizabeth Heriza, Kimberly Winges, Vijayshree Yadav, Michelle Cameron, Ed Kim, Fay Horak, Jack Simon, Dennis Bourdette
    Neurology Neuroimmunology & Neuroinflammation 2017 4 5
  • A comparison of FreeSurfer-generated data with and without manual intervention
    Christopher S. McCarthy, Avinash Ramprashad, Carlie Thompson, Jo-Anna Botti, Ioana L. Coman, Wendy R. Kates
    Frontiers in Neuroscience 2015 9
  • Repeatability and reproducibility of FreeSurfer, FSL-SIENAX and SPM brain volumetric measurements and the effect of lesion filling in multiple sclerosis
    Chunjie Guo, Daniel Ferreira, Katarina Fink, Eric Westman, Tobias Granberg
    European Radiology 2019 29 3
  • Recommendations to improve imaging and analysis of brain lesion load and atrophy in longitudinal studies of multiple sclerosis
    H. Vrenken, M. Jenkinson, M. A. Horsfield, M. Battaglini, R. A. van Schijndel, E. Rostrup, J. J. G. Geurts, E. Fisher, A. Zijdenbos, J. Ashburner, D. H. Miller, M. Filippi, F. Fazekas, M. Rovaris, A. Rovira, F. Barkhof, N. de Stefano
    Journal of Neurology 2013 260 10
  • Advances in spinal cord imaging in multiple sclerosis
    Marcello Moccia, Serena Ruggieri, Antonio Ianniello, Ahmed Toosy, Carlo Pozzilli, Olga Ciccarelli
    Therapeutic Advances in Neurological Disorders 2019 12
  • Intra- and interscanner variability of magnetic resonance imaging based volumetry in multiple sclerosis
    Viola Biberacher, Paul Schmidt, Anisha Keshavan, Christine C. Boucard, Ruthger Righart, Philipp Sämann, Christine Preibisch, Daniel Fröbel, Lilian Aly, Bernhard Hemmer, Claus Zimmer, Roland G. Henry, Mark Mühlau
    NeuroImage 2016 142
  • Reproducibility and variability of quantitative magnetic resonance imaging markers in cerebral small vessel disease
    François De Guio, Eric Jouvent, Geert Jan Biessels, Sandra E Black, Carol Brayne, Christopher Chen, Charlotte Cordonnier, Frank-Eric De Leeuw, Martin Dichgans, Fergus Doubal, Marco Duering, Carole Dufouil, Emrah Duzel, Franz Fazekas, Vladimir Hachinski, M Arfan Ikram, Jennifer Linn, Paul M Matthews, Bernard Mazoyer, Vincent Mok, Bo Norrving, John T O’Brien, Leonardo Pantoni, Stefan Ropele, Perminder Sachdev, Reinhold Schmidt, Sudha Seshadri, Eric E Smith, Luciano A Sposato, Blossom Stephan, Richard H Swartz, Christophe Tzourio, Mark van Buchem, Aad van der Lugt, Robert van Oostenbrugge, Meike W Vernooij, Anand Viswanathan, David Werring, Frank Wollenweber, Joanna M Wardlaw, Hugues Chabriat
    Journal of Cerebral Blood Flow & Metabolism 2016 36 8
  • Prevalence and characteristics of migraine in CADASIL
    Stephanie Guey, Jérôme Mawet, Dominique Hervé, Marco Duering, Ophelia Godin, Eric Jouvent, Christian Opherk, Nassira Alili, Martin Dichgans, Hugues Chabriat
    Cephalalgia 2016 36 11

More in this TOC Section

  • Usefulness of Quantitative Susceptibility Mapping for the Diagnosis of Parkinson Disease
  • White Matter Alterations in the Brains of Patients with Active, Remitted, and Cured Cushing Syndrome: A DTI Study
  • Qualitative and Quantitative Analysis of MR Imaging Findings in Patients with Middle Cerebral Artery Stroke Implanted with Mesenchymal Stem Cells
Show more BRAIN

Similar Articles

Advertisement

Indexed Content

  • Current Issue
  • Accepted Manuscripts
  • Article Preview
  • Past Issues
  • Editorials
  • Editor's Choice
  • Fellows' Journal Club
  • Letters to the Editor
  • Video Articles

Cases

  • Case Collection
  • Archive - Case of the Week
  • Archive - Case of the Month
  • Archive - Classic Case

Special Collections

  • AJNR Awards
  • ASNR Foundation Special Collection
  • Most Impactful AJNR Articles
  • Photon-Counting CT
  • Spinal CSF Leak Articles (Jan 2020-June 2024)

More from AJNR

  • Trainee Corner
  • Imaging Protocols
  • MRI Safety Corner

Multimedia

  • AJNR Podcasts
  • AJNR Scantastics

Resources

  • Turnaround Time
  • Submit a Manuscript
  • Submit a Video Article
  • Submit an eLetter to the Editor/Response
  • Manuscript Submission Guidelines
  • Statistical Tips
  • Fast Publishing of Accepted Manuscripts
  • Graphical Abstract Preparation
  • Imaging Protocol Submission
  • Evidence-Based Medicine Level Guide
  • Publishing Checklists
  • Author Policies
  • Become a Reviewer/Academy of Reviewers
  • News and Updates

About Us

  • About AJNR
  • Editorial Board
  • Editorial Board Alumni
  • Alerts
  • Permissions
  • Not an AJNR Subscriber? Join Now
  • Advertise with Us
  • Librarian Resources
  • Feedback
  • Terms and Conditions
  • AJNR Editorial Board Alumni

American Society of Neuroradiology

  • Not an ASNR Member? Join Now

© 2025 by the American Society of Neuroradiology All rights, including for text and data mining, AI training, and similar technologies, are reserved.
Print ISSN: 0195-6108 Online ISSN: 1936-959X

Powered by HighWire