
Abstract
BACKGROUND AND PURPOSE: Assessment of bone marrow is most commonly performed qualitatively in the spine or other large long bones. The craniofacial bones are less ideal for bone marrow analysis because of the relatively small bone marrow volume. Because patients with SCD often undergo repeated brain imaging to evaluate for cerebral vaso-occlusive disease, quantitative assessment of craniofacial bone marrow is a reasonable possibility in these patients. The purpose of this study was to investigate specific sickle cell disease changes in craniofacial bone marrow quantitatively by analyzing T1, T2, and secular-T2 relaxation times and volume with the use of quantitative MRI.
MATERIALS AND METHODS: Fourteen patients with SCD and 17 control subjects were imaged with the mixed TSE pulse sequence at 1.5T. The craniofacial bones were manually segmented by using 3D Slicer to generate bone marrow volumes and to provide T1, T2, and secular-T2 relaxation times.
RESULTS: All subjects exhibited a bimodal T1 histogram. In the SCD group, there was a decrease in amplitude in the first T1 peak and an increase in amplitude in the second T1 peak. The first T1 peak showed a significant increase in relaxation time compared with control subjects (P < .0001), whereas there was no significant difference in the second T1 peak. T2 and secular-T2 relaxation times were significantly shorter in the SCD group (T2, P < .0001; secular-T2, P < .0001). Increasing numbers of blood transfusions resulted in a decrease in T2 and secular-T2 times. Patients with SCD exhibited a larger bone marrow volume compared with control subjects, even after standardization.
CONCLUSIONS: Patients with SCD exhibited significant quantifiable changes in the craniofacial bone marrow because of failure of red-to-yellow marrow conversion and iron deposition that can be identified by qMRI relaxometry and volumetry. Both qMRI relaxometry and volumetry may be used as noninvasive tools for assessment of disease severity.
ABBREVIATIONS:
- qMRI
- quantitative MRI
- SCD
- sickle cell disease
Bone marrow consists of 2 major components: 1) hematopoietically active red marrow, which produces red blood cells, white blood cells, and platelet precursors and 2) hematopoietically inactive yellow marrow composed of fat cells. These 2 types of marrow differ in chemical composition, making MR imaging well-suited for analysis of bone marrow.1⇓–3 On T1-weighted imaging, hematopoietic red marrow shows low signal intensity relative to muscle, whereas fatty yellow marrow shows high signal intensity relative to muscle.4 Conventional MR imaging has been used to track the normal age-related conversion of red to yellow marrow over time in healthy subjects.5 Absence of marrow hyperintensity on T1-weighted MR images in adults can be identified qualitatively and is correlated with underlying systemic or hematologic disorders; these disorders often lead to red marrow reconversion to compensate for a chronically anemic state.3 Quantitative MRI, on the other hand, can more precisely quantify these changes and may help to expand our current knowledge about pathologic bone marrow conditions.
Sickle cell disease is a hereditary hemoglobinopathy characterized by hemolytic anemia and vaso-occlusive crises. It is known to have many deleterious effects on bone tissue, including infarction, osteomyelitis, marrow hyperplasia, and growth defects.6,7 SCD is known to induce a life-long persistence of hematopoietically active bone marrow as a result of increased red blood cell erythropoiesis.2,8
Qualitative assessment of bone marrow composition is most commonly performed in the spine or other large long bones that contain abundant bone marrow. The craniofacial bones are less ideal for qualitative bone marrow analysis because of the relatively small bone marrow volume. In patients with SCD, however, the marrow space of the craniofacial bones can be increased.7,9 Furthermore, patients with SCD often undergo repeated brain imaging to evaluate for cerebral vaso-occlusive disease, making quantitative assessment of craniofacial marrow composition a reasonable possibility in these patients.10,11 The purpose of this study is to quantify and characterize SCD-related changes in the craniofacial bone marrow by using qMRI relaxometry.
Materials and Methods
Subjects
This was a prospective study approved by our institutional review board. All subjects were consented in accordance with the National Institutes of Health and Health Insurance Portability and Accountability Acts guidelines. The study consisted of 14 patients with SCD (5 male, 9 female; age range, 20–43 years; mean age, 29 years) and 17 age-matched control patients (5 male, 12 female; age range, 23–49 years; mean age, 36 years). All patients were seen at a major university hospital and enrolled between August 2005 and February 2008. The control subjects were referred for brain MR imaging for various clinical reasons unrelated to pathologic bone marrow conditions. Participants were excluded if the chart review demonstrated evidence of a pathologic process affecting bone marrow or bone marrow volume (ie, diseases causing anemia other than SCD); if hematologic disorders (such as leukemia), malignancies, and/or HIV infection were present; or if imaging examinations were limited because of motion artifact.
MR Imaging
All subjects were scanned with the mixed TSE pulse sequence by using either of two 1.5T units at our hospital (Intera and Achieva; Philips Medical Systems of North America, Cleveland, Ohio). Key scanning parameters of this pulse sequence are listed in Table 1. For all scans, the quadrature-body and quadrature-head coils were used for radio-frequency excitation and signal detection, respectively.
Mixed TSE pulse sequence parameters
Mixed TSE is a fast, multisection quadruple time point qMRI pulse sequence that combines the principles of T1-weighting by inversion recovery and T2-weighting by multiecho sampling in a single acquisition. This sequence has 2 inversion times (TI1, TI2) and 2 effective echo times (TE1eff, TE2eff), thus generating 4 self-coregistered images per section, each with different levels of T1 and T2-weighting. These 4 acquired images can be processed to generate qMRI maps portraying the T1, T2, and secular-T2 distributions. Because the T1 and T2 maps are self-coregistered, the pure spin-spin component known as the secular component of T2 can be mapped by the relaxation rate formula 1/T2(sec) = 1/T2 − 1/2T1, in which the T1 contribution to T2, or nonsecular component of T2, is removed.12,13 Secular-T2 provides an additional qMRI parameter with a purer physical interpretation: it represents the decay component of the MR signal as caused solely by dephasing of transverse-state spins. Moreover, this spin-dephasing phenomenon is caused by the z-component of the time-dependent and randomly fluctuating microscopic magnetic field. This decay component is irreversible and does not involve energy exchange with the lattice. The method embodied in the equation above for removing the nonsecular or spin-lattice contribution to T2 is methodologically analogous, but conceptually different, from the method for removing the static spin dephasing caused by macroscopic magnetic field inhomogeneities as described by Ma and Wehrli.14
Image Processing
The use of T1, T2, and secular-T2 qMRI algorithms for image processing has been described in the recent literature.12,13 The craniofacial bone marrow was segmented manually by using 3D Slicer, a freely available, open-source software package for visualization, registration, segmentation, and quantification of medical data (version 2.6; http://www.slicer.org) under guidance by a neuroradiologist. Sample segmentation for the bone marrow is shown in Fig 1. The mandible was not included because it was not imaged in entirety on the MR studies performed. T1, T2, and secular-T2 relaxation time histograms were generated for all segmented bones (Fig 2) and modeled with Gaussian function by using the Mathcad 2001i processing environment (PTC, Needham, Massachusetts).

Craniofacial bone marrow segmentation. The bone marrow of a 24.5-year-old man with sickle cell disease (outlined in blue) has been segmented on the axial proton attenuation–weighted images with 3-mm thickness. Approximately 75 images were segmented per subject. After segmentation was complete, 3D Slicer was used to layer the images over each other to create a 3D model. Shown below are sagittal (bottom left) and coronal (bottom right) images cut through the fully segmented cranial bone marrow after 3D reconstruction. After segmentation, the image data were analyzed in Mathcad for T1, T2, and secular-T2 relaxation times and volume.
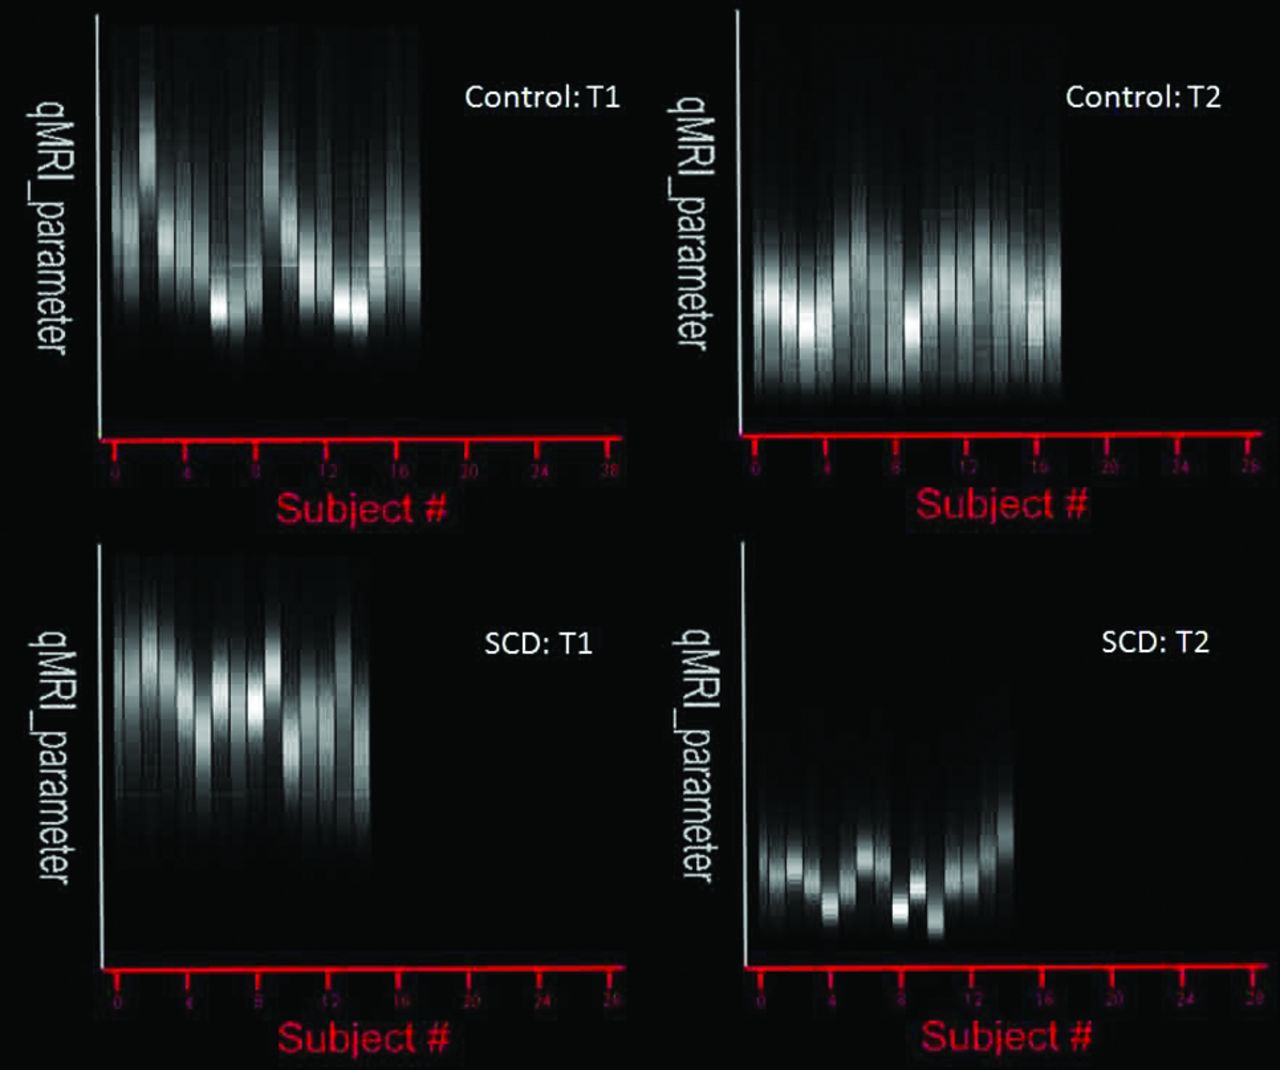
T1 and T2 histograms for craniofacial bone marrow. Mathcad-generated group histograms of craniofacial bone marrow T1 and T2 values for control subjects and subjects with SCD. Each vertical bar represents averaged relaxation times after segmentation. For T1, intersubject variability was high between groups, which prompted a more individualized analysis and breakdown of T1 peaks (Fig 3). For T2, the intersubject variability was minimal between the groups with more pronounced differences in relaxation times between subjects with SCD and control subjects.
In addition, analysis was performed to estimate cranial bone marrow volume. Volumes for segmented bones were calculated by multiplying the number of pixels of the segmented bone by the corresponding voxel volumes: 0.94 × 0.94 × 3.00 mm3. Because of patient variability in cranial bone marrow volume, a comparison was made with the entire intracranial vault volume, including gray and white matter, CSF, and meninges, producing a standardized volume ratio for each patient.
Chart Review
We reviewed all available electronic medical records of the subjects with SCD from the year 2000 up to the time of imaging (Centricity EMR; GE Healthcare, Milwaukee, Wisconsin). Medical records earlier than 2000 were not electronically available. The total volume of transfusions before the MR study was recorded. Exchange transfusions performed on 2 subjects with SCD were not included in this analysis because total blood volume is not expected to be significantly altered. We then categorized these subjects with SCD into 3 subgroups according to the total units of packed red blood cells received during the investigation period; mild, 0–2 U; moderate, 3–20 U; and severe disease, more than 20 U. If the medical records were unavailable, the subject was categorized into a separate subgroup.
Statistical Analysis
Dependent variables analyzed included the T1, T2, and secular-T2 peak values for the craniofacial bone marrow segments, as well as craniofacial bone marrow volume. After assessing distributional assumptions, comparison of mean values in subjects with and without SCD were made by using the independent samples t test. To control for potential confounding, further between-group comparisons of mean qMRI parameters were performed by using a linear regression model with fixed effects for SCD status, age, and categorized transfusion volume. Pearson correlation coefficients were calculated to estimate the association between transfusion volumes with each outcome measure in patients with SCD. Analyses were performed by using the R Project for Statistical Computing software (version 2.11.1; http://www.r-project.org/), and a 2-sided significance level of .05 was used throughout.
Results
Comparison of T1, T2, and Secular-T2
T1, T2, and secular-T2 peak values of subjects with and without SCD are shown in Table 2. Individual T1 histograms were primarily bimodal, showing individual spectral features for fatty (shorter T1) and hematopoietic marrow (longer T1) (Fig 3). However, ontrol subjects displayed higher amplitudes in the fatty marrow peak, whereas patients with SCD displayed higher amplitudes in the hematopoietic marrow peak (Fig 3).
Summary of peak relaxation times and volumesa

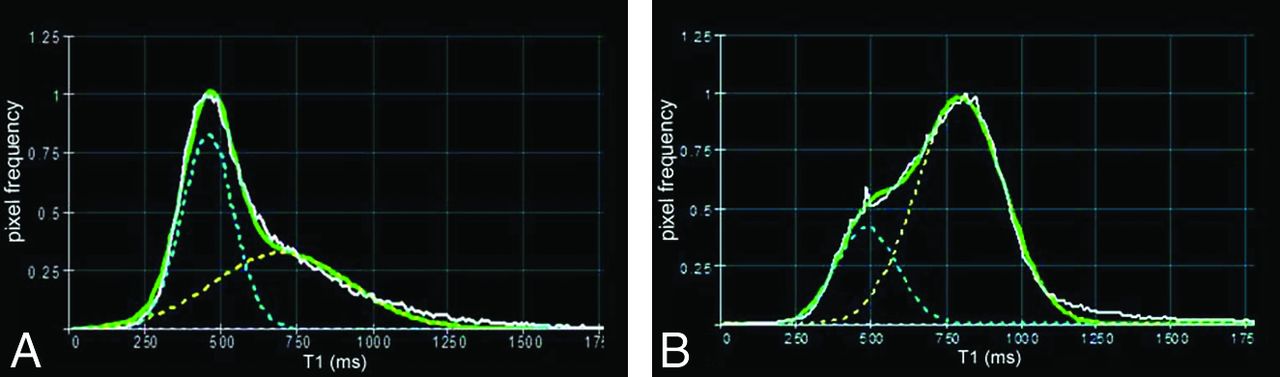
Individual histogram analysis of T1 peaks in a 32-year-old man without SCD (A) and a 42-year-old woman with SCD (B). A bimodal T1 peak distribution is seen in both cases, shown by dotted yellow and blue lines. Note the increased T1 shift seen in the subject with SCD and a reversal of T1 peak amplitudes compared with the control subject.
The first T1 peak position (T1 peak 1) showed an increase in signal intensity by 37.0% in subjects with SCD compared with control subjects (P < .0001); the second peak position (T1 peak 2) did not show a significant increase in peak shift. Plotted individual values are seen in Fig 4A, -B. Both T1 peaks of subjects with SCD showed an age-associated decreasing trend (T1 peak 1, P = .003; T1 peak 2, P = .02).

Comparison of peak 1 (A) and peak 2 (B) components of T1 histogram. A, Significant increase of T1 peak 1 relaxation time is noted in patients with SCD, whereas there is no significant difference in peak 2 (B). Both T1 peaks in subjects with SCD showed an age-associated decline (P = .003 and P = .02 for T1 peak 1 and T1 peak 2, respectively).
Both T2 and secular-T2 peaks of subjects with SCD showed significant shortening by 35.1% and 37.8%, respectively (T2, P < .0001; secular-T2, P < .0001). Plotted individual values are seen in Fig 5A (T2), -B (secular-T2). Age was not associated with either T2 or secular-T2 changes in subjects with SCD.

Comparison of T2 and secular-T2 peak relaxation times. Both T2 (A) and secular-T2 peak (B) relaxation time graphs show significant shortening of relaxation times in patients with SCD compared with control subjects. Age was not associated with either T2 or secular-T2 changes in subjects with SCD.
Blood Transfusion
Ten patients with SCD underwent blood transfusions. The volumes of transfusions received varied widely from subject to subject (from 1 U to more than 27 U) over a subject-specific investigation period (ranging from 6 years 1 month to 8 years 2 months). Transfusions were administered for clinical purposes, including sickle cell crisis and prophylaxis for dental operations or cesarean sections, and were typically given at 2–4 U at a time. The records for 1 subject with SCD were unavailable, because the patient received treatment at an outside hospital. The records of transfusion volume in 3 subjects with SCD were partially available. One subject with SCD with a history of transfusion of 4 U had received another transfusion (volume unknown) 5 years before and was categorized into the moderate group. Two other subjects with SCD, who received at least 27 and 23 U, respectively, had additional histories of multiple transfusions during the investigation period and were categorized into the severe group.
The volumes of transfusions showed significant impact on shortening in T2 peak values (P < .0001) (Fig 6) and secular T2 peak values (P = .0007). There was no significant correlation between transfusion volumes and other qMRI parameters, including T1 peak values, volumes of craniofacial bone marrow, and ratios of craniofacial bone marrow to the intracranial volume. Two unstable subjects with SCD received more than 20 U of transfusions for repeated sickle cell crises and demonstrated low T2 peak values at around 40–50 ms. Two other subjects with SCD with past histories (before 2000) of multiple hospitalizations for vaso-occlusive crisis or acute chest syndrome had been stable for the past 6–7 years, and their T2 peak values demonstrated 89.83 and 86.5 ms, respectively, located in the range of the mild disease group, 79–119 ms.

T2 association with the number of transfusions received. Shortening of T2 times is seen as the number of packed red blood cell (PRBC) transfusions increase.
Craniofacial Bone Marrow Volumetry
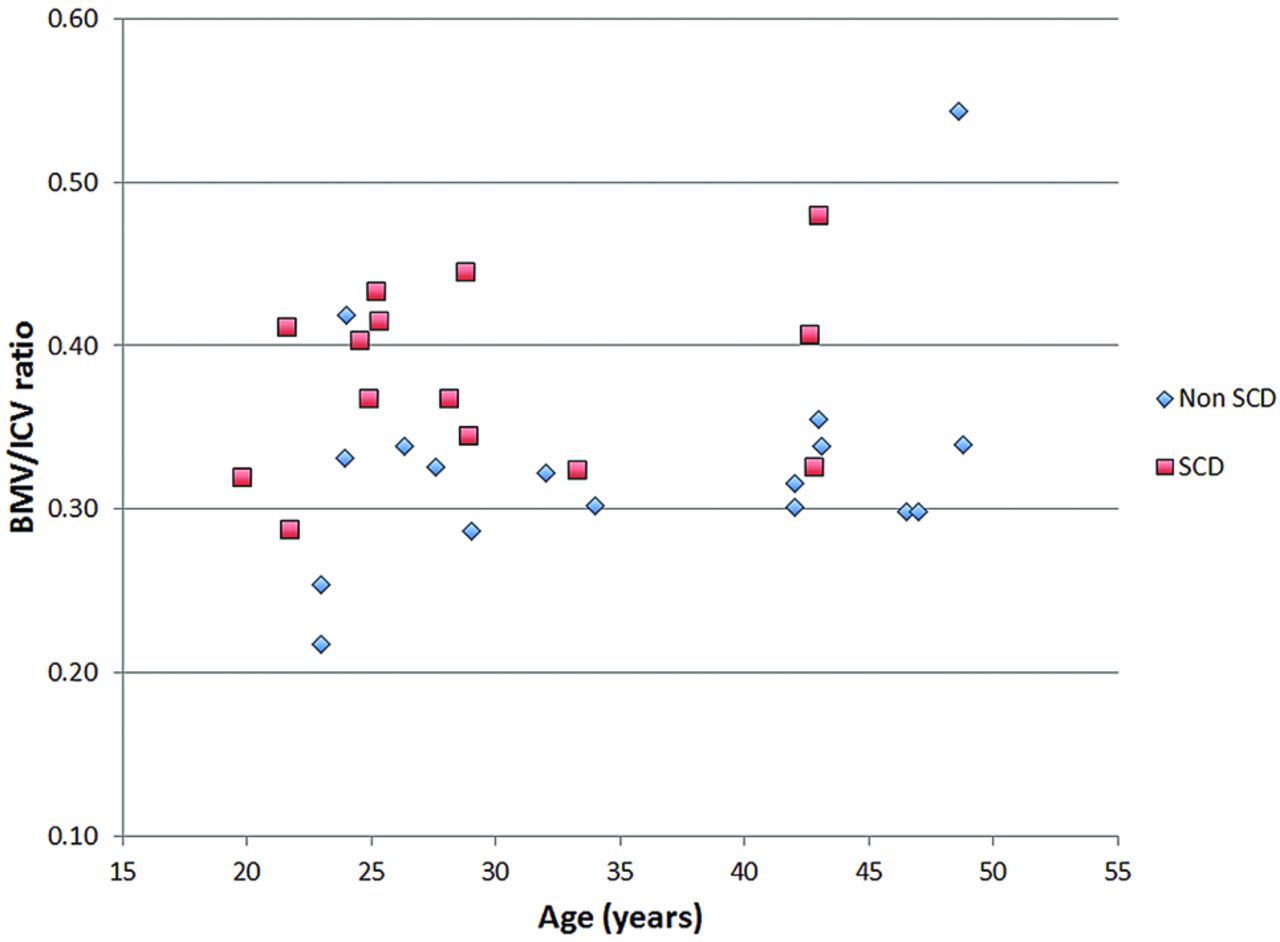
In patients with SCD, volumetric analysis revealed a significant increase in the volume of the bone marrow of 16.5% as well as in the standardized craniofacial bone marrow volume of 15.2% (Table 2). Plotted individual values are shown in Fig 7.

Comparison of craniofacial bone marrow volume (BMV)/intracranial volume (ICV). Significant increase in craniofacial bone marrow volume is noted in patients with SCD compared with control subjects.
Discussion
At birth, bone marrow contains a predominance of hematopoietically active red marrow. Shortly thereafter, the process of marrow conversion takes place, and yellow marrow gradually replaces red marrow in a stepwise and predictable manner. The process begins in the appendicular skeleton (upper and lower limbs) and progresses to the axial skeleton (skull, spine, sternum, flat bones).15 The adult pattern of bone marrow is typically reached by an average age of 25 years.2 At this time, the largest portion of active red marrow is found in the axial skeleton and the proximal humeri and femurs.16 Yellow marrow predominates in the remainder of the long bones, particularly in the epiphyses and apophyses.15,16
When the demand for hematopoiesis is increased in response to systemic stresses such as chronic anemia, heart failure, or heavy smoking, the process of reconversion is initiated.17 Reconversion occurs in the reverse pattern of conversion, whereby fatty marrow is replaced by red marrow and may occur in a regional pattern opposite that of conversion.16 Whether due to pathologic replacement or physiologic stress, the process of reconversion and/or changes in bone marrow cellularity and composition can be detected on MR imaging.18,19 Past studies have shown that loss of marrow hyperintensity assessed qualitatively on T1-weighted MR images correlates with underlying systemic or hematologic disorders.3
Prior bone marrow studies have been conducted in structures that contain abundant marrow, such as the spine and femur.1,2 Marrow reconversion at the skull base can be perceptible on MR imaging, but facial bones are typically too small in volume to accurately assess marrow reconversion qualitatively. To our knowledge, quantitative assessment of marrow composition in the craniofacial bones has not been described. Because patients with SCD often undergo brain imaging to evaluate for cerebral vaso-occlusive disease and infarct, quantitative assessment of craniofacial bone marrow may help categorize degree of severity and guide clinical management.
In this study, we applied the mixed TSE pulse sequence to examine craniofacial bone marrow in SCD. Quantitative shifts in the signal intensity of T1, T2, and secular-T2 relaxation times of the craniofacial bone marrow volume were present. Specifically, we found significant T1 lengthening (after bimodal analysis), T2 and secular-T2 shortening, and an increase in bone marrow volume (before and after standardizing to intracranial volume) (Table 2) in patients with SCD.
T1
The T1 histogram of craniofacial bone marrow exhibited 2 separate peaks, which are most likely representative of 2 different compositions of craniofacial marrow. A high level of intersubject T1 variability was found in both subjects with SCD and in control subjects.
In healthy people, the process of conversion of red to yellow marrow is complete by 25 years; however, red marrow remains in the axial skeleton and proximal long bones.3 The first peak represents yellow marrow, as high fat content shortens the T1 spin-lattice relaxation times.2 The second peak represents hematopoietically active red marrow given the composition of high cellularity, protein, and water, which thereby increases the T1 relaxation times. In subjects with SCD, there was a decrease in amplitude in the first T1 peak and an increase in amplitude in the second T1 peak compared with control subjects (Fig 3). This supports the fact that there is less yellow marrow volume and more red marrow volume in patients with SCD.
When comparing the T1 relaxation time of the histogram peaks, the first peak showed significant increase in subjects with SCD (Fig 4). The lengthening in the first peak was most likely a result of the failure of red-to-yellow marrow conversion, because of the demand for enhanced erythropoiesis as a result of the chronic hemolytic anemia in SCD. The second T1 peak, reflecting red marrow composition, did not have a significant shift in relaxation times.
T1 relaxation time in the SCD group also demonstrated age-associated decline, particularly in T1 peak 1. This may indicate continuous age-related changes in marrow composition and/or long-term effects of SCD and SCD-related conditions.
T2 and Secular-T2
For T2 and secular-T2 times, we did not find a bimodal distribution of peaks as was seen in the T1 analysis. This is concordant with the fact that T2 does not emphasize the contrast between fat and cellular components as well as T1. The mean values of both T2 and secular-T2 peak times showed a significant shortening in subjects with SCD compared with control subjects (Fig 5A, -B). The shortening seen in T2 times also supports our hypothesis of a failure to convert to yellow marrow. As the volume of yellow marrow is decreased in patients with SCD, spin-spin T2 relaxation times become more efficient, thereby shortening T2 times. Additional shortening in T2 times was seen in severely affected subjects with multiple transfusions (Fig 6). Increased iron deposition as a result of hemolysis in subjects with severe disease and repeated blood transfusions can account for the shortening of T2 and secular-T2 times.
Craniofacial Marrow Volume
To our knowledge, this study is the first to perform a specific volume analysis focusing on craniofacial marrow. Results showed a significantly increased volume of the craniofacial bone marrow in subjects with SCD, before and after standardization to intracranial vault volume (Fig 7). Prior literature has used MR imaging to show that cranial bone marrow thickness is increased in patients with chronic anemia compared with healthy subjects.9 Given that bone marrow thickness correlates with volume, these findings are concordant with our results.
Limitations
Lack of clinical records before 2000 precluded analysis of the effect on T2 shortening of overall lifetime number of blood transfusions for patients with SCD. In addition, the records after 2000 were incomplete in some of the patients with SCD. Although the significant negative correlation between transfusion volumes and T2 shortening was suggested, the effects of transfusion volumes on qMRI parameters were not assessed quantitatively.
An additional limitation of this work relates to the qMRI pulse sequence used, which samples the T1 recovery curve as well as the T2 decay curve at only 2 points each. Therefore, potential deviations from pure exponential T1 recovery and/or T2 decay cannot be detected with this technique. This might lead to errors in the estimation of T1 and/or T2 for partial volume voxels containing red and yellow marrow. For such voxels, biexponential behavior has been demonstrated in the lumbar vertebrae.20 On the other hand, qMRI pulse sequences that sample the relaxation curves at the many time points necessary for fully characterizing biexponential relaxation curves have longer scan times and therefore tend to be clinically impractical with current MR imaging technology.
Conclusions
Patients with SCD demonstrate characteristic T1, T2, and secular-T2 histograms reflecting chronic anemic state and associated red marrow reconversion. By using the specific changes seen in T1, T2, and secular-T2 relaxation times, qMRI can be seen as a useful adjunct in monitoring of disease severity in patients with SCD. Progression of iron deposition may be assessed as well. In addition, volumetry showed an increase in the craniofacial marrow volume, which could also be used as an important biomarker for monitoring SCD disease severity, progression, and treatment effectiveness. Finally, the study could be an initial step in establishing healthy and pathologic ranges for T1, T2, and volumes of the craniofacial marrow, not only in SCD but also in other systemic diseases affecting the craniofacial marrow.
Footnotes
Disclosures: Herman Jara—RELATED: Support for Travel to Meetings for the Study or Other Purposes: Boston. Al Ozonoff—UNRELATED: Consultancy: Honoraria from Roche for Data and Safety Monitoring Board participation; subject matter unrelated to the submitted work. Osamu Sakai—UNRELATED: Royalties: O. Sakai. Head and Neck Imaging Cases. McGraw-Hill, 2011.
Previously presented in part at: 18th Scientific Meeting and Exhibition of the International Society of Magnetic Resonance in Medicine, May 1–7, 2010; Stockholm, Sweden.
References
- Received February 17, 2012.
- Accepted after revision May 15, 2012.
- © 2013 by American Journal of Neuroradiology


