
Abstract
BACKGROUND AND PURPOSE: DTI is being increasingly used to visualize critical white matter tracts adjacent to brain tumors before neurosurgical resection. However, brain tumors, particularly high-grade gliomas, are typically surrounded by regions of FLAIR hyperintensity that include edema, which increase isotropic diffusion, degrading the ability of standard DTI to uncover orientation estimates within these regions. We introduce a new technique, RSI, which overcomes this limitation by removing the spherical, fast diffusion component introduced by edema, providing better analysis of white matter architecture.
MATERIALS AND METHODS: A total of 10 patients with high-grade gliomas surrounded by FLAIR-HI that at least partially resolved on follow-up imaging were included. All patients underwent RSI and DTI at baseline (FLAIR-HI present) and at follow-up (FLAIR-HI partially resolved). FA values obtained with RSI and DTI were compared within regions of FLAIR-HI and NAWM at both time points.
RESULTS: RSI showed higher FA in regions of FLAIR-HI and NAWM relative to DTI, reflecting the ability of RSI to specifically measure the slow, restricted volume fraction in regions of edema and NAWM. Furthermore, a method by time interaction revealed that FA estimates increased when the FLAIR-HI resolved by use of standard DTI but remained stable with RSI. Tractography performed within the region of FLAIR-HI revealed the superior ability of RSI to track fibers through severe edema relative to standard DTI.
CONCLUSIONS: RSI improves the quantification and visualization of white matter tracts in regions of peritumoral FLAIR-HI associated with edema relative to standard DTI and may provide a valuable tool for neurosurgical planning.
ABBREVIATIONS:
- CST
- corticospinal tract
- FA
- fractional anisotropy
- HI
- hyperintensity
- NAWM
- normal-appearing white matter
- RSI
- restriction spectrum imaging
- SLF
- superior longitudinal fasciculus
There is an increasing acceptance of the notion that the extent of surgical cytoreduction for high-grade gliomas correlates with overall survival duration1⇓⇓–4 and quality of life,1,2,5 as well as response to radiation6 and temozolomide chemotherapy.7 The risk for incremental gain in cytoreduction, however, must be carefully weighed against potential neurologic injuries that adversely affect overall survival duration as well as quality of life.1,8 In this context, the current guideline for surgical management involves that of “maximal safe resection” where maximal cytoreduction is achieved while postoperative neurologic deficit is minimized.8
Several technologies have been developed to this end. Among these, DTI and DTI tractography have emerged as useful surgical adjuncts because of their ability to provide 2D and 3D renderings of the location and orientation of white matter tracts relative to the main tumor margins.9 These imaging tools rely on estimates of the degree of orientation of water diffusion (ie, FA), with high FA values suggesting highly oriented diffusion and, thus, highly organized white matter structure.10 Conversely, low FA values can suggest disruption to the organization of white matter because of demyelination, axonal loss, and/or other processes of cellular degeneration.11 In particular, DTI tractography has been used to demonstrate displacement of white matter tracts from tumor mass effect, as well as destruction of white matter tracts by tumor infiltration.12 Thus, tractography can afford neurosurgeons a sense of the structures to avoid during surgical resection and minimize injury to critical white matter tracts, including the CST, SLF, and the optic radiations.
A major challenge in the application of DTI tractography to neuro-oncologic surgery involves the presence of FLAIR hyperintensity adjacent to the region of the neoplasm. This region often includes tumor-related edema and radiation-related edema, as well as nonenhancing tumor and other treatment-related effects.13⇓–15 Of particular concern is that water diffusion in regions of edema appears more isotropic, thereby lowering FA values and limiting the success of white matter tract reconstructions. Therefore, reduced FA in regions of FLAIR-HI associated with edema can prevent the accurate visualization of fiber tracts, resulting in an underestimation of the extent of intact white matter surrounding a tumor. Previous research16 has reported dissociations between the actual degree of neurologic deficits after surgery and the expected degree of neurologic deficits on the basis of the preoperative FA of fiber tracts in regions of FLAIR-HI.
Here, we apply a new method, RSI, to overcome the problem of visualizing white matter tracts in regions of peritumoral FLAIR-HI. This new method uses multiple diffusion weightings (ie, b-values) to separate hindered from restricted diffusion pools and removes the fast, hindered volume fraction associated with edema.17,18 Modeling the slow, restricted component increases the sharpness of the estimates, allowing for a better estimation of fiber tract orientation. Thus, this method shows promise for overcoming the well-known problem of probing white matter structure in regions affected by edema.11,19
In this study, we compare the ability of RSI vs standard DTI to quantify and visualize white matter anatomy in regions of FLAIR-HI (baseline) relative to when the FLAIR-HI has at least partially resolved (follow-up). We hypothesize that 1) RSI-based FA (RSI-FA) estimates of fiber tracts within regions of FLAIR-HI will be similar to RSI-FA estimates obtained within NAWM, whereas standard DTI-FA values obtained in regions of FLAIR-HI will be significantly lower than DTI-FA values derived from NAWM. In addition, 2) RSI-FA estimates obtained in regions of FLAIR-HI at baseline will approximate RSI-FA values obtained at follow-up in the same regions once the FLAIR-HI has resolved, whereas DTI-FA estimates at baseline will be significantly lower than DTI-FA values obtained once the FLAIR-HI has resolved. If successful, this method will improve fiber tract reconstructions in areas of FLAIR-HI associated with edema. This method could help guide neurosurgical planning and limit postoperative morbidity in patients with a variety of brain tumors and other lesions complicated by edema.
Materials and Methods
Patients
A total of 78 patients with high-grade gliomas underwent routine MR imaging at the University of California San Diego as part of standard clinical care between 2010–2012. This study was approved by the institutional review board, and informed consent was obtained from all patients by a board-certified neuro-oncologist at their initial clinic appointments. Participants in this study included consecutive patients with biopsy-confirmed high-grade gliomas who had 1) a large region of peritumoral FLAIR-HI at baseline and 2) follow-up MR imaging in which at least 50% of the region of FLAIR-HI was isotense. In our study, the reduction in FLAIR-HI was thought to be largely associated with reductions in tumor-related and treatment-related edema, though changes in other tissue properties could not be eliminated. This resulted in 12 patients, including 7 with glioblastoma multiforme, 2 with anaplastic astrocytoma, 2 with oligoastrocytomas, and 1 with an anaplastic glioneural neoplasm. Two patients with glioblastoma multiforme were excluded because of significant MR imaging artifacts and problems with image registration. This resulted in a final sample of 10 patients whose clinical and pathologic data are summarized in the accompanying Table.
Clinical characteristics of patients with high-grade gliomas
MR Imaging Acquisition
All MR imaging scans were performed on a 3T Signa Excite scanner (GE Healthcare, Milwaukee, Wisconsin) at the UCSD Moores Cancer Center. The imaging protocol included a pregadolinium and postgadolinium 3D volumetric, T1-weighted, inversion recovery spoiled gradient-echo sequence (TE, 2.8 ms; TR, 6.5 ms; TI, 450 ms; flip angle, 8°; FOV, 24 cm; 0.93 × 0.93 × 1.2 mm; sagittal); a 3D T2-weighted FLAIR sequence (TE, 126 ms; TR, 6000 ms; TI, 1863 ms; FOV, 24 cm; 0.93 × .093 × 1.2 mm; sagittal); and, for diffusion MR imaging, a single-shot pulsed-field gradient spin-echo-planar imaging sequence (TE, 96 ms; TR, 17 s; FOV, 24 cm; matrix, 128 × 128 × 48; axial). Diffusion data were acquired with b = 0, 500, 1500, and 4000 s/mm2, with 1, 6, 6, and 15 unique gradient directions for each b-value, respectively (total, 28; total time, approximately 8 minutes). Diffusion data were then corrected off-line for spatial distortions associated with susceptibility and eddy currents, and were registered to the 3D anatomic scans.
Image Preprocessing
All image data were preprocessed by Matlab (MathWorks, Natick, Massachusetts). Structural scans, including T1-weighted precontrast and postcontrast images and T2-weighted FLAIR images, were corrected for distortions attributed to gradient nonlinearities (gradient unwarping)20 and were rigidly registered to each other by use of mutual information.21 Rigid registration of the structural data to a T1-weighted head atlas was performed by use of the T1-weighted precontrast image, corrected for regions of hypointensity caused by edema from use of the T2-weighted FLAIR. We corrected diffusion MR imaging data for eddy current distortions by using a least-squares inverse and iterative conjugate gradient descent method to solve for 12 scaling and translation parameters describing eddy current distortions across the entire diffusion MR imaging scan. We explicitly took into account the orientations and amplitudes of the diffusion gradient.22 We corrected head motion by rigidly registering each diffusion-weighted image to a corresponding image synthesized from a tensor fit to the data.23 Spatial and intensity distortions caused by B0 magnetic field inhomogeneities were corrected on the B0 volume by use of the reversing gradient method.23⇓⇓–26 We corrected distortions caused by gradient nonlinearities in the diffusion data by applying a predefined, scanner-specific, nonlinear transformation.20 While diffusion data were postprocessed in native space (described in the next paragraph), we resampled the derived images (FA and tensor parameters) into atlas space by first rigidly registering the nondiffusion-weighted (b = 0) volume to the T2-weighted FLAIR volume, and then applying the rigid-body registration to the atlas computed from the structural data. All image data from each participant were visually inspected to ensure registration accuracy, and any datasets with severe scanner artifacts or excessive head motion were excluded (n = 2).
Diffusion Postprocessing
Both DTI-FA and RSI-FA values were calculated from the entire diffusion dataset (all b-values). For RSI, the predicted signal from the restricted water fraction was used to fit the tensor parameters while projecting out the hindered water signal. To define the RSI spectrum, we followed the procedure detailed by White et al.18 In brief, we set the RSI longitudinal diffusivity (DL) to 1 × 10⁻³ mm2/s and varied the transverse diffusivity (DT) from 0 mm2/s to DL in 6 equally spaced steps. Two additional isotropic terms were included: one modeling restricted diffusion (DL = DT = 0 mm2/s), and one for “free” water (DL = DT = 3 × 10⁻³ mm2/s). The RSI spectrum was then fit to the data by use of least-squares estimation with Tikhonov regularization.18 We then determined the predicted signal from the restricted water fraction by using the estimated parameters and its FA was determined (RSI-FA). All RSI-FA values were then rescaled to each patient's DTI-FA value in NAWM to place the restricted FA on a similar scale to the DTI- FA values. This method allowed us to apply comparable analyses and tractography algorithms (ie, to use identical FA thresholds) to the FA values derived from both methods.
Longitudinal Registration
For longitudinal measurement of RSI-FA and DTI-FA in defined regions of edema and NAWM, it was necessary to account for the changes in brain shape caused by tumor growth or surgical resection. Nonlinear registration with the discrete cosine transform method27 was used to define a parameterized deformation between the first and second time points, before and after resolution of edema. The T1-weighted, precontrast images, weighted by T2-weighted FLAIR to correct for hypointensity regions, were used to guide the nonlinear registration, and the computed deformations were then applied to the co-registered DTI-FA and RSI-FA volumes.
Regions of Interest
Tumor was identified as the enhancing region on the T1 postcontrast sequence. Manual ROIs were drawn by an image expert (10 years of experience) and verified by a board-certified neuroradiologist (3 years of experience). ROIs were created for peritumoral FLAIR-HI and NAWM on the 3D volumetric FLAIR image by use of axial images that were co-registered to the T1 postcontrast sequence. The FLAIR-HI region of interest was placed in an area of peritumoral tissue that was T2 hyperintense at baseline but isointense at follow-up. This subregion of the total peritumoral FLAIR-HI was chosen because it allowed a direct comparison of FA measurements with and without FLAIR-HI across co-registered images. A NAWM region of interest of the same size was then drawn in the homologous region of the contralateral hemisphere. Although ROIs were variable across patients, the ROIs used for regions of FLAIR-HI and NAWM in each patient were held constant across method and across time.
Tractography: Case Example
We performed fiber tract reconstructions by using the Amira software package v5.4.2 (Visage Imaging, San Diego, California) and extension modules written by one of the coauthors (H.B.). The area of FLAIR-HI was identified and outlined by a volumetric region–growing approach. The preprocessed tensor data were loaded and used to perform streamline fiber tracking, according to the fiber assignment by continuous tracking method described by Mori et al28 and Wakana et al.29 For our study, we performed tracking for the SLF and CST because of their importance to language and motor functioning, respectively.
Volumetric seed regions for the SLF and CST were manually drawn based on anatomic landmarks on an image oriented perpendicular to the main direction of the tract. Anatomically defined waypoint ROIs were also used to select the tract of interest and exclude other tracts arising from the same seed region.28,29 For each fiber, tracts were initiated from seed regions with an FA of >0.2, and tracking was terminated when the FA decreased below 0.2 or the bending angle exceeded 45°.
We visualized fibers by using illuminated streamlines together with surface renderings of the tumor mass and FLAIR orthogonal images. Editing of fiber bundles was restricted to a minimum and was performed consistently for RSI and DTI computations. Only in areas where the corticopontine tract is close to the middle cerebral peduncle, fibers not belonging to the corticopontine tract were removed by manual intervention. Furthermore, fibers crossing between hemispheres were rejected, as they resulted from partial volume effects inherent in the limited spatial resolution of diffusion-weighted images. On each image, regions of FLAIR-HI with a DTI-FA or RSI-FA value of >0.20 were considered to include mild edema, whereas regions of FLAIR-HI with a DTI-FA or RSI-FA value equal to or less than 0.20 were considered to include moderate to severe edema. Because the RSI-FA was rescaled to the DTI-FA, the overall FA values and thresholds used to perform tractography were comparable.
Statistical Analysis
Statistical analyses were performed with the Statistical Package for the Social Sciences software (SPSS, v17.0; Chicago, Illinois). To evaluate FA differences at baseline between RSI and DTI, we performed a 2-factor repeated-measures analysis of variance with type of tissue (FA in FLAIR-HI vs FA in NAWM) as a repeating factor. To evaluate change in FA in regions of resolved FLAIR-HI between RSI and DTI, a second RMANOVA was performed with time (baseline vs follow-up) as the repeating factor.
Results
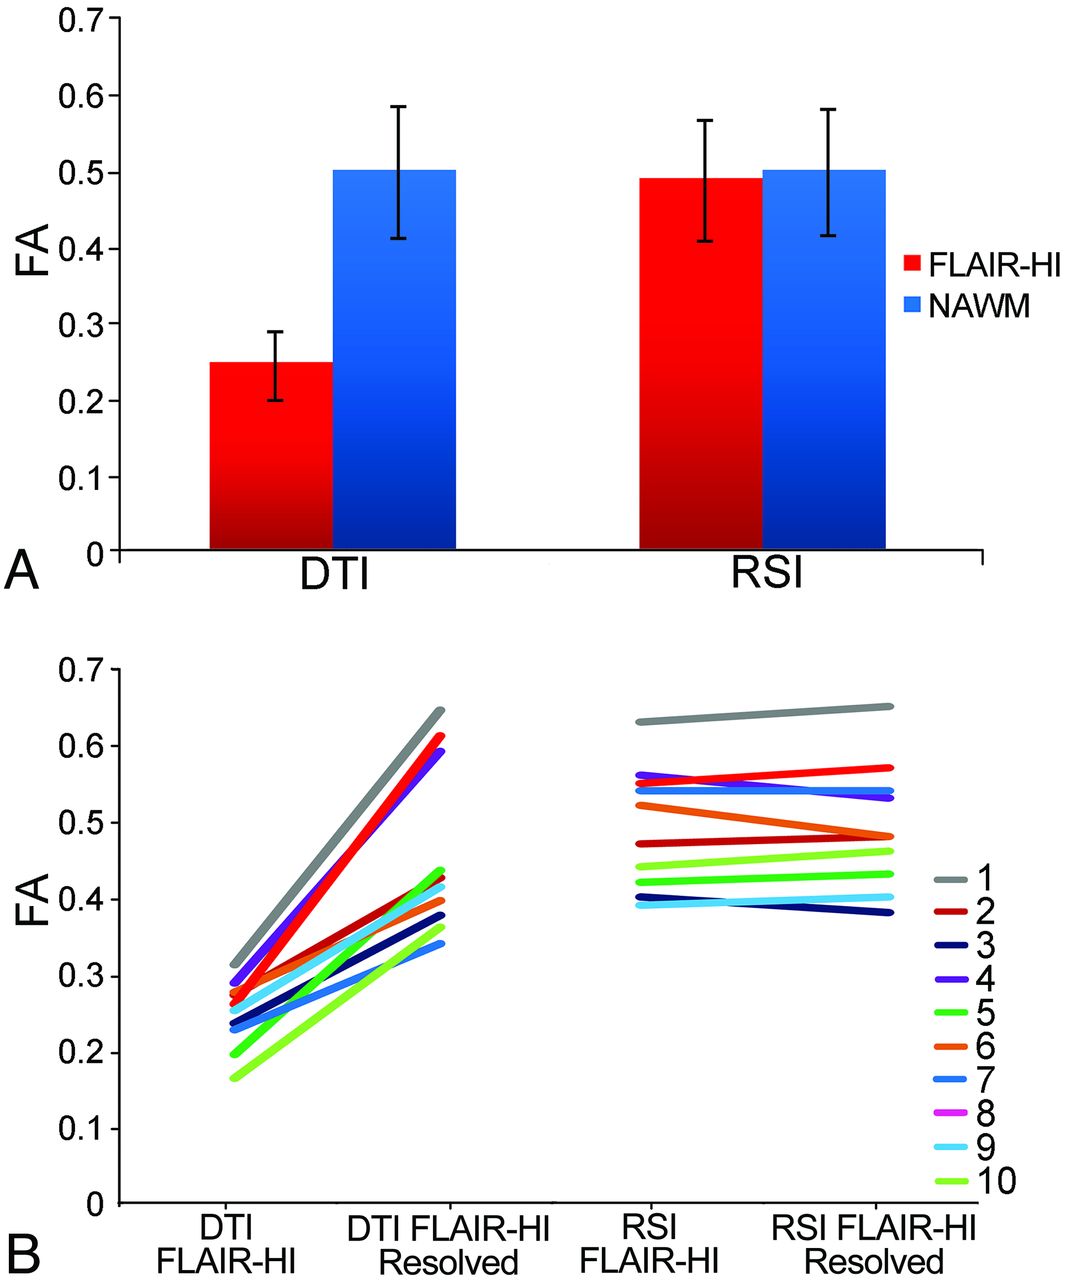
Figure 1A shows the mean RSI-FA and DTI-FA values derived from ROIs in regions of FLAIR-HI and NAWM at baseline. Results from the baseline repeated-measures ANOVA revealed a main effect of method [F (1,9) = 150.5; P < .001], indicating that RSI-FA was higher overall than DTI-FA; and a main effect of type of tissue [F (1,9) = 115.6; P < .001], indicating that FA values were higher in NAWM relative to FLAIR-HI. However, an interaction revealed that FA values obtained in FLAIR-HI vs NAWM differed as a function of the method [F (1,9) = 150.6; P < .001]. Paired t tests confirmed that RSI-FA did not differ (though it was numerically higher in NAWM) between type of tissue [t (9) = −1.6; P > .05)], whereas DTI-FA in the region of FLAIR-HI was significantly lower than DTI-FA in NAWM [t (9) = −11.9; P < .001].

A, Mean baseline FA values in regions of FLAIR-HI and NAWM for standard DTI and RSI (error bars represent SDs). B, Individual patient trajectories of FA values in regions of FLAIR-HI at baseline and in the same region of interest when the FLAIR-HI had resolved for standard DTI and RSI.
Results from the repeated-measures ANOVA comparing methods across time revealed a main effect of method [F (1,9) = 59.4; P < .001], indicating that RSI-FA was higher overall than DTI-FA; and a main effect of time [F (1,9) = 48.4; P < .001), indicating that FA values were higher in regions of resolved FLAIR-HI relative to baseline regions of FLAIR-HI. A method by time interaction revealed that the differences in FA between baseline and follow-up varied as a function of the method [F (1,9) = 57.0; P < .001]. Paired t tests demonstrated that RSI-FA did not differ between baseline and follow-up imaging [t (9) = −0.2; P > .05], whereas DTI-FA increased significantly at follow-up when the FLAIR-HI had resolved [t (9) = −7.5; P < .001]. Figure 1B shows the individual trajectories for the 10 patients at baseline and follow-up within the FLAIR-HI ROIs. As can be seen, a highly consistent pattern emerged across patients showing large differences in DTI-FA between FLAIR-HI and resolved FLAIR-HI that are not apparent in RSI-FA estimates.
Figure 2 shows the results of streamline tractography for a representative patient by use of both RSI and standard DTI methods to track the SLF and CST through regions of peritumoral FLAIR-HI. As can be seen in Fig 2A, at a standard FA threshold of 0.20, fewer streamlines are completed for the SLF with DTI, and the full extent of the tract is not appreciated. From a converse standpoint, RSI is not significantly affected by the region of FLAIR-HI. Tractography reconstructed by RSI looks remarkably similar in the images with and without FLAIR-HI. Figure 2B shows the CST for the same patient tracked through the region of FLAIR-HI. In this case, the tracts look rather similar between the DTI and RSI methods. As shown in Fig 3, this is because the CST runs anterior to areas of FLAIR-HI with an FA value of below 0.20 (ie, regions of moderate to severe edema), whereas the SLF runs through the center of this region. Thus, in regions of mild FLAIR-HI (ie, FA > 0.20), both DTI and RSI perform well.

Streamline tractography of (A) SLF and (B) CST for a 58-year-old woman with a right temporal lobe glioblastoma multiforme (Patient 1) projected onto baseline and follow-up FLAIR images. The left panel shows the RSI- and DTI-based tractography at baseline in regions of FLAIR-HI, whereas the right panel shows data obtained by use of the same tractography algorithm once the FLAIR-HI had mostly resolved. The ipsilateral (red) and contralateral (green) 3D renditions of the SLF are superimposed on axial and sagittal FLAIR sections collected at each time point. The glioblastoma multiforme is shown in blue in the preoperative image. Black arrows point to frontal and parietal regions of the SLF that terminate completely in regions of FLAIR-HI with DTI, and the red arrow shows the sparse streamlines in the temporal portion of the SLF with DTI. These streamlines are “recovered” by DTI once the FLAIR-HI resolves.
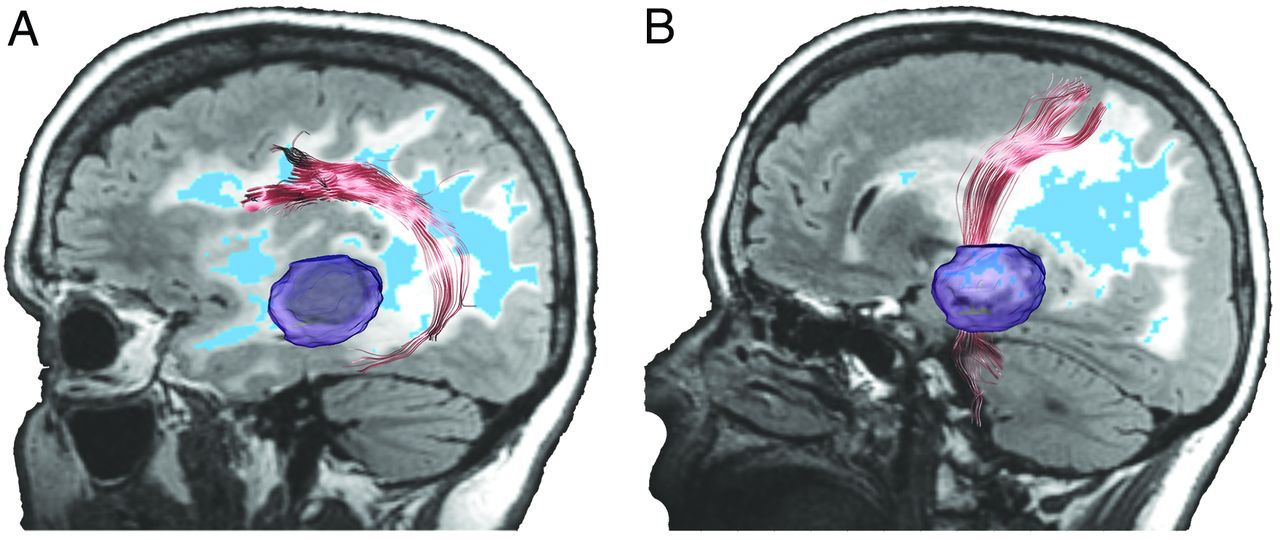
Sagittal views of (A) SLF and (B) CST shown in relationship to regions of mild (white) and moderate to severe (blue; FA < 0.2) FLAIR-HI projected onto a FLAIR image. As can be seen, the SLF is affected by regions of moderate to severe FLAIR-HI, whereas the CST courses anterior to the severe FLAIR-HI. Therefore, streamlines are not as affected in this fiber.
Discussion
There is increasing enthusiasm for the use of DTI and tractography in neurosurgical planning,14,30⇓⇓⇓⇓⇓–36 and some evidence exists that tractography-guided neuronavigation can be used to minimize neurologic morbidity.32,37,38 However, the ability to estimate white matter structure in regions of peritumoral FLAIR-HI associated with edema in patients with high-grade glioma has remained a challenge.11,19 Ng et al16 reported on motor outcome in 12 patients who underwent resection of tumors adjacent to the CST. Despite lower FA in patients whose CST was affected by the presence of peritumoral edema vs those patients without edema, there were no differences between the groups in motor outcome. In fact, hemiparesis resolved in all patients, suggesting that fiber tracts within peritumoral regions were not destroyed and clinical recovery was possible. In a similar fashion, in one of the few studies with postsurgical imaging, Yamada et al15 noted the “reappearance” of the CST along with full motor recovery in a patient with a right frontal glioblastoma multiforme after resolution of mass effect and edema. Berman et al39 applied concurrent cortical stimulation mapping to probe the fiber pathways beneath the motor cortex and to determine whether tracts obscured by edema were functionally intact. They reported that although the CST often terminated or diverged in regions of edema, local cortical stimulation suggested that the tract was functional. Thus, they concluded that standard DTI does not adequately reveal the vitality of neuronal pathways in edematous tissue. These findings speak to the importance of using methods that can accurately probe white matter structure in FLAIR-HI regions influenced by edema and thus provide more clinically meaningful information on fiber tract anatomy.
In our study, we demonstrate the ability of RSI to address this limitation by removing the fast diffusion component associated with edema, restoring anisotropy estimates in regions of FLAIR-HI that approximate those values obtained when the FLAIR-HI had resolved. Conversely, standard DTI-FA estimates were extremely low in regions of FLAIR-HI but increased appreciably when the FLAIR-HI had resolved. Taken together, these results suggest that the underlying structure of white matter was largely intact in peritumoral tissue but was artifactually masked by edema. This information is critical in surgical planning of patients with high-grade gliomas who are likely to have large regions of peritumoral FLAIR-HI associated with edema causing mass effect, midline shift, and temporary clinical morbidity.16 Deciphering intact from destroyed white matter tracts in regions of FLAIR-HI would not only assist neurosurgeons in planning the optimal surgical route, but it would also provide clinicians with information as to whether a patient's neurologic deficits are likely chronic, resulting from destroyed fiber tracts, or temporary and are likely to subside once the edema and associated pathologic features resolve. Previous studies40,41 have demonstrated an ability to reconstruct fiber tracts in regions of diffuse tumor and peritumoral tissue by reducing the FA threshold to lower levels. Although modifying the FA threshold is a straightforward option, FA is directly related to the overall certainty in orientation. That is, uncertainty in the orientation estimates increases as FA decreases. Data have shown that when FA falls below 0.20, uncertainty in orientation may range from 5–20°, with uncertainty rising sharply at FA values below 0.15.42 Therefore, although streamlines may be completed within pathologic tissue by lowering the FA threshold, this method is also prone to more inaccuracies in the derived orientation estimates, increasing the likelihood of spurious streamlines in the data.40 As seen in Fig 2, RSI is able to successfully track fibers through regions of mild and severe FLAIR-HI when a standard FA threshold (0.20) is applied, whereas tracts obtained from DTI terminate in regions of significant FLAIR-HI (Fig 3). Our longitudinal data show that for the fiber tract most affected by severe edema (ie, SLF) in the selected patient, full recovery of the tract is achieved when most of the FLAIR-HI resolves.
As noted previously, it is likely that edema is not the only factor that affects FA estimates in regions of FLAIR-HI associated with high-grade gliomas. In particular, lower FA estimates within regions of FLAIR-HI may reflect tumor cell infiltration, radiation and other treatment-related effects, and/or partial destruction of the extracellular matrix.43 However, it is noteworthy that the ability of RSI to model primarily the slow, restricted volume fraction should facilitate the interpretation of low FA. That is, the RSI-FA should not be significantly affected by infiltration of tumor cells in the extracellular matrix in the absence of fiber tract compromise. Regions of crossing fibers, such as the corona radiata where the SLF crosses the CST, also harbor lower FA values, making it difficult to track with precision. The application of methods for resolving crossing fibers44⇓–46 is beyond the scope of our study, but it is noteworthy that RSI is capable of modeling crossing fibers within both edema and NAWM because of its greater angular precision (On-line Figure). Thus, it improves on previous DTI studies that have used bitensor models to separate slow and fast diffusion in regions of FLAIR-HI surrounding low-grade glioma,47 because bitensor models cannot model crossing fibers.
Despite the value of RSI in providing improved quantification and visualization of fiber tracts in regions of FLAIR-HI associated with edema, several limitations should be noted. First, although RSI improves on the ability of standard DTI to track through regions of low FA influenced by edema, the overall sensitivity of RSI is unknown. Therefore, RSI may also underestimate fiber tract anatomy in some regions, producing false-negative results. Second, it is noteworthy that most of the patients in our study had received surgery and/or medical management before the first RSI scan, as well as various treatments between scans. Whether the current results would differ in any meaningful way in a group of treatment-naïve patients is unknown and will require further validation. Unlike standard DTI, RSI requires the acquisition of multiple nonzero b-values. On some scanner platforms, this necessitates separate acquisitions for each b-value, which may add to the total scan time because of the additional prescanning. In addition, most clinically available tractography software assumes that the data are acquired with only a single (nonzero) b-value. In its current format, additional postprocessing is required to make the RSI data compatible with existing tractography software. However, efforts are currently underway in our laboratory to increase the flexibility of the RSI maps so that they may be easily imported for use in preoperative and intraoperative planning.
Conclusions
In summary, we propose a new method for uncovering fiber tract structure in regions of FLAIR-HI associated with edema that can facilitate streamlined tractography and possibly facilitate surgical planning. The degree to which this method correlates with clinical symptoms and/or can improve surgical outcomes requires additional validation through a carefully planned, prospective study.
Acknowledgments
We would like to thank the patients at UCSD Neuro-Oncology Program for their generous participation.
Footnotes
Dr. Chen and Dr. Dale contributed equally to the manuscript as senior authors.
Disclosures: Donald Hagler—UNRELATED: Consultancy: CorTechs Labs, Comments: Work related to development of automated white matter tract segmentation; Patents (planned, pending, or issued): US 2010/0004527 A1, Comments: Identifying White Matter Fiber Tracts Using Magnetic Resonance Imaging (MRI) patent pending licensed to General Electric with a nonexclusive, royalty-free (NERF) arrangement. Santosh Kesari—UNRELATED: Board Membership: San Diego Brain Tumor Foundation, Comments: nonpayment; Expert Testimony: 2 current cases; Grants/Grants Pending: National Institutes of Health, National Brain Tumor Society; Payment for Lectures (including service on speaker bureaus): Genentech, Merck, UCB; Patents (planned, pending, or issued): 4 at University of California–San Diego (UCSD). Anders Dale—RELATED: Grant: UCSD,* Comments: I am a principal investigator or co-principal investigator on numerous grants from the National Institutes of Health; UNRELATED: Grants/Grants Pending: UCSD;* Patents (planned, pending, or issued): UCSD,* MGH,* Comments: I am an inventor on a provisional patent disclosure on Restriction Spectrum Imaging, and other technologies, licensed to Siemens Medical Solutions and General Electric Medical Systems; Stock/Stock Options: CorTechs Labs,* Comments: I am a founder and hold equity in CorTechs Labs, Inc, and also serve on its Scientific Advisory Board. The terms of this arrangement have been reviewed and approved by UCSD in accordance with its conflict-of-interest policies; Other: UCSD,* Comments: I am the principal investigator of a research agreement between UCSD and General Electric Medical Systems.*Money paid to institution.
This study was funded by National Institutes of Health grants R01AG03122 (A.M.D.), R01EB000790 (A.M.D.), RC2DA029475 (A.M.D.), EB000790 (A.M.D.), 3P30CA023100–25S8 (S.K.), and R01NS065838 (C.R.M.).
Conflicts of interest: None of the authors have any personal or institutional financial interest in drugs, materials, or devices described in this submission.
Indicates open access to non-subscribers at www.ajnr.org
REFERENCES
- Received July 19, 2012.
- Accepted after revision August 21, 2012.
- © 2013 by American Journal of Neuroradiology
In this issue


Jump to section
Related Articles
Cited By...
- Multivariate genome-wide association study on tissue-sensitive diffusion metrics identifies key molecular pathways for axonal growth, synaptogenesis, and astrocyte-mediated neuroinflammation
- Diffusion-Weighted Imaging in Cancer: Physical Foundations and Applications of Restriction Spectrum Imaging
- Longitudinal Restriction Spectrum Imaging Is Resistant to Pseudoresponse in Patients with High-Grade Gliomas Treated with Bevacizumab