
Abstract
BACKGROUND AND PURPOSE: SWI is an MR technique conventionally implemented with single-echo gradient-echo data. The purpose of this study was to compare single-echo SWI processing and 2 multiecho SWI processing schemes: postaverage, where an SWI image is created for each echo and then averaged to create a single volume; and frequency-based, where a SWI image is generated from an average frequency image. Linear and nonlinear mask functions were investigated for all 3 processing schemes.
MATERIALS AND METHODS: Comprehensive optimizations were performed. Single and multigradient-echo data were acquired at 3T in 10 volunteers. Contrast-to-noise ratio was measured in various structures. Visibilities of the same structures were ranked in different SWI images by trained raters.
RESULTS: When image evaluation was based on measurements of contrast-to-noise ratio, the nonlinear mask and frequency-based scheme were superior. However, when image evaluation was based on ranks of qualitative visibility, the linear mask and postaverage scheme were superior. Although the nonlinear mask and frequency-based scheme allow increased contrast of paramagnetic perturbers such as the globus pallidus, periventricular veins, red nucleus, and subthalamic nucleus, they do not necessarily increase the information content of the image; rather, they result in a harsh contrast that is visually unpleasing to radiologists and wherein more subtle structure is relatively less apparent.
CONCLUSIONS: Linearly masked postaverage SWI is the recommended implementation of multiecho SWI for radiologic use; however, nonlinearly masked frequency-based SWI may have use in computer-based segmentation or registration.
ABBREVIATIONS:
- CNR
- contrast-to-noise ratio
- GP
- globus pallidus
- OR
- optic radiations
- RN
- red nucleus
- STN
- subthalamic nucleus
SWI is an MR imaging technique that exploits the effect of variations in magnetic susceptibility on gradient-echo signal to produce enhanced image contrast. Most MR imaging studies reconstruct only the magnitude image; phase is generally discarded. However, the phase data contain potentially useful information about inclusions in the imaging volume that change the local magnetic field. SWI processing allows this information to be incorporated into the magnitude image because the underlying structure may not necessarily be visible on magnitude alone.1
SWI was originally used to produce high-resolution venograms.2 SWI has found additional uses in clinical and research settings because of its sensitivity to other physiologically relevant magnetic field perturbers such as blood products,3 iron,4 and calcium.5 However, single-echo SWI is useful in the visualization, but not the quantification, of field perturbers. Modifications of SWI allow simultaneous quantification of the nature or amount of the perturber. For example, the effective transverse relaxation rate (R2*), which can be extracted from multiecho gradient-echo data via voxelwise curve fitting, is a metric that scales linearly with iron concentration in the brain.6
Brainovich et al7 described a postprocessing scheme for dual-echo gradient-echo data. In this scheme, average phase and average magnitude volumes were generated and subsequently used to produce a single SWI volume. Denk and Rauscher8 used a multiecho acquisition with 5 echoes to produce 5 SWI volumes that were subsequently averaged to produce a single average SWI volume. They reported improvements in contrast-to-noise ratio (CNR) of veins compared with conventional SWI. In addition, they described computation of R2* maps as a natural extension of the multiecho acquisition. In all cases, a conventional linear-phase mask function for SWI was used. The use of alternative mask functions theoretically results in an increased CNR of the cerebral veins,9 though this claim has not been rigorously tested in vivo.
There are 2 main goals of this work: first, a comparison of 3 SWI postprocessing schemes (single echo and 2 multiecho methods); and second, a comparison of the conventional (ie, linear) mask function with a novel nonlinear mask function. We identified the following objectives: 1) to describe and outline modifications to previously published multiecho SWI, as well as describe a nonlinear mask function; 2) to optimize the number of mask function multiplications for all combinations of postprocessing scheme and mask function; and 3) to compare all postprocessing schemes and mask functions in vivo by using both quantitative and radiologic assessments.10
Materials and Methods
Processing was performed in Matlab (MathWorks, Natick, Massachusetts) and FSL (http://www.fmrib.ox.ac.uk/fsl). Statistical analyses were performed in SPSS (IBM, Armonk, New York).
SWI Postprocessing Schemes
Three postprocessing schemes were compared: 1 for single-echo SWI and 2 for multiecho SWI. First, single-echo SWI processing involves background phase removal by using the homodyne method,11 generation of a phase mask, and multiplication of the mth power of the mask by the magnitude image.12
Second, the multiecho SWI method of Denk and Rauscher8 was modified and herein is referred to as the postaverage method. Postaverage multiecho SWI involves single-echo SWI processing on data from each echo, and averaging of the resulting images. Denk and Rauscher8 prescribe this technique with a linearly (in TE) increasing homodyne filter width to remove background contributions to phase from each echo to account for the additional phase wrapping at longer TE. We used a constant (with TE) filter size, as a compromise between eliminating phase wraps in later echoes and preserving the relevant contrast between echoes in a consistent manner.
Third, a frequency-based method for multiecho SWI was used and is based on the method described initially by Brainovich et al.7 For the image volume reconstructed from each echo, the background phase was removed by use of the homodyne method. Successive phase images were then temporally unwrapped by using Matlab's 1D unwrap function on the TE-dependent voxel data. Each unwrapped phase image was then divided by its corresponding TE to produce a frequency image. A weighted average of frequency was calculated from these individual frequency images: weights were inversely proportional to the variance of the frequency: (magnitude)2 (TE)2. A mask was computed from the average frequency image, and its mth power was multiplied by the average magnitude image for that section. This method is similar to what has been described by Brainovich et al7 but, in addition, involves the temporal unwrapping of phase, as well as masking the weighted average of frequency maps rather than the arithmetic mean of the phase images. Although the mean of the frequency maps is a physical and intuitive quantity, the mean of the phase images used by Brainovich et al7 is not logical from a physical or mathematic perspective.
For the homodyne filter, a 2D Hann window (1 period of a raised cosine) with dimensions equal to 30% (for multiecho) or 20% (for single-echo) of the respective matrix dimensions, rounded to the nearest integer, was used. This constant width filter, in conjunction with the temporal phase unwrapping that was used, resulted in the ability to remove all relevant phase wraps.
SWI Mask Functions
Two different mask functions were compared. First, the conventional linear mask function was used. In general form, the linear mask, L, is defined as follows:
 For single-echo and postaverage, X = −π rad is used, with x in radians. For frequency-based SWI where x is in units of Hertz, X is set to the equivalent value: (−π rad)(1 cycle/2π rad)(1/TEaverage) = 18.2 Hz, where TEaverage is the average of the TEs used (described below).
Second, a nonlinear mask function was used. This Hann-derived mask, H, is defined as follows:
 The values X and x can be expressed in either units of phase or frequency. X was set to π (for single-echo and postaverage) or the equivalent value of 18.2 Hz (for frequency-based SWI). Compared with the linear filter, it was expected that this filter would result in reduced image noise and increased contrast for negative phase/frequency structures.
MR Imaging
All scanning was performed on a 3T MR imaging scanner (Tim Trio; Siemens, Erlangen, Germany) by use of a 32-channel head coil. For evaluation and comparison of different SWI postprocessing schemes, 10 healthy volunteers were scanned (7 women; age, 28 ± 7 years). We collected data by using a single-echo 3D gradient-echo (TE, 20 ms; TR, 30 ms; bandwidth, 80 Hz/pixel; acquisition time, 6:28; fully flow-compensated) and multiecho 3D gradient-echo sequences (TE1, 10 ms; echo spacing, 7 ms; 6 echoes; TR, 52 ms; bandwidth, 160 Hz/pixel; acquisition time, 11:12; first echo fully flow-compensated). For both sequences, common parameters were matrix, 448 × 336 × 60; field of view, 224 × 178 × 60 mm3; flip angle, 12°; section oversampling, 12.5%. Both acquisitions were accelerated with generalized autocalibrating partially parallel acquisition (R = 2, reference lines = 24). Phase data from each channel were combined on-line by use of vendor software. This study was approved by the institutional review board. Informed consent was obtained in writing from all participants.
Six SWI volumes were created per participant: 3 postprocessing schemes with 2 mask functions each. The single-echo magnitude volume was registered to the first echo magnitude of the multiecho volumes to allow careful comparison of the different methods on individual vessels or regions, even if motion were present between the different volumes. Single-echo SWI volumes were computed, following which the magnitude registration parameters were applied.
Numeric Optimization
A 2D numeric phantom was created to evaluate the CNR of a vein by use of different postprocessing schemes and mask functions. The purpose of this simulation was to optimize the number of mask multiplications, m, for different postprocessing schemes. The phantom consisted of a 512 × 512 array. All pixels were assigned values of the effective transverse relaxation time, T2* (32 ms), and equilibrium signal, S0 (425), based on their measured values in WM in the in vivo multiecho data. One column was designated the vein compartment and was assigned a frequency that was varied for different trials. All other pixels were assigned a frequency of zero for all trials. This is similar to a previously described simulation to optimize the number of mask multiplications for conventional SWI.12
We simulated the data by creating magnitude and phase image pairs for different TEs. At a given TE, signal magnitude was calculated according to S(TE) = S0 exp(−TE/T2*). Phase was calculated as (frequency)×(TE). Each magnitude and phase pair was converted into real and imaginary images, to each of which normally distributed noise with a standard deviation of 18 was added to ensure comparable signal-to-noise in simulated data when compared with periventricular WM by use of our acquisition parameters. The noisy real and imaginary images were then converted back to magnitude and phase.
We simulated a multiecho dataset by creating magnitude/phase pairs for TEs of 10, 17, 24, 31, 38, and 45 ms. From the same simulated multiecho data, 1 multiecho SWI image was generated according to each of the 4 possible combinations of multiecho postprocessing scheme (postaverage and frequency-based) and mask function (linear and nonlinear).
We simulated single-echo data by creating 1 magnitude/phase pair at a TE of 20 ms. Noise was decreased by a factor of 20.5 to simulate decreased noise accompanying the reduction in bandwidth from 160 Hz/pixel in the multiecho acquisition to 80 Hz/pixel in the single-echo acquisition. In addition, the WM S0 was decreased by 16% to account for the reduction in the steady-state signal accompanying the decrease in TR. For the simulated single-echo data, a single SWI image was produced with each mask function.
Contrast was measured as the difference in mean signals between 2 ROIs in the SWI volumes: one placed in the vein compartment, and one in the WM compartment. The CNR was calculated as this contrast divided by the standard deviation of the signal in the latter ROI, which is the standard definition of CNR used in SWI numeric optimization.12
Visual Optimization
Values of m were also optimized by 3 radiology residents, each with 29 months of experience, who rated SWI images from 4 volunteers. For each volunteer, image volumes included each of the 6 SWI combinations processed with a range of m values. Images processed with the linear mask function were processed with m's from 0–11, incremented in steps of 1. Images processed with the nonconventional filter were processed with m's from 0–55, incremented in steps of 5. This larger range and coarser increment of m values were found to yield a similar range of contrasts to the images processed with the conventional mask. Raters were shown 24 sets of 12 volumes. The raters were not blinded to the value of m, but each set was presented in a random order to ensure that experience from early sets did not influence the rating of later sets. Rating instructions were as follows: “For each set, identify the single value of m which is optimal. When considering optimal m, consider SWI quality from a radiologic standpoint. Please consider how structure contrast as well as image noise is affected by choice of m. Specifically, you should consider the visibility of veins (both small veins such as those at the lateral ventricles, and large veins) as well as other structures that may be targeted with SWI, such as: red nucleus, subthalamic nucleus, globus pallidus.” Each rater performed rating independently. To evaluate interrater agreement, a 2-way mixed-average measures interclass correlation coefficient was calculated for the pooled ratings.
ROI Analyses
For in vivo data, ROI analyses were used to compare optimized SWI techniques. For each participant, ROIs were drawn in the right hemisphere of single-echo, linearly masked SWI volume and propagated into the other volumes. Signal-to-noise ratio was approximated in the frontal WM of all participants as the mean divided by standard deviation of the signal in the ROI. CNR was measured between various anatomic structures (globus pallidus [GP], optic radiations [OR], periventricular veins, subthalamic nucleus [STN], and red nucleus [RN]) and the adjacent WM as the difference between mean values of signal in 2 ROIs (one in the structure of interest, one in the adjacent WM) divided by the standard deviation of signal in the WM ROI.
Visual Comparison
The same 3 raters evaluated the optimized SWI images with respect to visibility of the different structures. For each of the 10 volunteers, the 6 different SWI volumes were assigned a random letter for blinding purposes. Raters were instructed to rank the volumes from best (rank 1) to worst (rank 6) for different structures. Specific instructions were “consider: the contrast of the structure with surrounding tissue, the ability to resolve its borders, and how image noise influences visibility.” Visibility was ranked for the same structures in which CNR was measured. The qualitative impression of SNR in the frontal WM was also ranked. Images were rated for severity of artifacts at the sinuses from least severe (rank 1) to most severe (rank 6).
To evaluate interrater agreement, we calculated the interclass correlation coefficient on rankings of each structure analyzed. For each volunteer, for each combination of processing scheme and mask function, the 3 ranks assigned by the raters were averaged to create a mean rank. To separately test the significance of the 2 main effects (processing scheme and filter), for each level of each main effect, we added mean ranks across all levels of the other main effect. Nonparametric-related samples tests were then used to compare all levels of a given effect: the Friedman test for scheme and the Wilcoxon signed-rank test for filter. Where appropriate, the Wilcoxon test was used post hoc with Bonferroni correction.
Results
Optimization of m
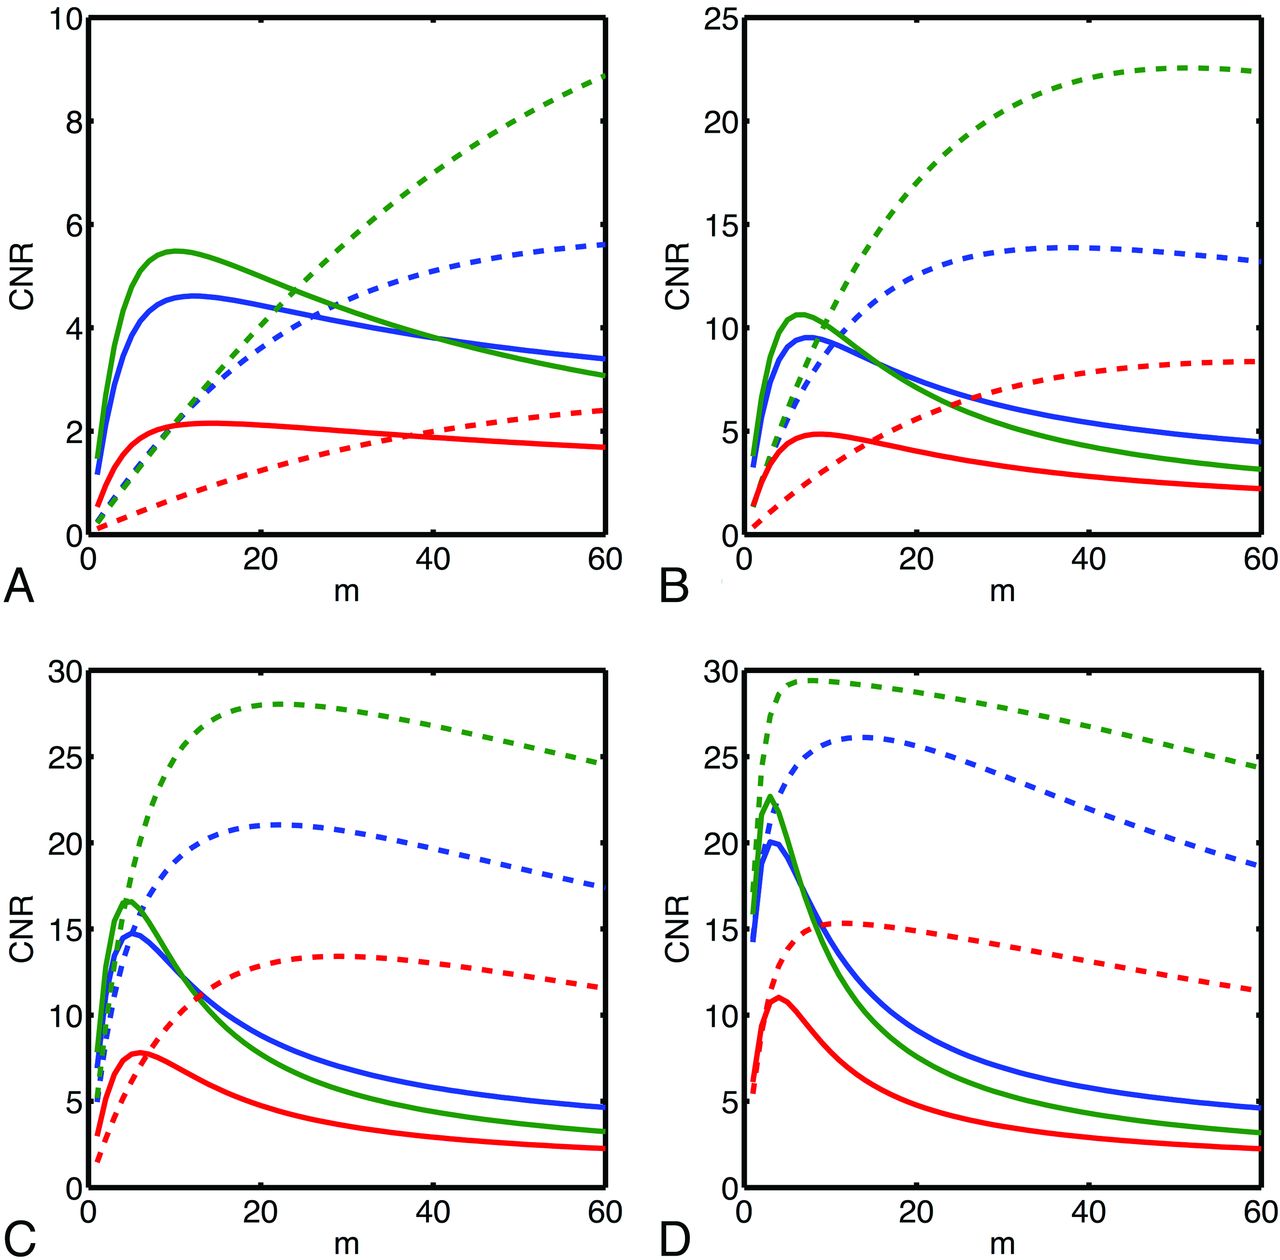
Plots of CNR as a function of m are presented (Fig 1) for several different choices of the frequency of the vein compartment of the numeric phantom. Optimal values of m depend strongly on the frequency of the vein; minimal and maximal values of optimal m over the range of frequencies investigated are presented in the accompanying Table. According to simulation, greater CNR is achievable with the nonlinear mask, though typically larger values of m are required. Simulation predicts that the frequency-based method allows the greatest CNR and that both multiecho methods are superior to single-echo SWI.

CNR vs number of mask multiplications (m) for different SWI postprocessing schemes (red: single-echo, blue: postaverage, green: frequency-based) and mask functions (solid: linear, dashed: nonlinear) as simulated for a vein of varying frequency in WM. Simulated frequencies were −1.0 Hz (A), −2.5 Hz (B), −5 Hz (C), and −10.0 Hz (D).
Optimization of m
Optimization of m was also performed via visual rating of images. For measurement of the optimal value of m for a given processing combination, the median (across the 4 volunteers) of the median (across the 3 raters) is reported in the Table. In all cases, the optimal value as determined by the raters falls within the range of optimal values predicted by simulation. The interclass correlation coefficient was found to be 0.96, indicating excellent interrater agreement. When implementing different SWI techniques herein, we use the values of m that are determined to be optimal by the raters.
In Vivo Data
Minimum intensity projections through 4 mm for a subset of a section at the level of the basal ganglia are shown in Fig 2 for all permutations of postprocessing scheme and mask function. An increase in SNR is apparent when single-echo images are compared with multiecho images. In general, the nonlinear mask function results in improved noise characteristics compared with the linear filter, and its use also dramatically enhances contrast in some regions (eg, for large veins [arrow in Fig 2F] and at the edges of the basal ganglia [arrowheads in Fig 2F]). Small veins that are not visible in single-echo SWI are readily detected in all implementations of multiecho SWI, such as at the horns of the ventricles (arrows in Fig 2B), though their appearance is smoother and more continuous when the linear filter and/or postaverage processing is used.

Minimum intensity projections through 4 mm at the basal ganglia for different SWI postprocessing schemes (first column: single-echo, second column: postaverage, third column: frequency-based) and mask functions (first row: linear mask, second row: nonlinear mask).
ROI Analyses
Normalized measurements of SNR and CNR are presented in On-line Fig 1. The nonlinear mask function results in a significantly larger SNR or CNR (P < .05 for GP, P < .01 for periventricular veins, STN; P < .001 for frontal WM, OR, or RN). The frequency-based scheme results in a significantly larger CNR or SNR than both postaverage and single-echo techniques, except for GP, where no significant difference is detected between postaverage and frequency-based processing, though both result in a significantly larger CNR than single-echo. Specific P values are presented for pair-wise comparisons of the processing scheme in On-line Fig 1.
Visual Comparison
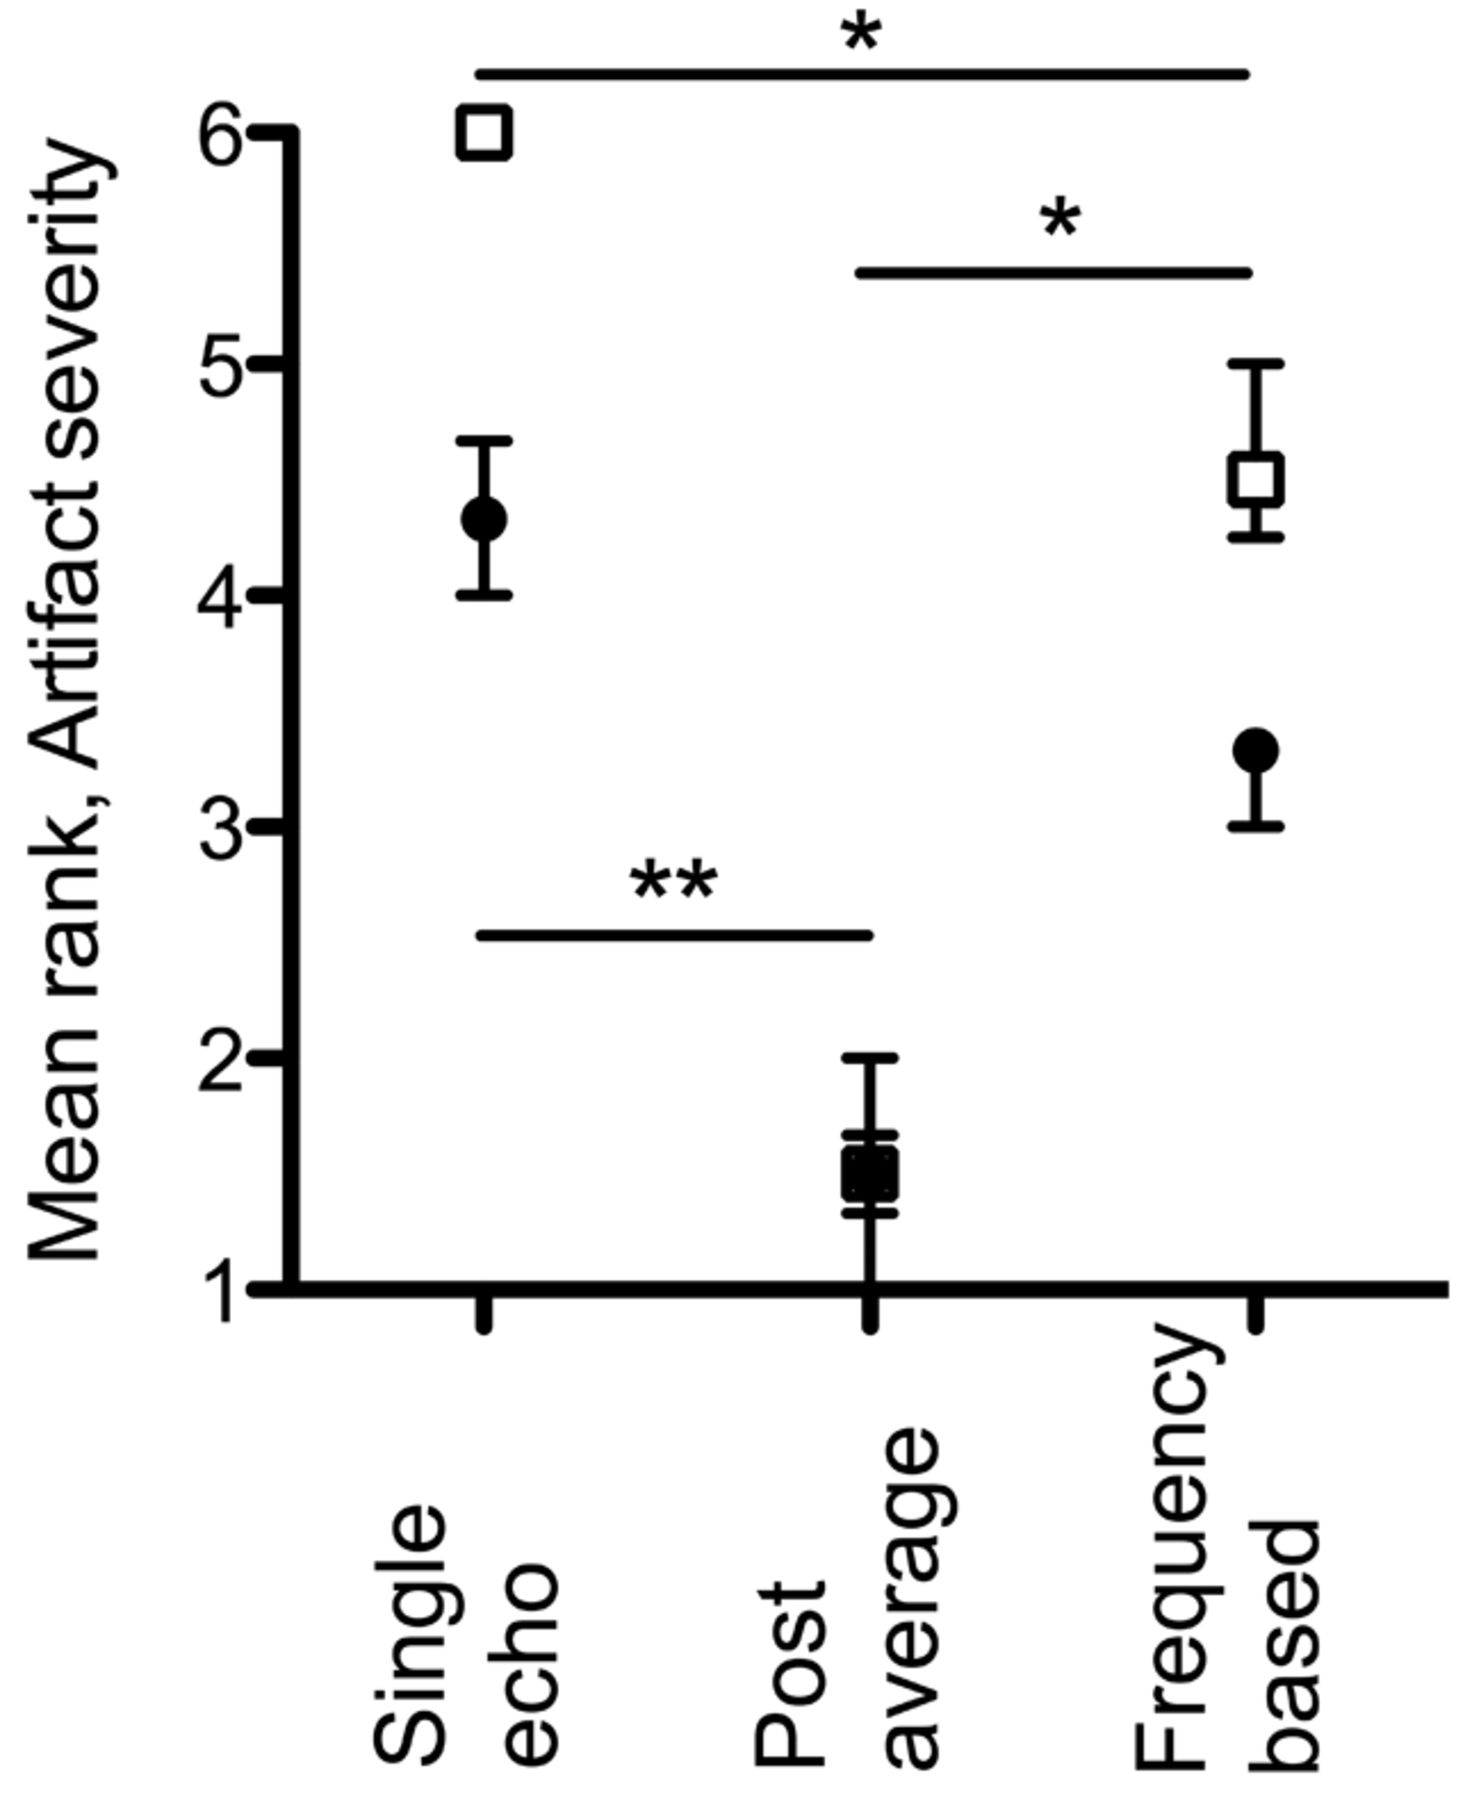
Mean ranks are presented (On-line Fig 2) for qualitative impression of SNR of the frontal WM, and for visibility of various structures. For all paramagnetic perturbers (GP, STN, RN, and periventricular veins), the linear filter resulted in significantly (P < .001) greater visibility (equivalently, lower mean rank). The postaverage scheme resulted in significantly lower mean ranks than both frequency-based and single-echo schemes for these structures as well—except for the periventricular veins, where no significant differences were observed between postaverage and frequency-based processing. In contrast, for visibility of OR and SNR of the frontal WM, the nonlinear filter was ranked as significantly better (P < .001). For OR, the frequency-based scheme was significantly better than both single-echo and postaverage schemes. Specific P values are presented for pair-wise comparisons of the processing scheme in On-line Fig 2. Mean ranks of artifact severity are presented (Fig 3). In general, the linear mask function results in less severe artifacts, (P < .001); the postaverage scheme results in least severe artifacts. Interrater agreement, as assessed by the interclass correlation coefficient, was excellent (frontal WM, 0.88; GP, 0.93; OR, 0.85; periventricular veins, 0.82; STN, 0.91; RN, 0.93; artifacts, 0.96).

Mean rank of artifact severity at sinuses. Filled black circles: linear mask function; empty squares: nonlinear mask function. Points: median; bars: interquartile range (n=10). Illustrated are significant P values for pair-wise comparisons of postprocessing schemes (* P < .05, ** P < .01).
Discussion
This study presents a comparison of 1) different SWI processing schemes; and 2) different mask functions, in SWI image quality as assessed by ROI analysis and visual rating.
SWI Optimization
Our choice of m for implementation in human data was based on optimized values as determined by radiologist raters. This is justified for several reasons: 1) in all cases, rater-optimized values fell within the range of optimal m predicted by simulation; 2) raters were instructed to consider the influence of m not only on the veins but also on other structures and noise; 3) there was excellent interrater agreement; and 4) radiologists are the end-users of SWI. Our optimal m value for linearly masked single-echo (ie, conventional) SWI was 6. In contrast, conventional SWI is virtually always implemented with m=4. This choice is influenced by a seminal SWI study12 where CNR vs m was simulated for a comparable range of vein phases. As in our simulation, that study found that a lower m is required for maximal CNR for an increasingly large phase. Our raters found a slightly larger value of m to be most suitable. As our optimizations involved simulation and rating, they are more comprehensive than previous efforts. We have endeavored to choose values of m that are suitable for optimal visibility of a range of structures; however, if reoptimization is required for a specific application, it should be performed by trained raters.
In Vivo Data
For small veins, typical targets of SWI, ROI measurements in vivo agree with those predicted by simulation: optimal CNR can be achieved with the nonlinear mask implemented with a frequency-based processing scheme. This conclusion can be extended to a CNR of paramagnetic perturbers in general. However, according to visual assessment by trained raters, these same structures are most visible when SWI is performed with the linear mask and postaverage processing. This apparent contradiction highlights a discrepancy between CNR and the qualitative impression of visibility. Although the nonlinear filter and frequency-based scheme might independently result in more dramatic contrast (eg, at the edges of the GP in Fig 2), they do not necessarily increase the information content of the image compared with other implementations of multiecho SWI. Rather, their implementation can result in an image with harsher contrast wherein a more subtle structure is less apparent. Images appear “burnt out” when the contrast is too high, with scarce gradation in the grayscale, which was interpreted by raters as potential loss of information. It seems that maximal contrast should not be the exclusive target when visibility is being optimized.
The nonlinear mask function and frequency-based processing demonstrated best performance with respect to the frontal WM and OR, a diamagnetic perturber, as judged by both quantitative measures in ROI analyses, and visual ranking. For both the frontal WM and OR, we do not expect the mean signal in an ROI to change after multiplication with the described mask functions, given their zero or positive frequency, respectively. Therefore, the improved performance of nonlinear mask function and frequency-based processing for the frontal WM and OR can be attributed to the reduced noise introduced into the image in these regions by these postprocessing strategies, given the absence of changes in mean signal or contrast.
One limitation of multiecho SWI is increased scan time. Fewer echoes or reduced coverage could be used to reduce scan time. As an alternative, if coverage were expanded to allow imaging of the entire supratentorial brain, scan time would be on the order of 20 minutes. In addition to SWI, it is possible to obtain many contrasts from this acquisition, including R2* maps, frequency maps, and quantitative susceptibility maps. Given the high-yield nature of this acquisition, the parameters recommended here are not unreasonable in a clinical setting.
Field Inhomogeneity Artifacts
Multiecho SWI processing, in particular postaverage, typically resulted in less severe field inhomogeneity artifacts compared with single-echo SWI. Denk and Rauscher8 showed that, by using a filter width that varies with TE, field inhomogeneity artifacts could be reduced further in postaverage processing while preserving contrast elsewhere in the image. To limit the matrix of comparisons in our present study, we elected not to investigate the effects of an adaptive filter, though we expect its use would result in further reduction of these artifacts.
Prospective Applications
Ultimately, our recommendation for SWI implementation depends on the desired application and allowed time. It is certainly clear that any implementation of multiecho SWI results in superior images to single-echo SWI.
For radiologic use, postaverage processing and the linear filter are favored. Given its favored performance for visualization of paramagnetic perturbers, this implementation of multiecho SWI seems especially well suited to the study of neurodegenerative diseases in which iron deposition is implicated. In addition, this technique might have a role in the study of traumatic brain injury, stroke, and other conditions where abnormalities in the vasculature or blood products are involved. One specific diagnostic application is assessing the presence of veins within WM lesions. At 7T, this has been demonstrated to be specific to multiple sclerosis13; however, current techniques at 3T lack the sensitivity to delineate such veins. Optimized multiecho SWI holds promise for reproducing these findings at clinical field strengths.
In our study, volunteers were free of pathologic conditions, and raters were thus only able to evaluate the visibility of normal structures. It is possible that the high-contrast, low-noise properties of either (or both) frequency-based processing and the nonlinear filter may facilitate more rapid detection of very subtle pathologic conditions such as microbleeds. As an alternative, although frequency-based, nonlinearly filtered SWI may be undesirable for radiologic assessment, such an image may be optimal for automated tasks where high contrast and low noise would be favored, such as STN segmentation for electrode targeting, computer-based delineation of veins, or registration tasks.
Conclusions
Linearly masked postaverage SWI is the recommended implementation of multiecho SWI for radiologic use; however, nonlinearly masked frequency-based SWI may have use in computer-based segmentation or registration. A discrepancy between measures of CNR and subjective impressions of visibility was found, highlighting an important caution for SWI optimization.
Footnotes
Disclosures: Matthew Quinn—RELATED: Grant: CIHR operating grant.* Amy Lin—RELATED: Grant: CIHR operating grant.* Jeffery Bird—RELATED: Grant: CIHR operating grant.* Stephanie Leung—RELATED: Grant: CIHR.* Ravi Menon—RELATED: Grant: CIHR,* Comments: Operating grant that supported this research; UNRELATED: Grants/Grants Pending: Ontario Research Fund.* * Money paid to institution.
This work was supported in part by grants from the Canadian Institutes of Health Research (MOP-111085) and Canada Research Chairs Program (R.S.M.), and from the Vanier Canada Graduate Scholarships Program (M.P.Q).
Paper previously presented at: Annual Meeting of International Society for Magnetic Resonance in Medicine, May 10, 2012; Melbourne, Australia.
Indicates open access to non-subscribers at www.ajnr.org
REFERENCES
- Received December 13, 2012.
- Accepted after revision February 14, 2013.
- © 2014 by American Journal of Neuroradiology


Jump to section
Related Articles
Cited By...
- No citing articles found.