
Abstract
BACKGROUND AND PURPOSE: Although NAA is often used as a marker of neuronal health and integrity in neurologic disorders, its normal response to physiologic challenge is not well-established and its changes are almost always attributed exclusively to brain pathology. The purpose of this study was to test the hypothesis that the neuronal cell marker NAA, often used to assess neuronal health and integrity in neurologic disorders, is not confounded by (possibly transient) physiologic changes. Therefore, its decline, when observed by using 1H-MR spectroscopy, can almost always be attributed exclusively to brain pathology.
MATERIALS AND METHODS: Twelve healthy young male adults underwent a transient hypercapnia challenge (breathing 5% CO2 air mixture), a potent vasodilator known to cause a substantial increase in CBF and venous oxygenation. We evaluated their whole-brain NAA by using nonlocalizing proton MR spectroscopy, venous oxygenation with T2-relaxation under spin-tagging MR imaging, CBF with pseudocontinuous arterial spin-labeling, and the cerebral metabolic rate of oxygen, during normocapnia (breathing room air) and hypercapnia.
RESULTS: There was insignificant whole-brain NAA change (P = .88) from normocapnia to hypercapnia and back to normocapnia in this cohort, as opposed to highly significant increases: 28.0 ± 10.3% in venous oxygenation and 49.7 ± 16.6% in global CBF (P < 10−4); and a 6.4 ± 10.9% decrease in the global cerebral metabolic rate of oxygen (P = .04).
CONCLUSIONS: Stable whole-brain NAA during normocapnia and hypercapnia, despite significant global CBF and cerebral metabolic rate of oxygen changes, supports the hypothesis that global NAA changes are insensitive to transient physiology. Therefore, when observed, they most likely reflect underlying pathology resulting from neuronal cell integrity/viability changes, instead of a response to physiologic changes.
ABBREVIATIONS:
- CMRO2
- cerebral metabolic rate of oxygen consumption
- pCASL
- pseudocontinuous arterial spin-labeling
- TRUST
- T2-relaxation under spin-tagging
- WBNAA
- whole-brain NAA
- Yv
- venous oxygenation
Proton MR spectroscopy (1H-MR spectroscopy) allows noninvasive quantitative in vivo assessment of brain metabolites.1,2 The most prominent metabolite in water-suppressed 1H-MR spectroscopy is the amino acid derivative NAA, synthesized in neuronal mitochondria from acetyl coenzyme A and L-aspartate by a membrane-bound enzyme.3 Although its precise function is still not fully known, possible roles include lipogenesis in myelination, ion balance, neuromodulation, and neuronal mitochondria energy metabolism.4 Because it is almost exclusive to neurons and their processes (<10% contribution from glia and extracellular fluid),5 NAA is considered a putative marker of their integrity.4,6 Indeed, with the exception of Canavan disease,7 nearly all brain pathologies show local or global NAA decline due to degeneration or metabolic impairment.2,6,8
Use of NAA as a marker of neuronal health, however, involves 2 implicit assumptions: 1) its concentration is insensitive to (possible) transient physiologic changes of normal physiologic fluctuation; and 2) detectable changes must, therefore, reflect only underlying pathology. Although stable NAA levels are reported in response to aerobic exercise,9 verbal memory performance,10 and caffeine ingestion11 and alcohol consumption in healthy humans,12 and prolonged hypoglycemia in the rat brain,13 these 2 assumptions are made for expediency because little is known of the response of NAA to other physiologic challenges.6,14
Given its utility as a neuronal marker, our goal in the present study was to test the hypothesis that the global NAA concentration remains stable even under a substantial physiologic challenge that leads to otherwise easily detectable changes in other MR imaging metrics. We chose the mild hypercapnia paradigm (5% CO2 by volume in inspired air) to test it for 5 reasons: First, it is a potent vasodilator, known to cause a dramatic, easily measurable 20%–50% increase in CBF.15,16 Second, it has quick (∼1 minute) onset and washout, making both states accessible within 1 MR imaging session. Third, its blood level can be reliably and instantly monitored by capnography. Fourth, animal studies have shown that NAA synthesis can be disrupted when O2 consumption and adenosine triphosphate production are decreased by inhibitors of the mitochondrial respiratory chain.17 Finally, it is also clinically and practically relevant for NAA quantification because patients with neurologic conditions often have irregular respiratory patterns during scans, which may lead to higher blood partial arterial CO2 pressure.
To test the hypothesis and to quantify the hereto unknown effects of hypercapnia on NAA, we used whole-brain NAA (WBNAA) nonlocalizing 1H-MR spectroscopy18,19 and compared its changes with those observed with other MR imaging modalities: T2-relaxation under spin-tagging (TRUST) and pseudocontinuous arterial spin-labeling (pCASL) perfusion MR imaging, to quantify variations in venous oxygenation (Yv), CBF, and the cerebral metabolic rate of oxygen consumption (CMRO2) in normocapnia (breathing room air) and during transient hypercapnia in healthy young adults.
Materials and Methods
Participants
Twelve healthy young men (30.5 ± 9.2 years of age; range, 23–48 years) were prospectively enrolled in this study. Only young men were chosen to remove possible age and sex effects on the acquired metrics. None were smokers or had a history of asthma or neurologic or psychological disorders before the scan, and all had “unremarkable MR imaging” findings determined by a neuroradiologist afterward. All were also instructed to not drink coffee for 6 hours before the study. All participants provided institutional review board–approved written informed consent.
1H-MR Spectroscopy WBNAA
The WBNAA 1H-MR spectroscopy was acquired in a 3T whole-body MR imaging scanner (Tim Trio; Siemens, Erlangen, Germany) by using a circularly polarized transmit-receive head coil (TEM3000; MR Instruments, Minneapolis, Minnesota). After optimizing the magnetic field over the whole head with our proton chemical shift imaging–based automatic procedure,20 we obtained the WBNAA with a nonlocalizing nonecho 1H-MR spectroscopy sequence18,19: TR/TE/TI = 10000/5/940 ms, 16 averages, 90° flip angle, ±1 KHz acquisition bandwidth. The use of TR≫T1 and TE≈0 ensured insensitivity to (unknown) T1 and T2 variations, and whole-head volume of interest facilitates both a short, 2 minutes and 40 seconds, acquisition and an excellent signal-to-noise ratio, as seen in Fig 1.
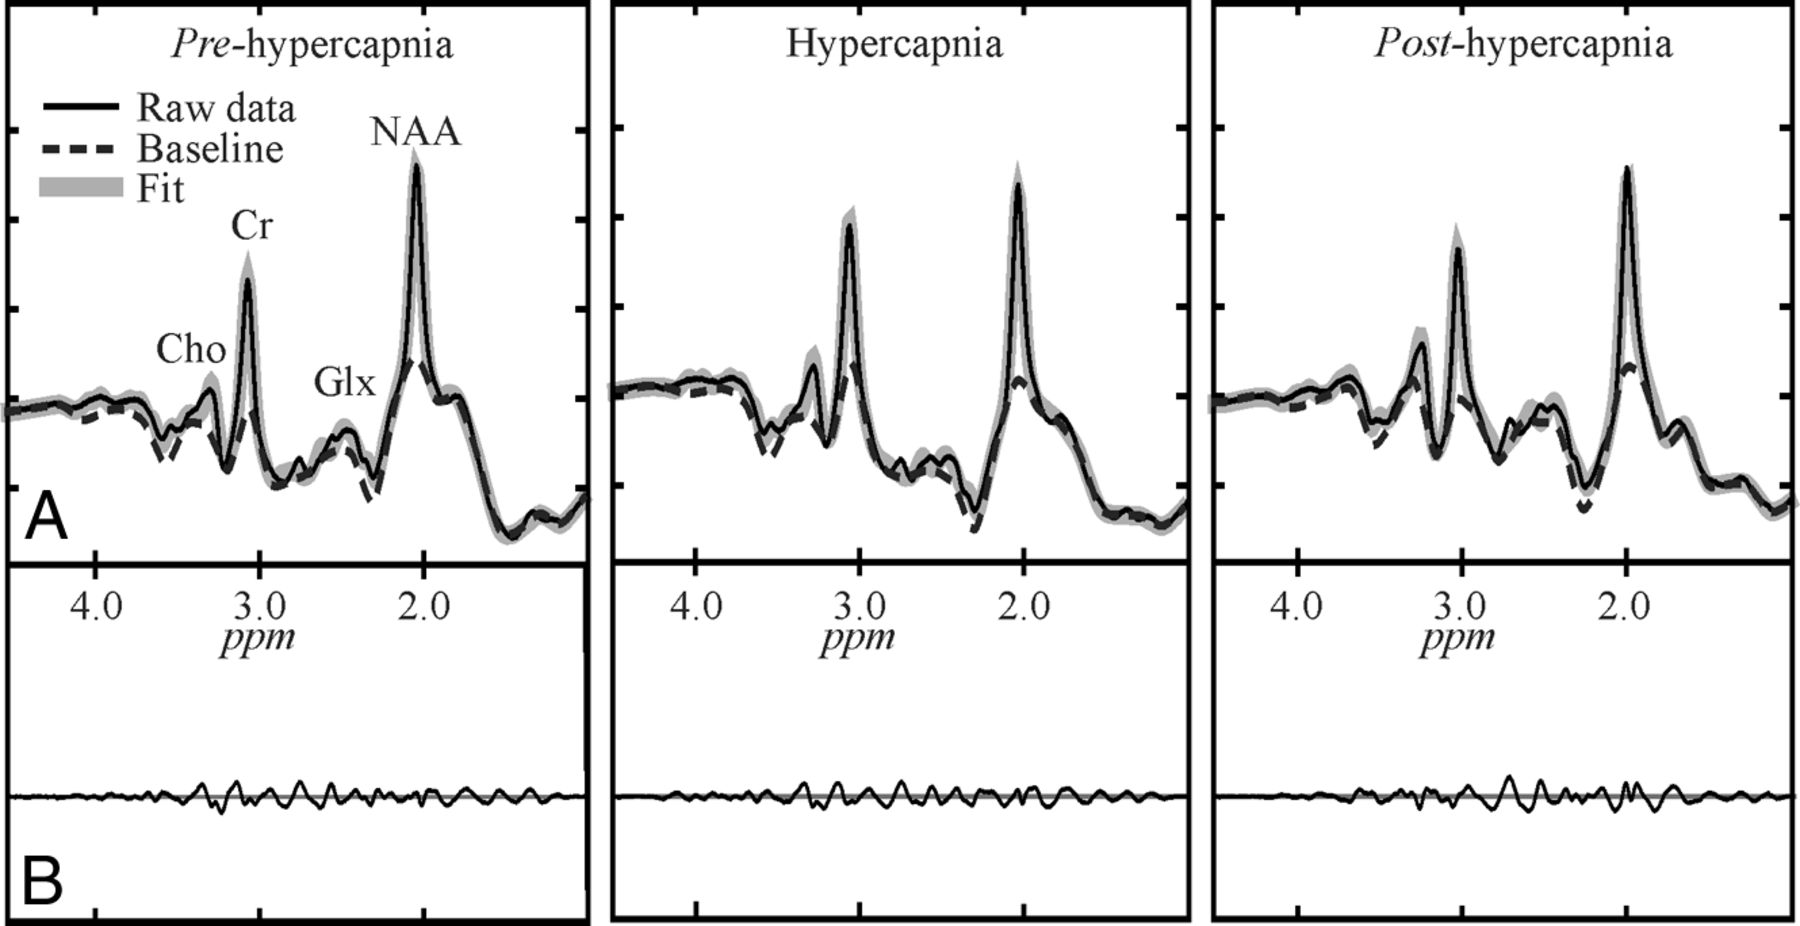
Automated spectral fitting of the pre- (left), during- (center), and posthypercapnia (right) WBNAA from 1 subject, all on the same intensity and chemical shift (parts per million [ppm]) scales. Top, A, Whole-head 1H-spectrum (thin black line), estimated baseline (dashed line), and fitted (metabolites + baseline) estimate (thick gray line). Bottom: B, Residual signals (raw-fitted data). Note: 1) The similarity of the pre-, during, and posthypercapnia spectra, suggesting a minimal effect of this physiologic challenge on the brain NAA; 2) the quality of the fit on A; and 3) the consequent vanishing residuals in B; and 4) although other metabolites are also visible in the spectrum, only NAA is implicitly localized by its biochemistry to just the brain.
MR Imaging Methods
All MR imaging examinations were performed in the same scanner by using a 12-channel array head coil. Clinical standard T1-weighted high-resolution (1 mm3) 3D-MPRAGE and T2-weighted MR imaging were performed on every subject to exclude brain abnormalities. Subsequently, 2 advanced quantitative MR imaging sequences, TRUST and pCASL, were applied to estimate global Yv and CBF, from which the CMRO2 was obtained.
TRUST uses spin-labeling to isolate pure venous blood signals and measures T2 value, which is converted to an O2 saturation fraction (Yv) with a calibration plot.21 TRUST MR imaging was performed with single-section EPI intersecting the lower superior sagittal sinus. Because this sinus drains most of the cerebrum, TRUST-obtained Yv is essentially a global metric. Acquisition parameters were 3.6 × 3.6 × 5 mm3 voxels; TR = 8000 ms; TI = 1200 ms; 10-ms Carr Purcell Meiboom Gill sequence; 4 effective TEs = 0, 40, 80, and 160 ms; and 4:48-minute total acquisition time. The labeling slab was 50-mm-thick with a 25-mm gap between it and the imaging section.
CBF was obtained with perfusion imaging, by using the multisection pseudocontinuous arterial spin-labeling sequence covering the entire brain. This sequence was recently recommended by a white paper for clinical perfusion MR imaging.22 It is based on a single-shot gradient-echo EPI: TR/TE = 3900/17 ms; labeling duration = 1470 ms; postlabeling delay = 1230 ms; section thickness = 5 mm; 24 axial sections; 22 × 22 cm2 FOV; 64 × 64 matrix (3.4 × 3.4 × 5 mm3 voxels); integrated parallel acquisition technique factor of 2 and 52 measurements (26 pairs of label and control images) for a 3 minute and 35 second acquisition time. Arterial spin-labeling was performed 97 mm below the center-of-imaging volume approximately perpendicular to the internal carotid and vertebral arteries.
Experimental Procedures
The participants underwent WBNAA, TRUST, and pCASL MR imaging under normocapnia and hypercapnia (5% CO2, 21% O2, and 74% N2 mixture from a Douglas bag). Each was fitted with a nose clip, and the gas from each of the 2 sources was delivered through a 2-way nonrebreathing valve and mouthpiece combination (2600 series; Hans Rudolph, Shawnee, Kansas). Their end-tidal CO2 values, the CO2 concentration levels in the lung that approximate those in arterial blood (ie, partial arterial CO2 pressure), were recorded throughout the experiment at 2-second intervals with an MR imaging–compatible 9500 Multigas Monitor (Medrad, Indianola, Pennsylvania). The averaged end-tidal CO2 during each room air and hypercapnia scan was then calculated and reported.
The experimental paradigm comprised 1H-MR spectroscopy WBNAA (2:40 minutes), pCASL (3:35 minutes), and TRUST (4:48 minutes) during normocapnia then hypercapnia and additional posthypercapnia normocapnia for WBNAA only, to test whether hypercapnia-induced WBNAA change, if present, recovers. The time interval needed to reach a new steady-state after switching the gas from one condition to another was monitored in each subject and usually took less <1 minute.
Data Processing and Analyses
WBNAA.
Data processing and spectral fitting were performed by using the VeSPA software package (https://scion.duhs.duke.edu/vespa/project).23 The VeSPA-Analysis application was extracted from the 1H-MR spectroscopy data from the MR imaging scanner file format and applied a standard set of preset processing and spectral fitting parameters: Even time-signals were subtracted from the odd ones, the pairs were summed, and the spectral data were fitted parametrically by using the automated algorithm described previously.19,24,25 The metabolite basis set for the parametric fit (synthesized with the VeSPA-Simulation application by using the radiofrequency pulses and timings from the actual WBNAA sequence) included the total-NAA (NAA + NAA-glutamate at a 7:1 ratio), glutamate, glutamine, total Cho, total Cr, and mIns. The latter 5 were included in the parametric model as known “nuisance signals” to simplify the use of wavelet filtering to account for nonparametric residual baseline signals. The inter- and intrasubject WBNAA signal area variability with this approach is ±12% and ±7%.19 Because only within-subject changes from normocapnia to hypercapnia were sought for comparison, only percentage variations in WBNAA levels are reported in this study.
pCASL.
The difference between the label and control images was calculated, and the CBF map produced normocapnia and hypercapnia by using a previously described perfusion kinetic model22,26:
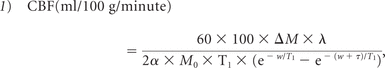 where ΔM is the difference signal between control and labeling states; λ = 0.9 mL/g is the blood/tissue water partition coefficient; α = 0.86 is the labeling efficiency of pCASL at 3T22,26; M0 is the equilibrium magnetization of brain tissue during the nonlabeled condition, after accounting for blood T1 (1600 ms) at 3T27; w is the postlabeling delay, which is different for individual sections (1.23-second + section acquisition delay)27; and τ is the labeling duration (1.47 seconds in our data). To obtain the average CBF map for each breathing condition, we transformed each individual's images into the Montreal Neurological Institute template of 152 space-masking brain-only regions and spatially smoothed them by using a Gaussian kernel (8-mm full width at half maximum). GM CBF values were computed by overlaying the tissue mask (defined as 70% probability of being GM) on the normalized CBF maps. Global CBF was also computed by overlaying the whole-brain mask, excluding the CSF, on the normalized CBF maps, and it was obtained an averaged CBF over all sections including both GM and WM.
TRUST and CMRO2.
For Yv estimates, the TRUST data were processed by using in-house Matlab (MathWorks, Natick, Massachusetts) scripts based on a previously described algorithm.21 Briefly, these images were motion-corrected and pair-wise subtracted (control-labeled images), resulting in a pure blood signal in the lower superior sagittal sinus. The averaged venous blood signal for each effective TE was fitted to a monoexponential model to obtain a blood T2, which was converted to Yv via a calibration plot established with in vitro blood by using subject-specific hematocrit values. CMRO2 (micromole O2/100 g tissue/minute) was then estimated by using the Kety-Schmidt method,28
 where CBF is expressed in milliliters/100 g/minute and is obtained from the pCASL data; Ya is the percentage of arterial oxygenation obtained by using finger pulse oximetry; and Ca the amount of oxygen a unit volume of blood can carry, assumed to be 856.2 μmol/100 mL. Note that because CBF and Yv are global metrics, so is the CMRO2 from either the GM or whole brain.
Statistical Analyses
Kolmogorov-Smirnov tests were used to determine data distributions. Paired-samples t tests were performed to look for differences between hypercapnia and normocapnia in WBNAA, Yv, global CBF, GM CBF, global CMRO2, and GM CMRO2. P < .05 was considered significant. All analyses were performed with SPSS for Windows, Version 15.0 (IBM, Armonk, New York).
Results
The end-tidal CO2 and MR imaging/MR spectroscopy metrics for normocapnia and hypercapnia and their comparisons are summarized in the Table. As expected, the end-tidal CO2 increased significantly from normocapnia to hypercapnia: 44.4 ± 4.1 to 52.9 ± 2.4 mm Hg for WBNAA, 40.6 ± 4.9 to 49.4 ± 3.9 mm Hg for pCASL, and 43.3 ± 4.7 to 52.5 ± 2.9 mm Hg for TRUST (P < 10−4 for all). The average range of end-tidal CO2 changes during the 3 scans was tight: between 8 and 9 mm Hg.
Summary of ETCO2 and MRI metrics (mean) for normocapnia and hypercapnia
WBNAA
Our automatic shimming yielded a 27 ± 4 Hz whole-head water line width in <5 minutes. Sample whole-head 1H-MR spectroscopy during normocapnia, hypercapnia, and subsequent normocapnia are shown in Fig 1, and their distribution for all 12 subjects is shown in Fig 2A. On the basis of paired-samples t tests, there were insignificant 2.7 ± 15.1% changes from normocapnia to hypercapnia and 0.6 ± 18.2% from pre- to posthypercapnia normocapnia (P = .88), as shown in Fig 2B.
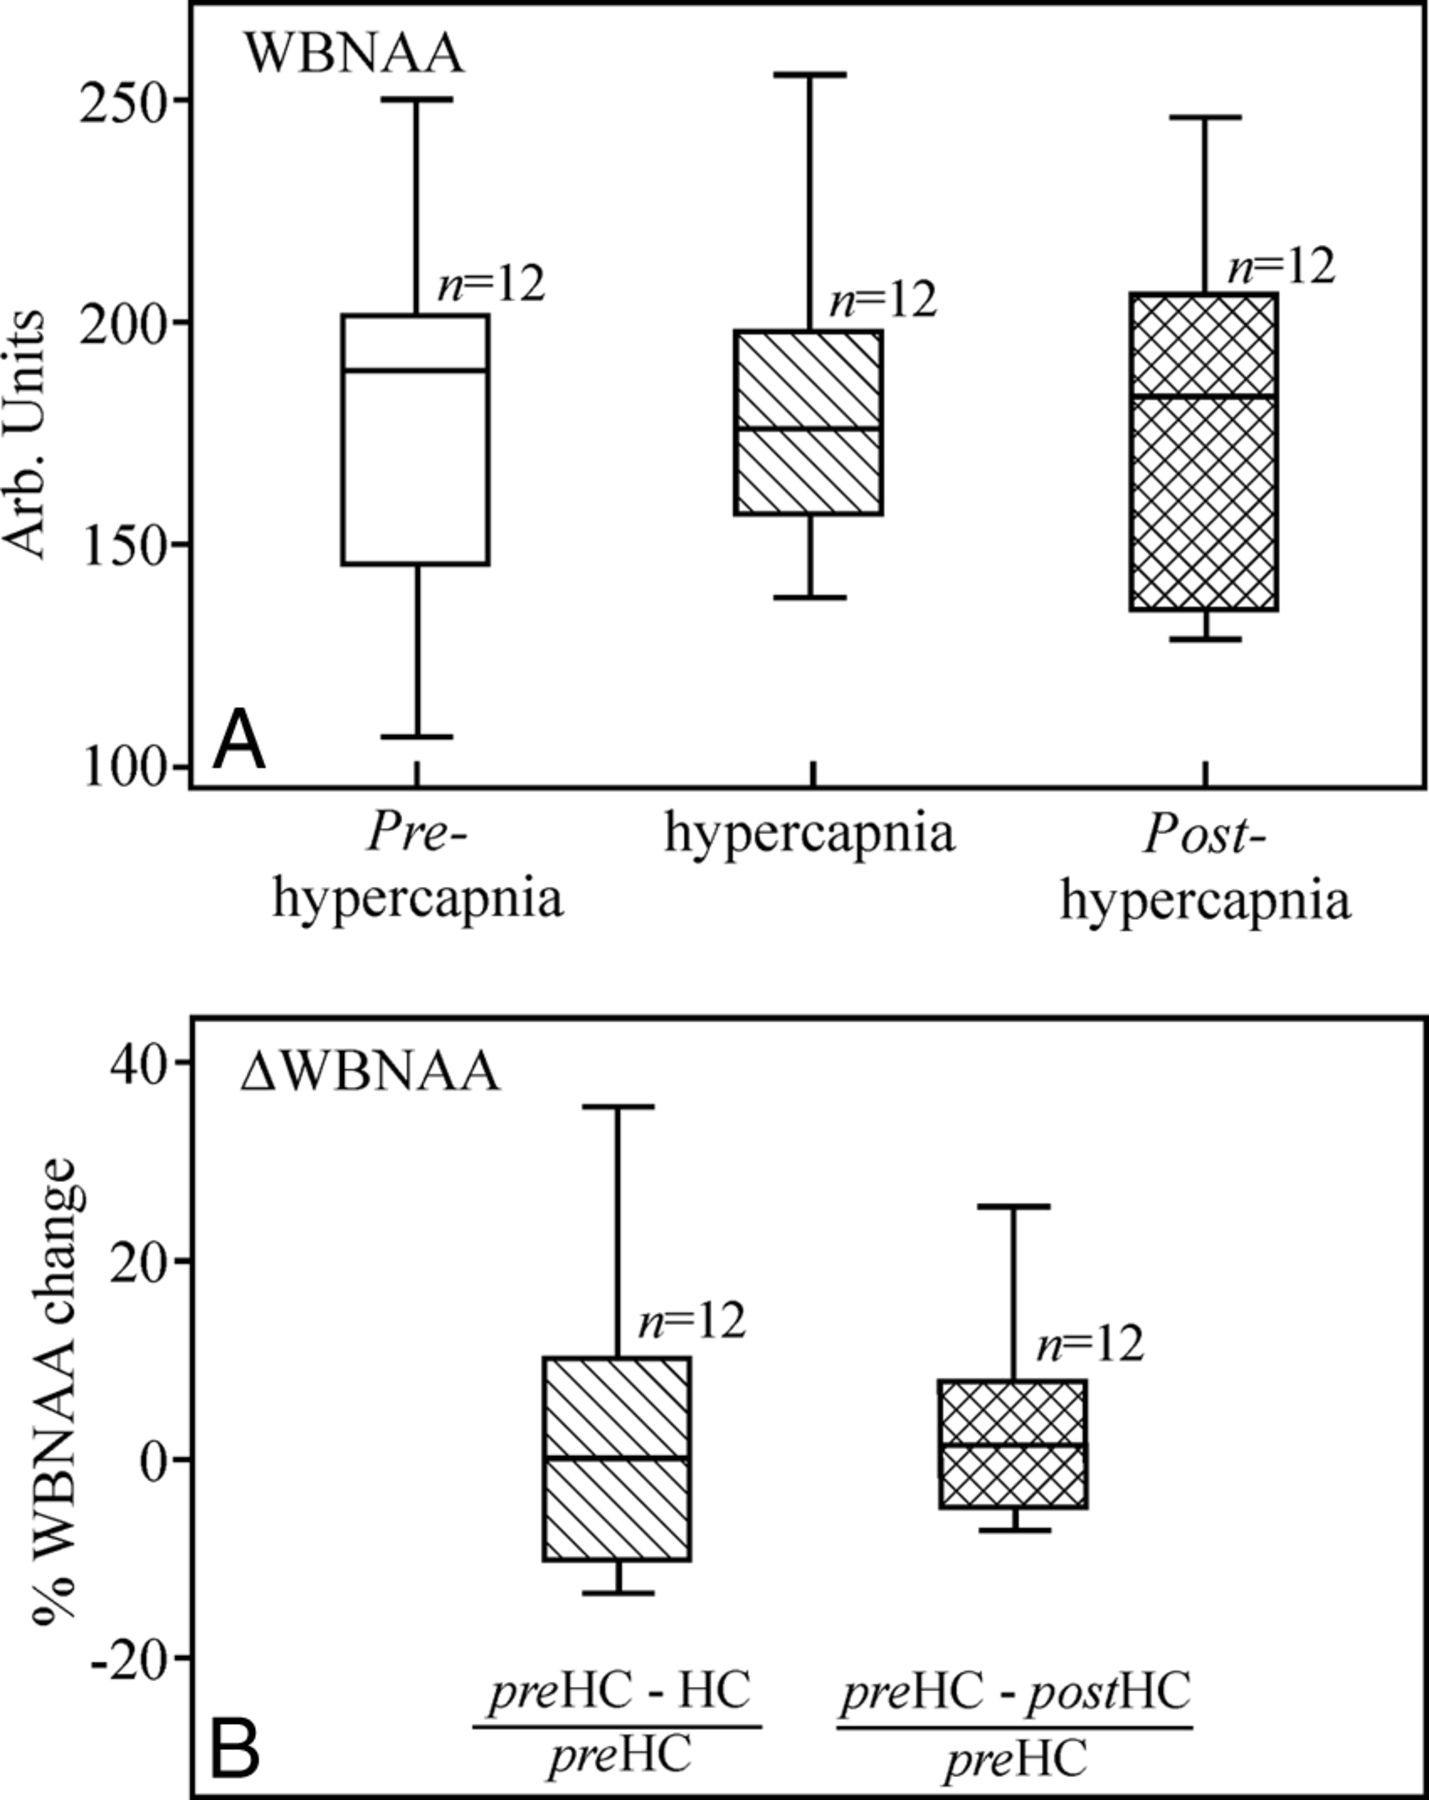
A, Boxplots showing the first, second (median), and third quartiles (box) and ±95% (whiskers) of the WBNAA distributions at normocapnia (white), hypercapnia (hatched), and posthypercapnia (cross-hatched). Note the insignificant WBNAA changes (P = .676). B, Boxplots show the percentage of NAA change from baseline normocapnia distribution of the 12 subjects. Note the ∼0% change from normocapnia (preHC) to hypercapnia (HC) (hatched) and from the former to the posthypercapnia (postHC) normocapnia (cross-hatched), underscoring the negligible NAA change as a response to the physiologic CO2 challenge. Arb indicates arbitrary.
pCASL
The average global CBF maps during normocapnia and hypercapnia from all 12 subjects are shown in Fig 3. There was a highly significant 49.7 ± 16.6% increase in global CBF from 33.9 ± 6.3 mL/100 g/min in normocapnia to 50.2 ± 6.9 mL/100 g/min in hypercapnia (P < 10−4), as shown in Fig 4A. Similarly, GM CBF increased a significant 40.0% from 45.3 ± 7.4 mL/100 g/min at normocapnia to 63.0 ± 8.6 mL/100 g/min at hypercapnia (P < 10−4).

Average (n = 12) global CBF maps for 7 representative brain sections. Note the easily visible, ∼50% increase (P < 10−4) in CBF from normocapnia to hypercapnia.

Boxplots of the distributions of global CBF (A) and CMRO2 (B) at normocapnia (white) and hypercapnia (hatched). Note the significant (P < 10−4) ∼47% increases in global CBF and the 6.4% (P = .04) decrease in global CMRO2 from normocapnia to hypercapnia.
TRUST and CMRO2
The lower superior sagittal sinus blood T2 increased from 54.6 ± 8.9 ms at normocapnia to 85.0 ± 11.8 ms at hypercapnia, and the corresponding Yv increased from 56.4 ± 5.6% to 71.9 ± 4.8% (P < 10−4 for both). The global CMRO2 declined a significant 6.4 ± 10.9%: from 120.0 ± 23.9 μmol/100 g/min at normocapnia to 111.2 ± 18.9 μmol/100 g/min at hypercapnia (P = .04), as shown in Fig 4B. GM CMRO2 also decreased a significant 11.3 ± 11.6%, from 162.2 ± 40.1 μmol/100 g/min at normocapnia to 141.2 ± 24.7 μmol/100 g/min at hypercapnia (P = .01).
Discussion
The findings substantiate the hypothesis that WBNAA is insensitive to a physiologic challenge that otherwise leads to significant variations in Yv, CBF, and CMRO2. This finding suggests that neurons tolerate hypercapnia with unaltered structural or functional integrity. Consequently, blood partial arterial CO2 pressure fluctuations (eg, due to irregular respiratory patterns during 1H-MR spectroscopy scans) will likely have minimal effect on the NAA concentrations. Insensitivity to such an intense challenge suggests that NAA changes, when observed, most likely represent disease pathology and not physiology.
Hypercapnia is increasingly used to study cerebrovascular reactivity in clinical populations,29,30 as well as to calibrate blood oxygen level–dependent signal.31 Its well-known effect is a remarkable vasodilation leading to substantial CBF increase. Although the precise vasodilatory mechanism of CO2 in humans is not well-known, it is believed that it activates potassium–adenosine triphosphate channels in vascular smooth muscle, causing dilation.32 However, the effect of CO2 inhalation on neural activity or CMRO2 is unclear, and its results are controversial. Earlier studies showed constant CMRO2 at hypercapnia,28 whereas others found that it decreased,33,34 as in this study, or even increased.35 These findings may be due to different methodologies (eg, strength and duration of CO2 stimulus), use of anesthetic agents, and species studied. The large increase in CBF with mild reduction in CMRO2 under hypercapnia observed here suggests uncoupling of these metrics due to increased partial pressure of carbon dioxide acting primarily on adenosine receptors to dilate blood vessels.
It is nevertheless intriguing why, despite significant CBF increase and likely neuronal activity (CMRO2) decline, NAA levels remains constant, because it is known that under normal conditions, brain NAA level fluctuations are expected to link neuronal-to-mitochondrial activity.3 Indeed, animal studies have shown that NAA synthesis can be disrupted when O2 consumption and adenosine triphosphate production are decreased by inhibitors of the mitochondrial respiratory chain,17 and a marked reduction in mitochondrial respiratory activities was observed in rodents exposed to intermittent hypoxia/hypercapnia for several days.36 Together, these studies support the notion that relatively severe prolonged hypercapnia may have a detrimental effect on neuronal metabolism, leading to cell death, whereas in this study, the challenge was mild and its duration was short.
The above conjecture is also supported by the observed lack of NAA changes in the few other 1H-MR spectroscopy studies involving short physiologic challenges (eg, in response to aerobic exercise,9 verbal memory performance,10 and caffeine ingestion11 in healthy humans, and alcohol consumption12 and prolonged hypoglycemia in the rat brain13) consistent with neuronal and mitochondrial integrity preservation. Furthermore, because NAA accounts only for a very small fraction, <0.05%, of the overall glucose metabolism, and its turnover rate is slow,8 its concentration is also unaffected by extended hypoglycemia.13 These findings lend further support to the notion that NAA is not an energy-buffering store (hence, requiring quick response) for neuronal activity in normal tasks.13 At lower partial arterial CO2 pressure, a recent study found that induced acidosis plays a role in maintaining mitochondrial function, regulating its metabolic pathway to preserve adenosine triphosphate production.37 We believe that a relatively slower adaptive NAA metabolism may account for its preserved level despite a CMRO2 decrease, suggesting that NAA is a cellular integrity index, (ie, sensitive to the number of neurons per unit volume and their overall viability), while CMRO2 is a flux measure (ie, sensitive to instantaneous physiologic changes).
In the current study, we used WBNAA to assess the global variation in NAA during hypercapnia because of the global effect of CO2, which can be detected more reliably than single- or multivoxel MR spectroscopy methods, in particular when such an effect on NAA change is considered consistent among different regions. Our Yv and CMRO2 measures are also global indices, by which WBNAA results are expected to be more comparable with CMRO2 changes at the similar global level. Because most of the neurodegenerative diseases such as Alzheimer disease, amyotrophic lateral sclerosis, multiple sclerosis, and frontotemporal dementia are widespread in nature and involve more extended regions than previously understood, it is also more sensible to assess global variation in NAA levels following a physiologic challenge. Using a single-voxel technique, previous studies have reported no significant regional NAA change with other physiologic challenges, which is consistent with our whole-brain NAA findings.9⇓⇓–12
Admittedly, this study also has several limitations: First, the hypercapnia challenge lasted only several minutes. However, it is known that acute challenges (eg, partial hypoxia in stroke,38) may lead to NAA decline in a matter of minutes, suggesting that the duration of our paradigm may be appropriate to affect a change if there was one. Higher than normal partial arterial CO2 pressure is common in subjects with chronic respiratory disorders, which may exist as comorbidities in patients with neurologic disorders during 1H-MR spectroscopy. Our study, by its design, excludes the effect on brain NAA from both prolonged hypoxia and elevated partial arterial CO2 pressure. Second, we restricted our study to young adult men, to remove (possible) age and sex differences in the metrics compared. However, the WBNAA insensitivity to hypercapnia in this cohort suggests that similar findings are expected in a more age- and sex-diverse group. Third, the whole-brain CBF values are slightly lower than those commonly reported because WM CBF is usually underestimated with arterial spin-labeling sequences. Because this study compared CBF between the 2 breathing conditions within a subject, however, its underestimation is expected to be similar between them.
Conclusions
Our study suggests that the NAA concentration is insensitive to even intensive transient physiologic challenges absent underlying pathology that affects the integrity or viability of these cells, meeting the requirement of a marker of neuronal cell integrity. The finding with this specific challenge paradigm is particularly germane to better understanding of NAA changes, specifically to NAA quantification when the subjects have an irregular breathing pattern during 1H-MRS acquisition, in which elevated partial arterial CO2 pressure can be seen.
Footnotes
Disclosures: Yulin Ge—RELATED: Grant: National Institutes of Health,* Comments: This work was supported by National Institutes of Health grants NS076588, NS029029-S1, MH084021, NS067015, AG042753, EB01015, and EB008387 and by the Center for Advanced Imaging Innovation and Research (www.cai2r.net), a National Institute of Biomedical Imaging and Bioengineering Biomedical Technology Resource Center: P41 EB017183. *Money paid to the institution.
This work was supported by National Institutes of Health grants NS076588, NS029029-S1, MH084021, NS067015, AG042753, EB01015 and EB008387 and by the Center for Advanced Imaging Innovation and Research (www.cai2r.net), a National Institute of Biomedical Imaging and Bioengineering Biomedical Technology Resource Center: P41 EB017183.
Indicates open access to non-subscribers at www.ajnr.org
REFERENCES
- Received February 10, 2015.
- Accepted after revision April 1, 2015.
- © 2015 by American Journal of Neuroradiology


Jump to section
Related Articles
Cited By...
- No citing articles found.