
Abstract
BACKGROUND AND PURPOSE: DSC perfusion has been increasingly used in conjunction with other contrast-enhanced MR applications and therefore there is need for contrast-dose reduction when feasible. The purpose of this study was to establish the feasibility of reduced-contrast-dose brain DSC perfusion by using a probabilistic Bayesian method and to compare the results with the commonly used singular value decomposition technique.
MATERIALS AND METHODS: Half-dose (0.05-mmol/kg) and full-dose (0.1-mmol/kg) DSC perfusion studies were prospectively performed in 20 patients (12 men; 34–70 years of age) by using a 3T MR imaging scanner and a gradient-EPI sequence (TR/TE, 1450/22 ms; flip angle, 90°). All DSC scans were processed with block circulant singular value decomposition and Bayesian probabilistic methods. SNR analysis was performed in both half-dose and full-dose groups. The CBF, CBV, and MTT maps from both full-dose and half-dose scans were evaluated qualitatively and quantitatively in both WM and GM on coregistered perfusion maps. Statistical analysis was performed by using a t test, regression, and Bland-Altman analysis.
RESULTS: The SNR was significantly (P < .0001) lower in the half-dose group with 32% and 40% reduction in GM and WM, respectively. In the half-dose group, the image-quality scores were significantly higher in Bayesian-derived CBV (P = .02) and MTT (P = .004) maps in comparison with block circulant singular value decomposition. Quantitative values of CBF, CBV, and MTT in Bayesian-processed data were comparable and without a statistically significant difference between the half-dose and full-dose groups. The block circulant singular value decomposition–derived half-dose perfusion values were significantly different from those of the full-dose group both in GM (CBF, P < .001; CBV, P = .02; MTT, P = .02) and WM (CBF, P < .001; CBV, P = .003; MTT, P = .01).
CONCLUSIONS: Reduced-contrast-dose (0.05-mmol/kg) DSC perfusion of the brain is feasible at 3T by using the Bayesian probabilistic method with quantitative results comparable with those of the full-dose protocol.
ABBREVIATIONS:
- cSVD
- block circulant singular value decomposition
- FD
- full-dose
- HD
- half-dose
- SVD
- singular value decomposition
DSC MR perfusion has been increasingly used to evaluate cerebral perfusion parameters in a variety of clinical applications, including acute ischemic infarction1⇓–3 and brain tumors.4,5
Most brain DSC perfusion studies are currently performed by using a gadolinium contrast dose of 0.1 mmol/kg.6 To accomplish multi-injection protocols, one can use a double dose (0.2 mmol/kg) of gadolinium or split the current standard dose (0.1 mmol/kg) in half. Yet there are several incentives to reduce the contrast dose for brain DSC perfusion: First, the necessity to perform multiple contrast-enhanced sequences in routine neurodiagnostic MR imaging applications. For example, in patients presenting with acute ischemic stroke, a combination of contrast-enhanced MR angiography and DSC perfusion can improve the imaging-protocol acquisition speed.7,8 In patients with brain tumors, the addition of a dynamic contrast-enhanced DSC perfusion scan may provide complementary diagnostic information.9,10 The second incentive is the direct relationship between the risk of nephrogenic systemic fibrosis and contrast dose.11 The third is the potential to reduce overall health care costs.
Contrast-dose reduction for DSC perfusion is challenging.6,12,13 Some investigators have explored the possibility of dose reduction to 0.05 mmol/kg at 3T with mixed results.14,15 The lower SNR associated with a reduced contrast dose remains a major limiting factor.16 Deconvolution, routinely used for DSC analysis, may not be an ideal methodology because small changes in the concentration time curve may dramatically influence the response residue function.16,17 Reducing the contrast dose, with a resultant higher noise and lower SNR, can further accentuate this limitation. In contrast, the Bayesian probabilistic method is inherently less sensitive to low SNR18 conditions and has the potential to more accurately calculate cerebral perfusion in low-dose protocols.
The purpose of this study was to establish the feasibility of reduced-contrast-dose (0.05-mmol/kg) brain DSC perfusion at 3T by using the Bayesian method and to compare the results with a block circulant singular value decomposition (cSVD)19 analysis method, which is used routinely in clinical practice. If its potential is realized, the described protocol can add flexibility to multi-injection MR imaging protocols, such as those used for the evaluation of brain tumors and patients with stroke, without the need for additional contrast.
Materials and Methods
Patients
Twenty consecutive patients (12 men, 8 women; mean age, 39.4 years; range, 19–74 years) who were referred for contrast-enhanced MR imaging of the brain were prospectively enrolled. All examinations were performed in accordance with institutional review board guidelines with an approved study protocol. The clinical indication for MR imaging included the following: persistent headache (n = 7), dizziness (n = 4), signs and symptoms of multiple sclerosis (n = 4), and staging for the evaluation of intracranial metastasis in patients with a history of underlying cancer (n = 5).
Image Acquisition
Imaging was performed on a clinical 3T scanner (Magnetom Skyra; Siemens, Erlangen Germany). A 16-element array coil (head, n = 12; neck, n = 4) was used for signal reception. Our routine contrast-enhanced brain MR imaging protocol includes axial and sagittal T1, axial T2, FLAIR, gradient recalled-echo, DWI, DSC perfusion, and 3D T1 postcontrast sequences. Two sets of DSC perfusion data in each patient were obtained by using a gradient recalled-echo–EPI sequence with identical sequence parameters (TR/TE, 1450/22 ms; flip angle, 90°; FOV, 22 cm; matrix size, 128 mm; 4-mm sections × 30; generalized autocalibrating partially parallel acquisition with an acceleration factor of 3, 60 dynamic frames).
A total of 0.15 mmol/kg of gadolinium contrast was used for each patient. The first DSC perfusion scan was obtained after acquisition of conventional noncontrast images and following the intravenous injection of 0.05-mmol/kg gadolinium (labeled as half-dose [HD]). After an 8-minute interval, during which axial T2WI and 3D postcontrast T1WI were acquired, the second DSC perfusion image was obtained following intravenous injection of 0.1 mmol/kg of gadolinium (labeled full-dose [FD]). Each contrast injection was flushed with 15 mL of saline. A constant injection rate of 5 mL/s was used for contrast and saline flush injections in all studies by using an electronic power injector.
Image Analysis
With FDA-approved software (Olea Sphere; Olea Medical Solutions, La Ciotat, France), the arterial input function was selected automatically by using a cluster analysis algorithm20 and the deconvoluted perfusion parameters were calculated by using both the cSVD technique19 and Bayesian probabilistic methods.18
Parametric maps of CBF, CBV, and MTT from both FD and HD were generated and available for qualitative and quantitative analysis. In addition, the Bayesian framework allows estimation of the noise SD. Hence, a univocal estimation of the SNR, defined as the ratio between the postcontrast signal over the SD, was used for quantitative analysis of SNR.
Qualitative Analysis
The CBF, CBV, and MTT maps in both HD and FD were introduced in a random order and in separate sessions to a neuroradiologist who was blinded to the type of contrast injection scheme and method of postprocessing. A 4-scale image-quality score was used to evaluate the delineation of major structures such as ventricles, thalami, basal ganglia, and brain stem with respect to susceptibility-mediated distortion at tissue interfaces, noise, and motion: 1, poor image quality, not interpretable; 2, impaired image quality with substantial distortion and noise, limiting the delineation of major structures; 3, good image quality with minimal distortion, diagnostic image quality; and 4, excellent image quality with delineation of all structures.
Quantitative Analysis
The FLAIR images, CBF, CBV, MTT, and the SNR maps from FD and HD DSC studies for each patient were coregistered by the Olea Sphere software by using a 12-df transformation and a mutual information cost function. This step was followed by visual inspection to ensure adequate alignment.
Quantitative analysis was performed by 1 observer by using a region-of-interest-based analysis. Using FLAIR images for accurate identification of anatomic landmarks, we placed ROIs on the precentral gyrus and centrum semiovale to represent GM and WM, respectively. The ROIs were expanded automatically to the coregistered FD and HD studies in each individual. We automatically calculated the means ± SDs of CBF, CBV, MTT, and SNR and recorded them in each region of interest in cSVD- and Bayesian-calculated maps separately.
Statistical Analysis
Statistical analysis was performed by using MedCalc for Windows, Version 12.2.1 (MedCalc Software, Mariakerke, Belgium). The image-quality grading differences between cSVD- and Bayesian-calculated maps in both HD and FD were tested by the Wilcoxon rank sum test and the Spearman rank correlation. The quantitative analysis of CBF, CBV, and MTT in the HD and FD groups was tested by regression analysis and t test between cSVD- and Bayesian-calculated parameters. The significance level was defined as P < .05 (2-sided). Bivariate scatterplots ± 95% CIs and Bland-Altman plots were also generated.
Results
Qualitative Analysis
Of 20 patients, 15 had normal study findings, 2 had MR imaging findings of multiple sclerosis, 1 had an incidental meningioma, and 2 had chronic white matter ischemic changes. Table 1 summarizes the results of image-quality scores (median, range) in both the HD and FD groups by using cSVD and Bayesian methods.
Qualitative evaluation of perfusion parametric maps in full-dose (0.1-mmol/kg) and half-dose (0.05-mmol/kg) contrast groups processed with Bayesian and cSVD methodsa
In FD DSC studies, all (100%) CBF, CBV, and MTT maps derived from Bayesian and cSVD methods were of diagnostic image quality (score, ≥3). There was no significant difference for image quality scores between Bayesian- versus cSVD-derived CBF (P = .76), CBV (P = .6), and MTT (P = .12) maps. Spearman rank correlation coefficients (r) were 0.84, 0.69, and 0.53 for CBF, CBV, and MTT, respectively (Table 1).
In HD DSC studies, all (100%) Bayesian-processed perfusion maps were of diagnostic image quality (score, ≥3). While 100% of cSVD-calculated CBF maps had diagnostic image quality, CBV maps in 4 patients (20%) and MTT maps in 8 patients (40%) were rated nondiagnostic (score, 2) due to significant inhomogeneity across the FOV, obscuring delineation of major structures (Fig 1). There was a significant difference in image-quality scores for Bayesian- versus cSVD-derived CBV (P = .02) and MTT (P = .004) maps. Spearman rank correlation coefficients (r) were 0.66, 0.40, and 0.12 for CBF, CBV, and MTT, respectively (Table 1).
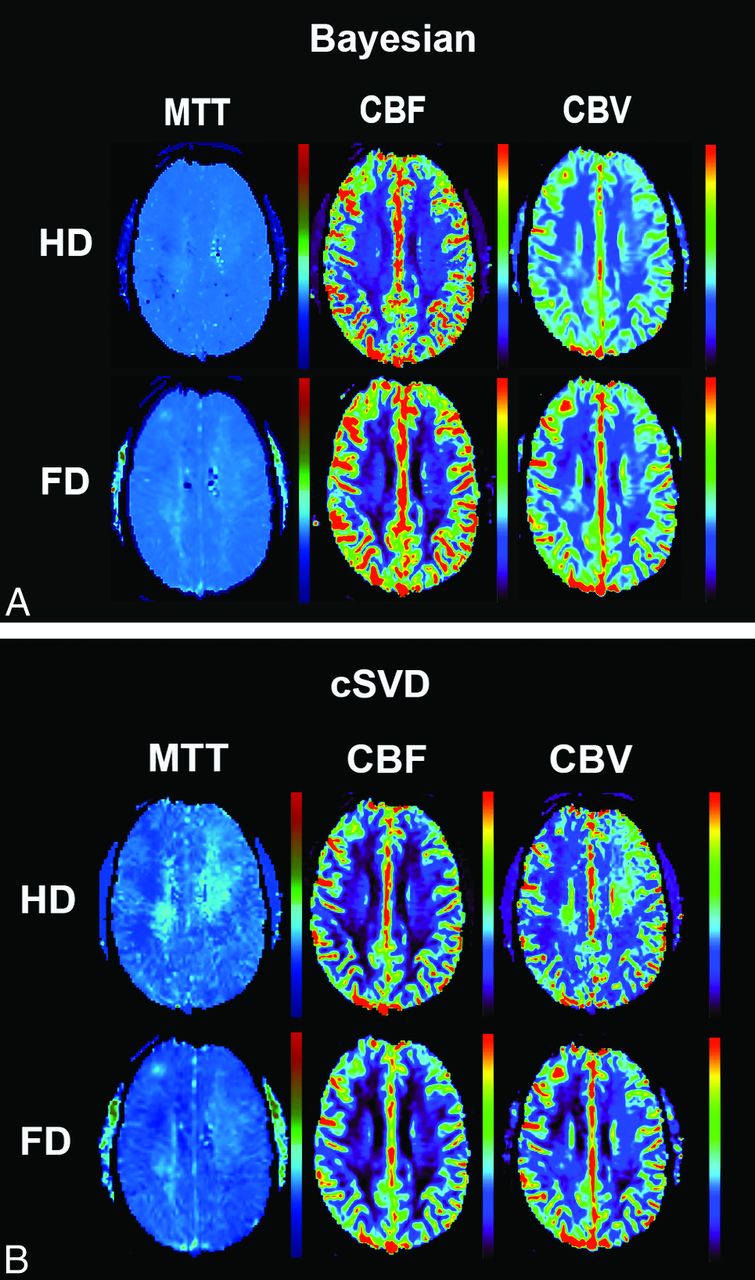
Coregistered and aligned MTT, CBF, and CBV maps from FD (0.1-mmol/kg) and HD (0.05-mmol/kg) DSC perfusion imaging are shown in this 40-year-old man who presented with headache. While the image quality of perfusion maps in FD scans is comparable between Bayesian and cSVD, note the heterogeneity and regional errors seen in cSVD-derived MTT and CBV maps in HD scans.
When we compared FD and HD, there was higher correlation in image-quality scores in Bayesian-processed data compared with cSVD. The Spearman rank correlation coefficients ± the 95% CIs for image-quality scores were r = 0.66, 0.30–0.85 for CBF; r = 0.61, 0.24–0.83 for CBV; and r = 0.59, 0.20–0.80 for MTT in Bayesian-processed data.
The Spearman rank correlation coefficients ± 95% CIs for image-quality scores were r = 0.45, 0.20–0.74 for CBF; r = 0.40, 0.10–0.71 for CBV; and r = 0.08, 0.001–0.45 for MTT in cSVD-processed data.
Quantitative Analysis
The means of SNR values in gray matter were 27.1 ± 7.8 for the FD and 18.4 ± 7.0 for the HD group (32% lower SNR in the HD group, P < .001). The means of SNR values in white matter were 13.5 ± 5.9 for the FD group and 8.0 ± 4.9 for the HD group (40% lower SNR in HD, P < .001).
Quantitative analysis of perfusion parameters obtained from Bayesian and cSVD methods in gray matter and white matter is summarized in Tables 2 and 3. cSVD-derived perfusion values were statistically significantly different between the HD and FD groups both in gray matter and white matter (Table 2). Bayesian-derived perfusion values for the FD and HD groups were statistically significantly different for CBF but not for CBV or MTT (Table 3).
cSVD-derived quantitative analysis of CBF, CBV, and MTT for gray matter and white matter in half-dose (0.05-mmol/kg) and full-dose (0.1-mmol/kg) contrast groupsa
Bayesian-derived quantitative analysis of CBF, CBV, and MTT for gray matter and white matter in half-dose (0.05-mmol/kg) and full-dose (0.1-mmol/kg) contrast groupsa
Regression analysis for quantitative perfusion values between the HD and FD groups showed significantly higher correlation in data processed with the Bayesian compared with the cSVD method. Bivariate scattergrams with 95% CI lines for comparison of HD and FD quantitative analysis between Bayesian and cSVD methods for both gray matter and white matter are summarized in Fig 2.


Bivariate regression scatterplots with 95% CI lines of quantitative analysis of CBF, CBV, and MTT derived from full-dose (0.1-mmol/kg) and half-dose (0.05-mmol/kg) DSC perfusion imaging in both gray matter and white matter. There is significantly higher correlation between HD and FD perfusion values in Bayesian- versus cSVD-processed data.
Correlation coefficient values (R2) between the HD and FD groups for Bayesian-derived CBF, CBV, and MTT were 0.96, 0.71, and 0.64 in gray matter and 0.96, 0.81, and 0.85 in white matter, respectively. Correlation coefficient values (R2) between the HD and FD groups for cSVD-derived CBF, CBV, and MTT were 0.72, 0.28, and 0.24 in gray matter and 0.60, 0.52, and 0.01 in white matter, respectively.
Bland-Altman plots for comparison of HD and FD quantitative analysis between Bayesian and cSVD methods for both gray matter and white matter are summarized in Fig 3. There was a significantly smaller mean difference and narrower range (variability) between HD and FD perfusion values when processed with Bayesian in comparison with cSVD methods (Fig 3).
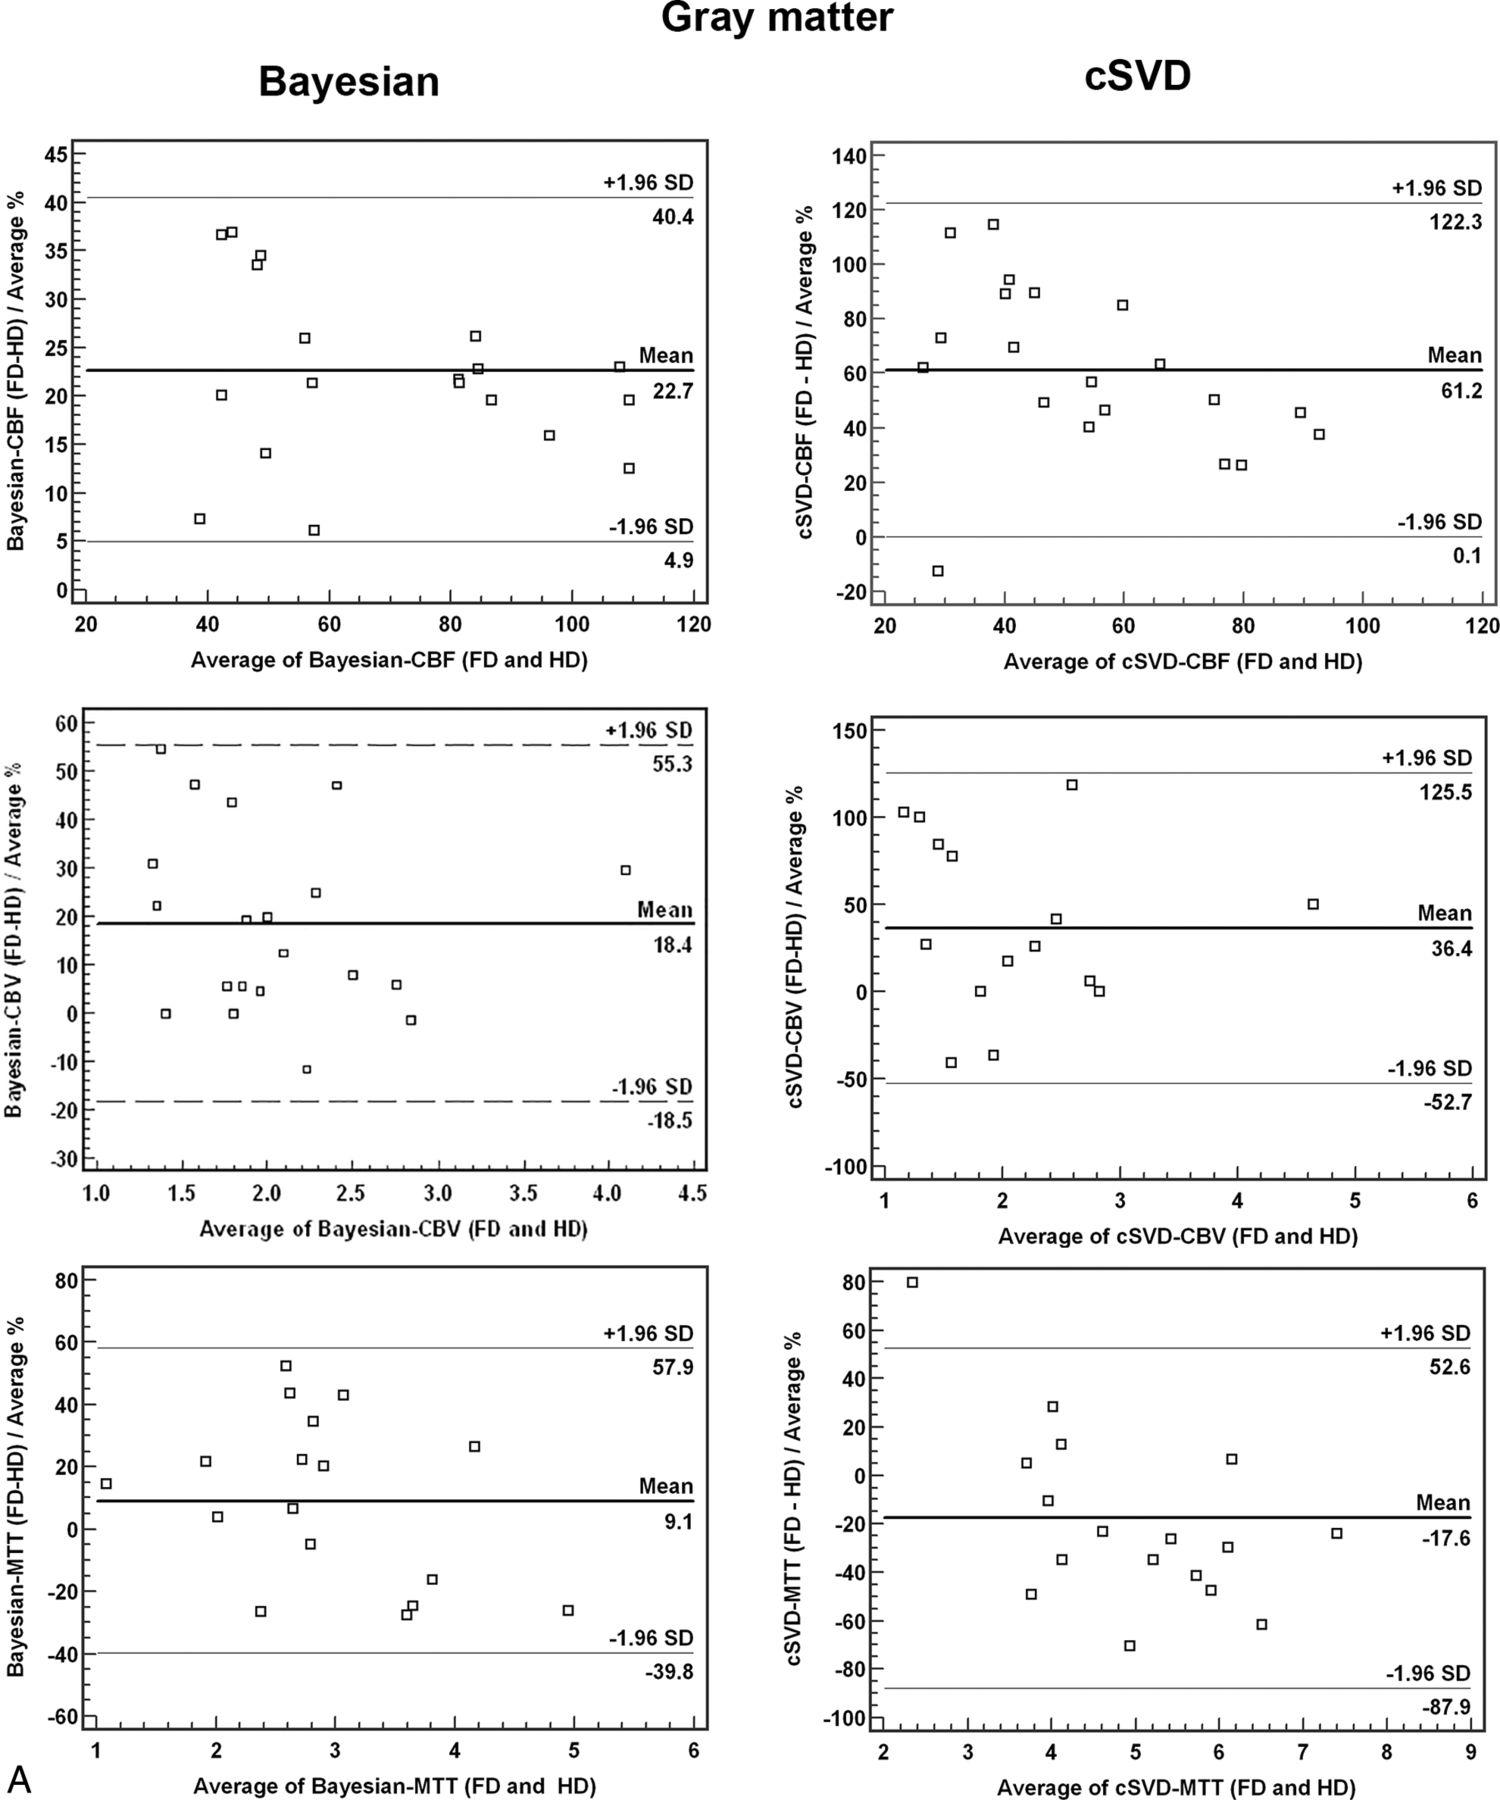

Bland-Altman plots of quantitative analysis of CBF, CBV, and MTT derived from full-dose (0.1-mmol/kg) and half-dose (0.05-mmol/kg) DSC perfusion in both gray matter and white matter. There is a significantly smaller mean difference and narrower range in Bayesian- versus cSVD-processed data between HD and FD perfusion values.
Discussion
Our results suggest that by using the Bayesian probabilistic method, reduced-contrast-dose brain DSC perfusion is feasible at 3T, with qualitative and quantitative results comparable with a full-dose control group. The Bayesian method outperformed the singular value decomposition (SVD)-deconvolution technique for reduced-contrast-dose DSC perfusion, in which the SNR was lower. Our data support the hypothesis that the inherent insensitivity of the Bayesian method to low SNR can provide acceptable measurement of cerebral perfusion in comparison with FD scans. This is reflected in a higher qualitative and quantitative correlation between HD and FD data in Bayesian-processed data in comparison with cSVD.
A fundamental issue in DSC processing is the conversion of the observed concentration time curve into reliable estimates of CBF, CBV, and MTT. Most processing techniques by using the indicator-dilution theory assume that the observed concentration time curve is the convolution of the arterial input function with a residue function, scaled by CBF. The residue function represents the fraction of observed tracer remaining in the observed vasculature at a certain time after its arrival.
The influence of contrast-dose reduction on deconvoluted perfusion parameters, including CBF, CBV, and MTT, has been evaluated by several investigators.6,12,14 Hypothetically and in the absence of noise, DSC-CBF determinations should be insensitive to contrast dose. In a noise-free environment, the deconvolution process of the arterial input function is expected to eliminate the influence that a longer arterial bolus characteristic of a higher contrast dose has on the CBF calculation. Similarly, the CBV calculation should be independent of dose, because the tissue measures of contrast agent concentration are scaled against those measured in the artery and then are integrated with time. However, in reality, concentration time curves obtained by DSC perfusion do exhibit a relatively high noise level. Deconvolution of noisy concentration time curves is an ill-posed problem when small changes in magnitude can dramatically influence the residue function.16 Reducing the contrast dose can result in a decrease in tissue relaxivity (ΔR2*) and thus a drop in the peak of arterial input function and a significant increase in noise level,6 which, in turn, can further accentuate the inaccuracies of deconvolution-based techniques in low-SNR systems.
The use of higher magnetic fields (≥3T), with inherently higher SNR and shorter T2/T2* relaxation times, should translate into a more effective T2* reduction for a given contrast dose during capillary passage21,22 and offset some of the low SNR limitations. However, the effect of a high magnetic field alone on reduced-contrast-dose DCS perfusion has been modest, with mixed results using 0.05 mmol/kg of gadolinium at 3T.14,15 Another approach is to use an improved postprocessing technique that is less sensitive to low SNR. SVD-based deconvolution,16,19 one of the most broadly used DSC processing techniques, has 2 major shortcomings: First, in SVD, the regularization is achieved by truncating the smallest singular value (threshold) that is responsible for the fast oscillation in the nonregularized residue function. This threshold parameter is fixed at a given ad hoc value, in which, ideally, it should be adapted to each voxel and determined from the perfusion data. Second, the truncated SVD method is equivalent to using a low-pass filter, which is suboptimal for estimating the residue function, known to be discontinuous.
Although improved deconvolution techniques can be obtained by using a semiadaptive threshold, as used in oscillation index SVD19 or Gaussian process deconvolution,23 some investigators have promoted the more robust nonparametric Bayesian technique to deal with the challenge of low SNR.18,24 In the Bayesian method, a generative model of signal is used, applying the Bayes rule to combine experimental perfusion data and a priori information about the parameters, to compute a posteriori probability distribution functions for every parameter of interest. From those distributions, parameter estimates and errors in those estimates can be derived (eg, the mean and SD of the a posteriori distributions). The only reasonable assumption made to build the prior distribution of the residue function is that this function must be smooth. One of the advantages of this method is that it treats the regularization parameter as any other parameter. Hence, the regularization parameter is automatically estimated from the perfusion data so that the regularization is optimal for every experimental condition and set of hemodynamic parameters, without any human intervention. Furthermore, the method uses much more precise numeric approximations of the convolution product, which helps to reduce bias in the estimates. From simulation studies, the method has been shown to be more precise, robust, and less sensitive to noise level.18,24
Our results confirm the theoretic advantages of the Bayesian method over SVD-based deconvolution to achieve a more accurate estimation of DSC perfusion parameters in low-SNR environments.18,25 We demonstrate that by reducing the contrast dose, all Bayesian-derived perfusion maps retained diagnostic image quality, while 20% and 40% of SVD-derived CBV and MTT maps, respectively, were nondiagnostic due to significant inhomogeneity caused by increased noise. In addition, in the reduced-contrast-dose scans, the Bayesian-processed data demonstrated quantitative perfusion values comparable with those of the FD group. Most important, the cSVD-derived quantitative values revealed an approximately 44% underestimation of CBF, 30% underestimation of CBV, and 20% overestimation of MTT in gray matter compared with the FD. This finding highlights the known limitation16 of deconvolution techniques when dealing with noisy concentration time curves that have resulted from contrast-dose reduction. Due to an inherently lower perfusion, white matter usually receives a relatively smaller volume of contrast in comparison with gray matter.26 This can result in a noisier environment in the cerebral white matter, as highlighted by our results, which revealed an even higher underestimation of CBV (38%) and overestimation of MTT (30%) in white matter compared with gray matter.
Our study has several limitations. First, our sample size was relatively small, which limits the power of the study. Second, we chose a rather empiric approach to assess the effect of contrast-dose reduction on DSC perfusion parameters. Besides noise, changes in contrast dose can affect many other factors, including tissue relaxivity and arterial statistical field shifts, which, in turn, can affect the DSC perfusion parameters. The possible interaction among these variables may ultimately require a more complex model and a more systematic approach with mathematic modeling to corroborate our findings. The FD DSC perfusion was always performed after HD, and the pre-existing contrast may introduce an unknown bias. Finally, despite using an intraindividual comparison of perfusion values in the HD and FD groups, the semiquantitative nature of DSC analysis remains an inherent limitation of this technique and the results should be interpreted in this context. Identical perfusion parameters should not be expected between FD and HD groups regardless of the applied deconvolution technique. In this study, despite better correlation and less variability in Bayesian-derived perfusion values, the perfusion values remained different between FD and HD.
Conclusions
In summary, by using a Bayesian probabilistic method, reduced-contrast-dose brain DSC perfusion is feasible at 3T with qualitative and quantitative results comparable with those of a full-dose control group. This approach can add flexibility to multi-injection-enhanced MR imaging protocols, such as concurrent implementation of DSC and dynamic contrast-enhanced MR perfusion for brain tumor and contrast-enhanced MR angiography and DSC for patients with stroke, without the need for additional contrast.
Footnotes
Disclosures: Kambiz Nael—UNRELATED: Consultancy: Olea Medical SAS; Travel/Accommodations/Meeting Expenses Unrelated to Activities Listed: Olea Medical SAS. Timothé Boutelier—UNRELATED: Employment: Olea Medical SAS. Joseph Dagher—UNRELATED: Grants/Grants Pending: Defense Advanced Research Projects Agency, role as a Research Scientist,* Comments: Knowledge Enhanced Compressive Measurement. *Money paid to the institution.
Abstract of the preliminary results previously presented at: Annual Meeting of the American Society of Neuroradiology, May 20, 2014; Montréal, Quebec, Canada.
Indicates open access to non-subscribers at www.ajnr.org
REFERENCES
- Received July 12, 2014.
- Accepted after revision October 19, 2014.
- © 2015 by American Journal of Neuroradiology


Jump to section
Related Articles
Cited By...
- Assessment of a Bayesian Vitrea CT Perfusion Analysis to Predict Final Infarct and Penumbra Volumes in Patients with Acute Ischemic Stroke: A Comparison with RAPID
- Bayesian Estimation of CBF Measured by DSC-MRI in Patients with Moyamoya Disease: Comparison with 15O-Gas PET and Singular Value Decomposition