Advertisement

Main menu

  • Home
  • Content
    • Current Issue
    • Accepted Manuscripts
    • Article Preview
    • Past Issue Archive
    • Video Articles
    • AJNR Case Collection
    • Case of the Week Archive
    • Case of the Month Archive
    • Classic Case Archive
  • Special Collections
    • AJNR Awards
    • ASNR Foundation Special Collection
    • Most Impactful AJNR Articles
    • Photon-Counting CT
    • Spinal CSF Leak Articles (Jan 2020-June 2024)
  • Multimedia
    • AJNR Podcasts
    • AJNR SCANtastic
    • Trainee Corner
    • MRI Safety Corner
    • Imaging Protocols
  • For Authors
    • Submit a Manuscript
    • Submit a Video Article
    • Submit an eLetter to the Editor/Response
    • Manuscript Submission Guidelines
    • Statistical Tips
    • Fast Publishing of Accepted Manuscripts
    • Graphical Abstract Preparation
    • Imaging Protocol Submission
    • Author Policies
  • About Us
    • About AJNR
    • Editorial Board
    • Editorial Board Alumni
  • More
    • Become a Reviewer/Academy of Reviewers
    • Subscribers
    • Permissions
    • Alerts
    • Feedback
    • Advertisers
    • ASNR Home

User menu

  • Alerts
  • Log in

Search

  • Advanced search
American Journal of Neuroradiology

American Journal of Neuroradiology

ASHNR American Society of Functional Neuroradiology ASHNR American Society of Pediatric Neuroradiology ASSR
  • Alerts
  • Log in

Advanced Search

  • Home
  • Content
    • Current Issue
    • Accepted Manuscripts
    • Article Preview
    • Past Issue Archive
    • Video Articles
    • AJNR Case Collection
    • Case of the Week Archive
    • Case of the Month Archive
    • Classic Case Archive
  • Special Collections
    • AJNR Awards
    • ASNR Foundation Special Collection
    • Most Impactful AJNR Articles
    • Photon-Counting CT
    • Spinal CSF Leak Articles (Jan 2020-June 2024)
  • Multimedia
    • AJNR Podcasts
    • AJNR SCANtastic
    • Trainee Corner
    • MRI Safety Corner
    • Imaging Protocols
  • For Authors
    • Submit a Manuscript
    • Submit a Video Article
    • Submit an eLetter to the Editor/Response
    • Manuscript Submission Guidelines
    • Statistical Tips
    • Fast Publishing of Accepted Manuscripts
    • Graphical Abstract Preparation
    • Imaging Protocol Submission
    • Author Policies
  • About Us
    • About AJNR
    • Editorial Board
    • Editorial Board Alumni
  • More
    • Become a Reviewer/Academy of Reviewers
    • Subscribers
    • Permissions
    • Alerts
    • Feedback
    • Advertisers
    • ASNR Home
  • Follow AJNR on Twitter
  • Visit AJNR on Facebook
  • Follow AJNR on Instagram
  • Join AJNR on LinkedIn
  • RSS Feeds

AJNR is seeking candidates for the AJNR Podcast Editor. Read the position description.

Research ArticleAdult Brain
Open Access

White Matter Abnormalities in Multiple Sclerosis Evaluated by Quantitative Synthetic MRI, Diffusion Tensor Imaging, and Neurite Orientation Dispersion and Density Imaging

A. Hagiwara, K. Kamagata, K. Shimoji, K. Yokoyama, C. Andica, M. Hori, S. Fujita, T. Maekawa, R. Irie, T. Akashi, A. Wada, M. Suzuki, O. Abe, N. Hattori and S. Aoki
American Journal of Neuroradiology October 2019, 40 (10) 1642-1648; DOI: https://doi.org/10.3174/ajnr.A6209
A. Hagiwara
aFrom the Departments of Radiology (A.H., K.K., K.S., C.A., M.H., S.F., T.M., R.I., T.A., A.W., M.S., S.A.)
cDepartment of Radiology (A.H., S.F., T.M., R.I., O.A.), Graduate School of Medicine, University of Tokyo, Tokyo, Japan
  • Find this author on Google Scholar
  • Find this author on PubMed
  • Search for this author on this site
  • ORCID record for A. Hagiwara
K. Kamagata
aFrom the Departments of Radiology (A.H., K.K., K.S., C.A., M.H., S.F., T.M., R.I., T.A., A.W., M.S., S.A.)
  • Find this author on Google Scholar
  • Find this author on PubMed
  • Search for this author on this site
  • ORCID record for K. Kamagata
K. Shimoji
aFrom the Departments of Radiology (A.H., K.K., K.S., C.A., M.H., S.F., T.M., R.I., T.A., A.W., M.S., S.A.)
dDepartment of Diagnostic Radiology (K.S.), Tokyo Metropolitan Geriatric Hospital, Tokyo, Japan
  • Find this author on Google Scholar
  • Find this author on PubMed
  • Search for this author on this site
  • ORCID record for K. Shimoji
K. Yokoyama
bNeurology (K.Y., N.H.), Juntendo University School of Medicine, Tokyo, Japan
  • Find this author on Google Scholar
  • Find this author on PubMed
  • Search for this author on this site
  • ORCID record for K. Yokoyama
C. Andica
aFrom the Departments of Radiology (A.H., K.K., K.S., C.A., M.H., S.F., T.M., R.I., T.A., A.W., M.S., S.A.)
  • Find this author on Google Scholar
  • Find this author on PubMed
  • Search for this author on this site
  • ORCID record for C. Andica
M. Hori
aFrom the Departments of Radiology (A.H., K.K., K.S., C.A., M.H., S.F., T.M., R.I., T.A., A.W., M.S., S.A.)
eDepartment of Radiology (M.H.), Toho University Omori Medical Center, Tokyo, Japan.
  • Find this author on Google Scholar
  • Find this author on PubMed
  • Search for this author on this site
  • ORCID record for M. Hori
S. Fujita
aFrom the Departments of Radiology (A.H., K.K., K.S., C.A., M.H., S.F., T.M., R.I., T.A., A.W., M.S., S.A.)
cDepartment of Radiology (A.H., S.F., T.M., R.I., O.A.), Graduate School of Medicine, University of Tokyo, Tokyo, Japan
  • Find this author on Google Scholar
  • Find this author on PubMed
  • Search for this author on this site
  • ORCID record for S. Fujita
T. Maekawa
aFrom the Departments of Radiology (A.H., K.K., K.S., C.A., M.H., S.F., T.M., R.I., T.A., A.W., M.S., S.A.)
cDepartment of Radiology (A.H., S.F., T.M., R.I., O.A.), Graduate School of Medicine, University of Tokyo, Tokyo, Japan
  • Find this author on Google Scholar
  • Find this author on PubMed
  • Search for this author on this site
  • ORCID record for T. Maekawa
R. Irie
aFrom the Departments of Radiology (A.H., K.K., K.S., C.A., M.H., S.F., T.M., R.I., T.A., A.W., M.S., S.A.)
cDepartment of Radiology (A.H., S.F., T.M., R.I., O.A.), Graduate School of Medicine, University of Tokyo, Tokyo, Japan
  • Find this author on Google Scholar
  • Find this author on PubMed
  • Search for this author on this site
  • ORCID record for R. Irie
T. Akashi
aFrom the Departments of Radiology (A.H., K.K., K.S., C.A., M.H., S.F., T.M., R.I., T.A., A.W., M.S., S.A.)
  • Find this author on Google Scholar
  • Find this author on PubMed
  • Search for this author on this site
  • ORCID record for T. Akashi
A. Wada
aFrom the Departments of Radiology (A.H., K.K., K.S., C.A., M.H., S.F., T.M., R.I., T.A., A.W., M.S., S.A.)
  • Find this author on Google Scholar
  • Find this author on PubMed
  • Search for this author on this site
  • ORCID record for A. Wada
M. Suzuki
aFrom the Departments of Radiology (A.H., K.K., K.S., C.A., M.H., S.F., T.M., R.I., T.A., A.W., M.S., S.A.)
  • Find this author on Google Scholar
  • Find this author on PubMed
  • Search for this author on this site
  • ORCID record for M. Suzuki
O. Abe
cDepartment of Radiology (A.H., S.F., T.M., R.I., O.A.), Graduate School of Medicine, University of Tokyo, Tokyo, Japan
  • Find this author on Google Scholar
  • Find this author on PubMed
  • Search for this author on this site
  • ORCID record for O. Abe
N. Hattori
bNeurology (K.Y., N.H.), Juntendo University School of Medicine, Tokyo, Japan
  • Find this author on Google Scholar
  • Find this author on PubMed
  • Search for this author on this site
  • ORCID record for N. Hattori
S. Aoki
aFrom the Departments of Radiology (A.H., K.K., K.S., C.A., M.H., S.F., T.M., R.I., T.A., A.W., M.S., S.A.)
  • Find this author on Google Scholar
  • Find this author on PubMed
  • Search for this author on this site
  • ORCID record for S. Aoki
  • Article
  • Figures & Data
  • Supplemental
  • Info & Metrics
  • Responses
  • References
  • PDF
Loading

Abstract

BACKGROUND AND PURPOSE: A number of MR-derived quantitative metrics have been suggested to assess the pathophysiology of MS, but the reports about combined analyses of these metrics are scarce. Our aim was to assess the spatial distribution of parameters for white matter myelin and axon integrity in patients with relapsing-remitting MS by multiparametric MR imaging.

MATERIALS AND METHODS: Twenty-four patients with relapsing-remitting MS and 24 age- and sex-matched controls were prospectively scanned by quantitative synthetic and 2-shell diffusion MR imaging. Synthetic MR imaging data were used to retrieve relaxometry parameters (R1 and R2 relaxation rates and proton density) and myelin volume fraction. Diffusion tensor metrics (fractional anisotropy and mean, axial, and radial diffusivity) and neurite orientation and dispersion index metrics (intracellular volume fraction, isotropic volume fraction, and orientation dispersion index) were retrieved from diffusion MR imaging data. These data were analyzed using Tract-Based Spatial Statistics.

RESULTS: Patients with MS showed significantly lower fractional anisotropy and myelin volume fraction and higher isotropic volume fraction in widespread white matter areas. Areas with different isotropic volume fractions were included within areas with lower fractional anisotropy. Myelin volume fraction showed no significant difference in some areas with significantly decreased fractional anisotropy in MS, including in the genu of the corpus callosum and bilateral anterior corona radiata, whereas myelin volume fraction was significantly decreased in some areas where fractional anisotropy showed no significant difference, including the bilateral posterior limb of the internal capsule, external capsule, sagittal striatum, fornix, and uncinate fasciculus.

CONCLUSIONS: We found differences in spatial distribution of abnormality in fractional anisotropy, isotropic volume fraction, and myelin volume fraction distribution in MS, which might be useful for characterizing white matter in patients with MS.

ABBREVIATIONS:

AVF
axon volume fraction
EDSS
Expanded Disability Status Scale
FA
fractional anisotropy
ICVF
intracellular volume fraction
ISO
isotropic volume fraction
MNI
Montreal Neurological Institute
MVF
myelin volume fraction
NAWM
normal-appearing white matter
NODDI
neurite orientation dispersion and density imaging
ODI
orientation dispersion index
QRAPMASTER
quantification of relaxation times and proton density by multiecho acquisition of a saturation-recovery using turbo spin-echo readout

MS is a demyelinating disorder that mainly affects young individuals and involves inflammatory demyelination accompanied by axonal degeneration. Various quantitative metrics, including myelin water imaging,1 quantitative synthetic MR imaging,2,3 diffusion tensor imaging,4 and neurite orientation dispersion and density imaging (NODDI),5 have revealed abnormalities in both WM lesions and the WM that appears normal on conventional T2WI.

Quantitative synthetic MR imaging simultaneously measures longitudinal T1 and transverse T2 relaxation times (and their inverse, R1 and R2 relaxation rates) and proton density in multiple slices,6 with high repeatability and reproducibility across scanners.7 It allows creation of any contrast-weighted image, including T1-weighted, T2-weighted, and FLAIR images,8 without requiring additional scanning time. Furthermore, a 4-compartment model was developed to estimate myelin volume fraction (MVF) in each voxel in the brain, based on the measured R1, R2, and proton density.9 The estimated myelin correlates with histology in healthy populations10 and in patients with MS11 and with other MR imaging–based myelin measurements.12 Even though synthetic myelin maps have shown tissue abnormalities in plaques and periplaque WM in patients with MS,2 the voxel-level difference in the estimated myelin between patients with MS and healthy controls has not been investigated to date.

Diffusion-weighted imaging also provides information on microstructure, such as fiber density and orientation, by altering the diffusion-sensitization strength and direction of the encoding gradients.13 Although used as a standard diffusion MR imaging technique, diffusion tensor imaging lacks specificity for individual tissue microstructural features.14 Advanced diffusion models have been developed to quantify specific neurite morphology,13 such as NODDI, which assumes 3 compartments in the brain: an intracellular compartment with restricted anisotropic non-Gaussian diffusion (intracellular volume fraction [ICVF]), an extracellular compartment with hindered anisotropic Gaussian diffusion, and a water compartment with free isotropic Gaussian diffusion (isotropic volume fraction [ISO]).15 ICVF is attributed to the axon and dendrite density and can be used for calculating axon volume fraction (AVF) when combined with myelin imaging.16 Notably, the myelin signal is negligible in diffusion MR imaging, and an additional technique is required to retrieve information about axons and myelin.16 NODDI provides directional neurite information as an orientation dispersion index (ODI).

Despite the recent development of multiple advanced MR imaging techniques, reports of combined analyses are scarce. Granberg et al5 found that NODDI was more sensitive than myelin-sensitive imaging to changes in normal-appearing WM (NAWM) in patients with MS. However, they used the T1-weighted/T2-weighted ratio as a measure of myelin, which has been reported to be less than optimal for evaluating myelin in WM.12,17 Moreover, no previous study has performed voxelwise whole-brain analysis of tissue-damage distribution in patients with MS using NODDI or myelin-imaging techniques. Even though our previous work3 combined quantitative synthetic MR imaging and NODDI for evaluating WM damage in patients with MS, we did not compare quantitative values in patients with MS with those in healthy controls.

Therefore, this study aimed to evaluate the distribution of WM damage in patients with MS compared with healthy controls by combining quantitative synthetic MR imaging and NODDI. We used Tract-Based Spatial Statistics (TBSS; http://fsl.fmrib.ox.ac.uk/fsl/fslwiki/TBSS),18 which allows voxelwise analysis of the whole brain within core WM tracts, to compare patients with MS and healthy controls, and we used ROI analysis to compare NAWM and lesions in patients with MS with WM in healthy controls.

Materials and Methods

Study Participants

We prospectively recruited 24 patients with relapsing-remitting MS from August to November 2016 who were diagnosed according to the 2010 revised McDonald diagnostic criteria.19 Disability was assessed using the Expanded Disability Status Scale (EDSS) score.20 These patients were on stable disease-modifying treatment or no treatment for at least 3 months and had been free of clinical relapse within the 3 months and corticosteroid use within 1 year before MR imaging. As a control group, we also recruited 24 age- and sex-matched healthy subjects without neurologic and psychological symptoms or a history of neuropsychological disorders. Acquired images were confirmed not to include abnormalities such as moderate-to-severe WM ischemic lesions (Fazekas grade II or higher21), brain infarction, or tumor. This study was approved by the institutional review board of Juntendo University Hospital, Tokyo, Japan, and written informed consent was obtained from all participants. The patients in this study partially overlapped with a previously published study population.22

Image Acquisition and Processing

MR imaging was performed on a 3T scanner (Discovery MR750w; GE Healthcare, Milwaukee, Wisconsin) with a 19-channel head coil. All participants were scanned with a 2D axial quantification of relaxation times and proton density by multiecho acquisition of a saturation-recovery using turbo spin-echo readout (QRAPMASTER) pulse sequence and 2-shell diffusion MR imaging.

QRAPMASTER is a multislice, multiecho, multisaturation-delay saturation-recovery turbo spin-echo acquisition method in which images are collected with combinations of 2 TEs and 4 saturation-delay times. We used TEs of 16.9 and 84.5 ms and delay times of 146, 546, 1879, and 3879 ms. The other parameters were as follows: TR = 4.0 seconds, FOV = 240 × 240 mm, matrix = 320 × 320, echo-train length = 10, bandwidth = 31.25 kHz, section thickness/gap = 4.0 mm/1.0 mm, slices = 30, and acquisition time = 7 minutes 12 seconds. The 8 complex images acquired per section were postprocessed with SyMRI software (Version 8.0; SyntheticMR, Linköping, Sweden) to derive longitudinal R1 relaxation and transverse R2 relaxation rates and proton density and to estimate MVF per voxel. The myelin estimation model assumes 4 brain compartments: myelin, excess parenchymal water, cellular water, and free-water volume fractions.9 The R1, R2, and proton density of each volume fraction in a voxel presumably contribute to the effective R1, R2, and proton density of the voxel as a whole. Synthetic FLAIR images and T1WI were also created with the same software using the R1, R2, and proton density maps, with the following postprocessing parameters: TR = 15,000 ms, TE = 100 ms, TI = 3000 ms for FLAIR, and TR = 500 ms, TE = 10 ms for T1WI.

Diffusion MR imaging was performed with single-shot echo-planar imaging along 30 and 60 motion-probing gradient directions for b-values of 1000 and 2000 s/mm2, respectively. Additionally, a volume of non-diffusion-weighted images was also acquired. The other sequence parameters were the following: TR = 5000 ms, TE = 88.2 ms, FOV = 256 × 256 mm, matrix size = 256 × 256, echo-train length = 128, bandwidth = 1953.12 kHz, section thickness/gap = 4.0 mm/1.0 mm, slices = 30, and acquisition time = 7 minutes 40 seconds. All datasets were visually inspected for artifacts. We corrected in-plane and through-plane distortions of diffusion-weighted images caused by eddy currents and motion using affine brain registration to non-diffusion-weighted images.23 Processed images were further denoised using multishell position-orientation adaptive smoothing based on the propagation-separation approach.24,25 On denoising, diffusion data with b-values of 1000 and 2000 s/mm2 were handled simultaneously to improve denoising stability.25 Maps of fractional anisotropy (FA), mean diffusivity, axial diffusivity, and radial diffusivity were computed using diffusion data with b-values of 0 and 1000 s/mm2 by fitting a tensor model. A NODDI model15 was applied to the whole 2-shell diffusion data to produce ICVF, ISO, and ODI maps, while processing was accelerated using an Accelerated Microstructure Imaging via Convex Optimization algorithm.26

The AVF and g-ratio maps were acquired using the following equations: Embedded Image Embedded Image assuming that the signal of myelin is almost negligible in diffusion-weighted imaging but that the volume of myelin is not,16—that is, the volume fractions calculated by NODDI correspond to nonmyelinated tissues. Postprocessing was performed with an in-house program in Matlab (MathWorks, Natick, Massachusetts). Affine transformation was performed to register the acquired images using Statistical Parametric Mapping software (SPM12; http://www.fil.ion.ucl.ac.uk/spm/software/spm12).

TBSS Analysis

We performed whole-brain voxelwise analysis of the quantitative maps using TBSS implemented in the FMRIB Software Library (FSL; http://www.fmrib.ox.ac.uk/fsl).18,27 First, FMRIB58_FA (https://fsl.fmrib.ox.ac.uk/fsl/fslwiki/FMRIB58_FA) in the Mon-treal Neurological Institute (MNI) common space was used as the target image for nonlinear registration of all subjects' FA maps, using the FMRIB Nonlinear Registration Tool (FNIRT; http://fsl.fmrib.ox.ac.uk/fsl/fslwiki/FNIRT/). The transformed FA images were averaged and skeletonized, representing the centers of all WM tracts common to all subjects. The mean FA skeleton was thresholded at 0.2 to include major WM tracts and to exclude peripheral tracts and gray matter.18 Each participant's aligned FA map was then projected onto this skeleton by assigning to each voxel the maximum FA in a line perpendicular to the local skeleton. The R1, R2, proton density, MVF, mean diffusivity, axial diffusivity, radial diffusivity, ICVF, ISO, ODI, AVF, and g-ratio maps were projected onto the mean FA skeleton after applying the warping registration field of each subject to the standard space.

Comparisons between patients with MS and healthy controls were performed by voxelwise statistics of the skeletonized quantitative maps using nonparametric statistical thresholding (FSL Randomise permutation algorithm; https://fsl.fmrib.ox.ac.uk/fsl/fslwiki/Randomise). The thresholded mean FA skeleton was used as a mask. Five thousand permutations and statistical inference using threshold-free cluster enhancement were performed,28 with P values < .05 after family-wise error correction for multiple comparisons considered significant. Age and sex were used as covariates. The anatomic locations of regions with significant group differences on the WM skeleton were identified from the Johns Hopkins University WM labels atlas.29 For parameters showing significant differences, correlations with disease duration and EDSS were also examined using Randomise (P < .05, corrected for age and sex).

Lesion Maps

For all patients, hyperintense lesions were automatically segmented on synthetic FLAIR images using the lesion-prediction algorithm30 implemented in the Lesion Segmentation Toolbox, Version 2.0.15 (http://www.applied-statistics.de/lst.html)31 running in SPM 12. All lesion maps were visually inspected and manually corrected by an experienced neuroradiologist (A.H.). The whole-brain WM lesion volume in each patient was calculated by multiplying the lesion area by the section thickness. Synthetic T1WI in each patient was spatially normalized to MNI space, and warping fields were saved and subsequently applied to lesion maps. Because synthetic images derived from QRAPMASTER are inherently aligned,32 no prior registration between synthetic T1WI and lesion maps created on synthetic FLAIR was required. Normalized lesion maps in all patients were aggregated to create group lesion maps.

ROI Analysis

To investigate tissue damage in NAWM and lesions separately, we performed ROI analysis using the WM skeleton and lesion maps. We registered the skeleton in the MNI space to each subject's space by applying the warping field created for TBSS analysis after inversion of the field. Next, we enlarged each patient's lesion map by 4 voxels. We segmented the synthetic T1WI for each subject to extract WM segmentation maps using FMRIB's Automated Segmentation Tool (FAST; http://fsl.fmrib.ox.ac.uk/fsl/fslwiki/fast). WM segmentation maps were then thresholded at 0.9 to minimize the partial volume effects and were used as WM masks. We created NAWM masks by subtracting the enlarged lesion maps from the thresholded WM masks for each patient. Overlapping areas between the warped skeleton and WM masks in healthy controls, NAWM masks in patients, or lesion maps in patients were used as ROIs to extract metrics from each quantitative map for the WM of healthy controls, the NAWM of patients with MS, or the lesion areas of patients with MS, respectively.

Statistical Analysis

Statistical analyses of demographic data were performed using a 2-sample t test for age and a χ2 test for sex. For ROI data, non-normality of synthetic MR imaging metrics has been reported previously2,3; therefore, we used the nonparametric Steel test for multiple comparisons to compare R1, R2, proton density, MVF, FA, mean diffusivity, axial diffusivity, radial diffusivity, ICVF, ISO, ODI, AVF, and g-ratio values between the WM of healthy controls and the NAWM or lesion areas of patients with MS. A 2-sided P < .05 was considered statistically significant. These statistical analyses were performed with the software package R, Version 3.2.1 (http://www.r-project.org/).

Results

The demographic and clinical data of patients with MS and of healthy controls are provided in the Table. Age and sex did not differ significantly between groups.

View this table:
  • View inline
  • View popup

Demographic and clinical details of all participants

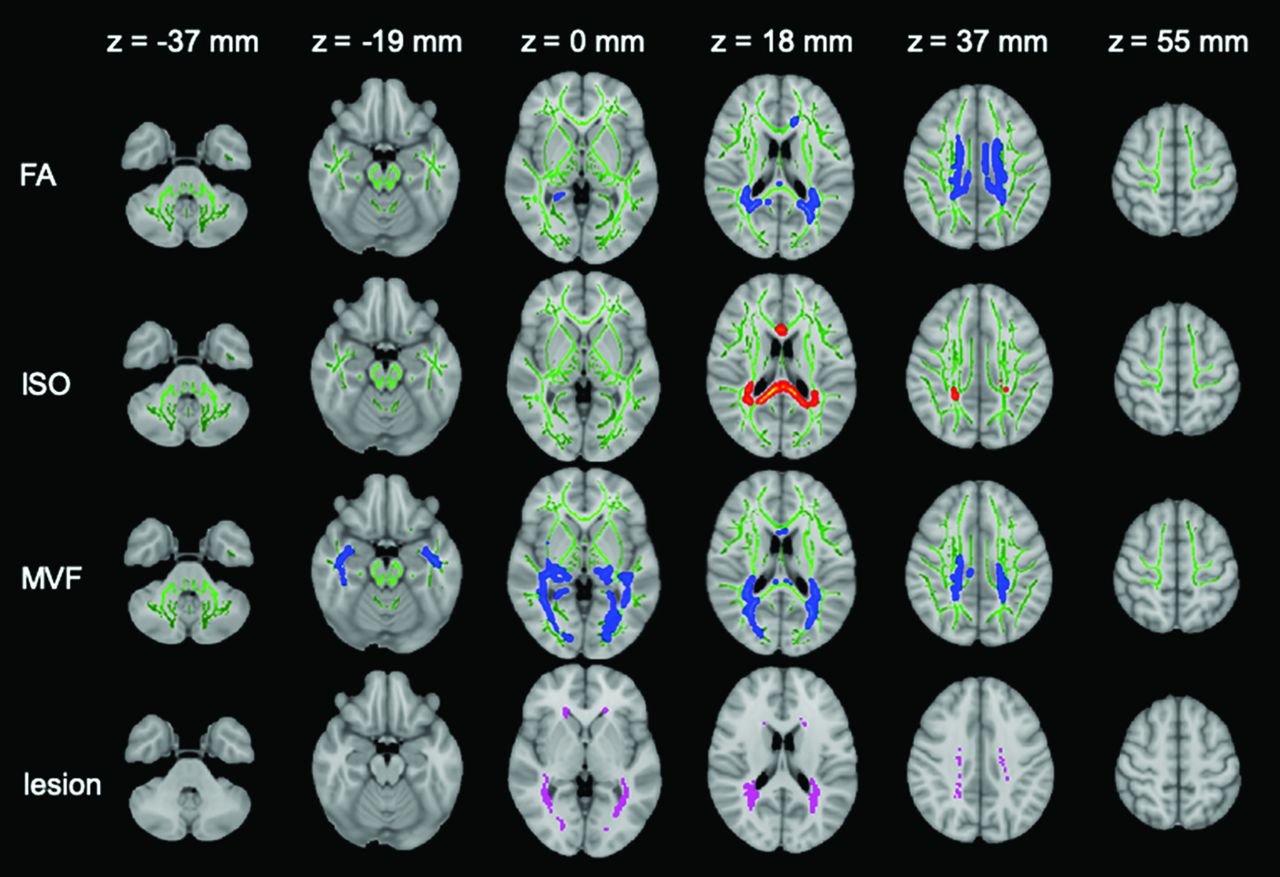
On TBSS analysis, patients with MS showed significantly lower FA and MVF and higher ISO values in the corpus callosum, cingulate gyri, and corona radiata (Fig 1 and On-line Table 1). The MVF differed between patients with MS and healthy controls in the most widespread areas, and only MVF showed significant differences (lower values in patients with MS) in the inferior longitudinal fasciculus, inferior fronto-occipital fasciculus, uncinate fasciculus, fornix, and external capsule. Conversely, only FA showed significantly different values (lower in patients with MS) in the genu of the corpus callosum and anterior corona radiata. All areas with significant ISO differences were included within areas that showed a significant FA difference. No significant correlation was found between EDSS or disease duration and FA, ISO, or MVF. R1, R2, proton density, mean diffusivity, axial diffusivity, radial diffusivity, ICVF, ODI, AVF, and g-ratio maps did not differ statistically significantly in the WM between patients and controls.

Fig 1.
  • Download figure
  • Open in new tab
  • Download powerpoint
Fig 1.

TBSS results are shown for FA, ISO, and MVF maps, which show significant differences between patients with MS and healthy controls. Green represents the mean FA skeleton of all participants thresholded at 0.2. Blue–light blue represents lower values in patients with MS compared with healthy controls in FA (first row) and MVF (third row) maps; red-yellow represents higher values in ISO maps (second row) (family-wise error-corrected P < .05). The significant regions are thickened for better visibility. The mean lesion probability distribution in patients with MS, thresholded at 20%, is shown in the fourth row in purple.

Figure 2 and On-line Table 2 show ROI analysis results. All quantitative metrics except ISO differed significantly between the healthy control WM and the WM lesions in patients with MS. R1, FA, mean diffusivity, radial diffusivity, ISO, ODI, and MVF differed significantly between healthy control WM and NAWM of patients with MS.

Fig 2.
  • Download figure
  • Open in new tab
  • Download powerpoint
Fig 2.

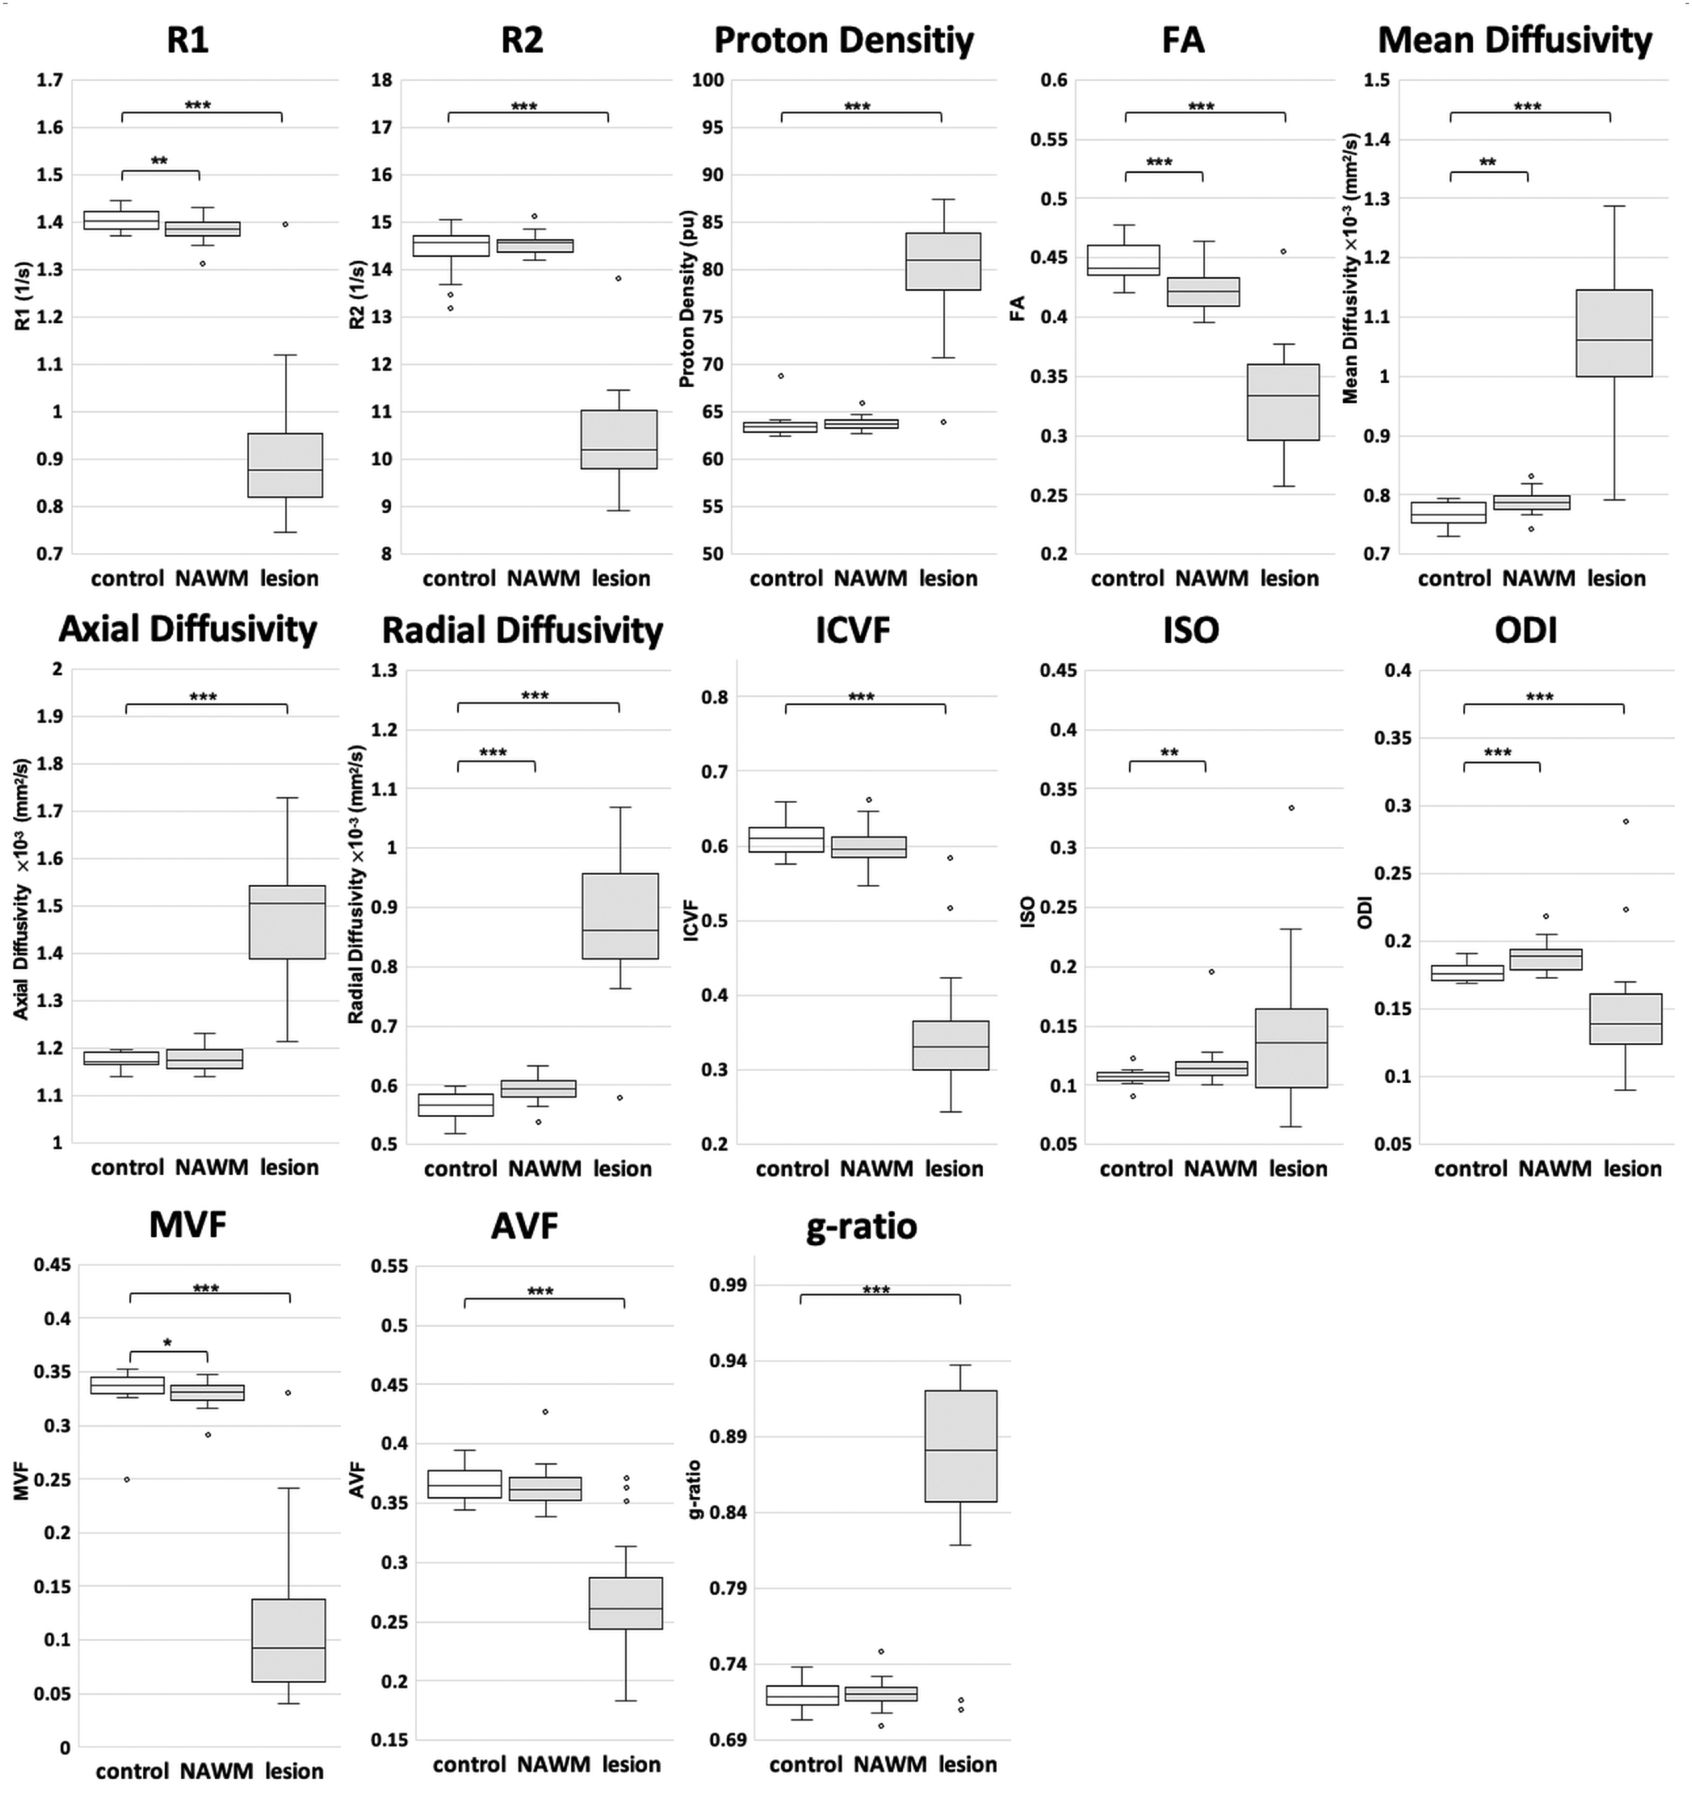
Quantitative metrics compared among the WM of healthy controls, NAWM of patients with MS, and WM lesions of patients with MS. The median and 25th and 75th percentiles are marked in boxplots, with outliers plotted by open circles. Asterisks indicate significant differences among the groups. The asterisk indicates P < .05; double asterisks, P < .01; triple asterisks, P < .001.

Discussion

We here compared the WM of patients with MS and healthy controls using a combination of synthetic MR imaging and diffusion MR imaging by implementing TBSS and ROI analysis. To our knowledge, no previous study has performed voxelwise analysis of whole-brain WM using synthetic MVF or NODDI. We showed a lower FA in widespread WM areas in patients with MS, consistent with previous findings.33⇓–35 The distribution of abnormality in MVF value in patients differed from those of FA and ISO values. Even though the mechanisms underlying these differences are unclear, we can assume that various disease processes such as demyelination, axonal degeneration, gliosis, and edema36 play a role. Because FA is nonspecific for demyelination and other pathologic processes37 and ISO reportedly shows inflammatory free-water or edema,5 this combination of synthetic MR imaging and diffusion MR imaging may allow more detailed evaluation than is achieved using FA only.

TBSS analysis did not show statistically significant differences in the AVF, ICVF, and g-ratio between patients with MS and healthy controls, while MVF differed significantly. Furthermore, in a comparison between the NAWM of patients and the WM of healthy controls, ROI analysis showed significant differences in MVF, but not in the AVF, ICVF, and g-ratio. These results agreed with those of our previous study3 reporting that MVF was more sensitive than AVF to WM damage in plaque and periplaque WM than in NAWM. Even though TBSS analysis showed no significant difference in axial and radial diffusivity between patients with MS and healthy controls in our study, ROI analysis revealed higher radial diffusivity in the NAWM of patients with MS than in healthy control WM, whereas axial diffusivity did not differ significantly, even in ROI analysis. Our observation was consistent with previously reported findings that radial diffusivity showed more widespread abnormalities in the WM of patients with MS than axial diffusivity,34 where radial diffusivity and axial diffusivity are considered surrogate markers for myelin and axon integrity, respectively. The widespread decrease in MVF, without a significant AVF decrease in this study, supported the notion that demyelination is a key pathologic element in MS and that MVF can be a biomarker for monitoring progression and treatment response in MS.

In ROI analysis, the ODI was higher in the NAWM of patients with MS than in the healthy control WM, but it was lower in WM lesions in patients with MS than in healthy control WM. This was congruent with the findings of Schneider et al38 involving 5 patients with relapsing-remitting MS, which indicated a loss of fiber coherence (ie, increased dispersion) in the NAWM. They found a lower ODI in WM lesions, as in our study, even though another study involving early-stage MS (disease duration, <5 years) showed higher ODI in WM lesions.5 These results might suggest that NAWM and early plaques show a loss of fiber coherence with relatively maintained neuronal fiber density, leading to an increase in ODI, whereas loss of neuronal fibers, with fewer signals from fibers, may cause a decrease in ODI in chronic plaques.

ISO values were higher in the WM of patients with MS on TBSS analysis and in the NAWM of patients with MS on ROI analysis, than in healthy control WM, possibly indicating edema with free diffusion in patients' NAWM. However, patients' WM lesion values were not significantly higher than those of healthy control WM, in contrast to the findings of Schneider et al.38 This difference could be attributed to the high variability of ISO in lesions in our study (Fig 2), which is partly explained by the partial volume effects of lesion ROIs. Chung et al39 previously revealed that NODDI metrics showed higher variability at tissue boundaries. Hence, future investigations with higher resolution are warranted.

In TBSS, R1, R2, and proton density, as opposed to the MVF derived from these metrics, did not differ significantly between the patients with MS and healthy controls, agreeing with a previous observation showing the higher sensitivity of MVF than R1, R2, and proton density for revealing WM damage in plaque and periplaque WM.2 On ROI analysis, only R1 differed significantly between the NAWM of patients with MS and the WM of healthy controls. Previous reports have inconsistently reported differences between healthy WM and NAWM revealed by these metrics,40⇓⇓–43 and 1 previous study showed significant differences in T2 and proton density, but not in T1, between healthy WM and NAWM.43 These metrics are thus nonspecifically affected by pathologic processes; hence, MVF and AVF may be more suitable for capturing changes in tissue microstructure in patients with MS.

In our study, no correlation was found between quantitative metrics and EDSS or disease duration. This could be due to the small sample size and the low EDSS scores (median, 1). Larger studies including a wider range of clinical disabilities are needed.

This study had some limitations. First, the study design was cross-sectional. Future longitudinal studies are required to understand intraindividual variation and the trajectory of metric changes during disease progression. Second, we used a 4-mm section thickness with a 1-mm gap. A future combination of 3D synthetic MR imaging44 and high-resolution diffusion-weighted imaging in a larger study population would facilitate a more robust analysis.

Conclusions

We compared the metrics acquired by synthetic MR imaging and NODDI in the WM between patients with MS and healthy controls. Compared with healthy controls, patients with MS showed significantly lower FA, lower MVF, and higher ISO in large WM areas. Furthermore, a decrease in FA and MVF showed different spatial distributions; combined, these quantitative values can facilitate better WM characterization in patients with MS.

Footnotes

  • This work was supported by Japan Society for the Promotion of Science KAKENHI grant Nos. 19K17150, 19K17177, 18H02772, and 18K15643; grant No. JP16H06280, Grant-in-Aid for Scientific Research on Innovative Areas, resource and technical support platforms for promoting research “Advanced Bioimaging Support”; the Japanese Society for Magnetic Resonance in Medicine; and the program for Brain Mapping by Integrated Neurotechnologies for Disease Studies from the Japan Agency for Medical Research and Development.

  • Disclosures: Akifumi Hagiwara—RELATED: Grant: Japan Society for the Promotion of Science KAKENHI, Comments: grant No, 19K17150; UNRELATED: Travel/Accommodations/Meeting Expenses Unrelated to Activities Listed: GE Healthcare, Comments: SIGNA Masters Series Neuro Summit (Singapore) October 2018. Keigo Shimoji—UNRELATED: Grants/Grants Pending: MEXT KAKENHI, grant No. 18H02772. Shigeki Aoki—RELATED: Grant: Japan Society for the Promotion of Science KAKENHI, ABiS, Branding Project*; UNRELATED: Grants/grants Pending: Japan Society for the Promotion of Science KAKENHI, ABiS, Branding Project, Daiichi Sankyo, Mediphysics, Fuji Film RI, Eisai, Guerbet*; Payment for Lectures Including Service on Speakers Bureaus: GE Healthcare, Siemens, Canon, Bayer, Daiichi Sankyo, Mediphysics, FujiRI, Fujifilm Medical Systems, Eisai, Guerbet. *Money paid to institution.

Indicates open access to non-subscribers at www.ajnr.org

References

  1. 1.↵
    1. Vavasour IM,
    2. Huijskens SC,
    3. Li DK, et al
    . Global loss of myelin water over 5 years in multiple sclerosis normal-appearing white matter. Mult Scler 2018;24:1557–68 doi:10.1177/1352458517723717 pmid:28782447
    CrossRefPubMed
  2. 2.↵
    1. Hagiwara A,
    2. Hori M,
    3. Yokoyama K, et al
    . Utility of a multiparametric quantitative MRI model that assesses myelin and edema for evaluating plaques, periplaque white matter, and normal-appearing white matter in patients with multiple sclerosis: a feasibility study. AJNR Am J Neuroradiol 2017;38:237–42 doi:10.3174/ajnr.A4977 pmid:27789453
    Abstract/FREE Full Text
  3. 3.↵
    1. Hagiwara A,
    2. Hori M,
    3. Yokoyama K, et al
    . Analysis of white matter damage in patients with multiple sclerosis via a novel in vivo MR method for measuring myelin, axons, and g-ratio. AJNR Am J Neuroradiol 2017;38:1934–40 doi:10.3174/ajnr.A5312 pmid:28775058
    Abstract/FREE Full Text
  4. 4.↵
    1. Guo AC,
    2. MacFall JR,
    3. Provenzale JM
    . Multiple sclerosis: diffusion tensor MR imaging for evaluation of normal-appearing white matter. Radiology 2002;222:729–36 doi:10.1148/radiol.2223010311 pmid:11867792
    CrossRefPubMed
  5. 5.↵
    1. Granberg T,
    2. Fan Q,
    3. Treaba CA, et al
    . In vivo characterization of cortical and white matter neuroaxonal pathology in early multiple sclerosis. Brain 2017;140:2912–26 doi:10.1093/brain/awx247 pmid:29053798
    CrossRefPubMed
  6. 6.↵
    1. Warntjes JB,
    2. Leinhard OD,
    3. West J, et al
    . Rapid magnetic resonance quantification on the brain: optimization for clinical usage. Magn Reson Med 2008;60:320–29 doi:10.1002/mrm.21635 pmid:18666127
    CrossRefPubMed
  7. 7.↵
    1. Hagiwara A,
    2. Hori M,
    3. Cohen-Adad J, et al
    . Linearity, bias, intrascanner repeatability, and interscanner reproducibility of quantitative multidynamic multiecho sequence for rapid simultaneous relaxometry at 3 T: a validation study with a standardized phantom and healthy controls. Invest Radiology 2019;54:47–39 doi:10.1097/RLI.0000000000000510 pmid:30300164
    CrossRefPubMed
  8. 8.↵
    1. Wallaert L,
    2. Hagiwara A,
    3. Andica C, et al
    . The advantage of synthetic MRI for the visualization of anterior temporal pole lesions on double inversion recovery (DIR), phase-sensitive inversion recovery (PSIR), and myelin images in a patient with CADASIL. Magn Reson Med Sci 2018;17:275–76 doi:10.2463/mrms.ci.2017-0110 pmid:29238005
    CrossRefPubMed
  9. 9.↵
    1. Warntjes M,
    2. Engstrom M,
    3. Tisell A, et al
    . Modeling the presence of myelin and edema in the brain based on multi-parametric quantitative MRI. Front Neurol 2016;7:16 doi:10.3389/fneur.2016.00016 pmid:26925030
    CrossRefPubMed
  10. 10.↵
    1. Warntjes JBM,
    2. Persson A,
    3. Berge J, et al
    . Myelin detection using rapid quantitative MR imaging correlated to macroscopically registered luxol fast blue-stained brain specimens. AJNR Am J Neuroradiol 2017;38:1096–102 doi:10.3174/ajnr.A5168 pmid:28428209
    Abstract/FREE Full Text
  11. 11.↵
    1. Ouellette R,
    2. Warntjes M,
    3. Forslin Y, et al
    . Rapid estimation of myelin for diagnostic imaging (REMyDI): a clinical and histopathological validation in multiple sclerosis. In: Proceedings of the Annual Meeting of the International Society for Magnetic Resonance in Medicine and the European Society for Magnetic Resonance in Medicine, Paris, France, June 16-21, 2018;Abstract 1864
  12. 12.↵
    1. Hagiwara A,
    2. Hori M,
    3. Kamagata K, et al
    . Myelin measurement: comparison between simultaneous tissue relaxometry, magnetization transfer saturation index, and T1w/T2w ratio methods. Sci Rep 2018;8:10554 doi:10.1038/s41598-018-28852-6 pmid:30002497
    CrossRefPubMed
  13. 13.↵
    1. Alexander DC,
    2. Dyrby TB,
    3. Nilsson M, et al
    . Imaging brain microstructure with diffusion MRI: practicality and applications. NMR Biomed 2019;32:e3841 doi:10.1002/nbm.3841 pmid:29193413
    CrossRefPubMed
  14. 14.↵
    1. Pierpaoli C,
    2. Jezzard P,
    3. Basser PJ, et al
    . Diffusion tensor MR imaging of the human brain. Radiology 1996;201:637–48 doi:10.1148/radiology.201.3.8939209 pmid:8939209
    CrossRefPubMed
  15. 15.↵
    1. Zhang H,
    2. Schneider T,
    3. Wheeler-Kingshott CA, et al
    . NODDI: practical in vivo neurite orientation dispersion and density imaging of the human brain. Neuroimage 2012;61:1000–16 doi:10.1016/j.neuroimage.2012.03.072 pmid:22484410
    CrossRefPubMed
  16. 16.↵
    1. Stikov N,
    2. Campbell JS,
    3. Stroh T, et al
    . In vivo histology of the myelin g-ratio with magnetic resonance imaging. Neuroimage 2015;118:397–405 doi:10.1016/j.neuroimage.2015.05.023 pmid:26004502
    CrossRefPubMed
  17. 17.↵
    1. Arshad M,
    2. Stanley JA,
    3. Raz N
    . Test-retest reliability and concurrent validity of in vivo myelin content indices: myelin water fraction and calibrated T1 w/T2 w image ratio. Hum Brain Mapp 2017;38:1780–90 doi:10.1002/hbm.23481 pmid:28009069
    CrossRefPubMed
  18. 18.↵
    1. Smith SM,
    2. Jenkinson M,
    3. Johansen-Berg H, et al
    . Tract-based spatial statistics: voxelwise analysis of multi-subject diffusion data. Neuroimage 2006;31:1487–505 doi:10.1016/j.neuroimage.2006.02.024 pmid:16624579
    CrossRefPubMed
  19. 19.↵
    1. Polman CH,
    2. Reingold SC,
    3. Banwell B, et al
    . Diagnostic criteria for multiple sclerosis: 2010 revisions to the McDonald criteria. Ann Neurol 2011;69:292–302 doi:10.1002/ana.22366 pmid:21387374
    CrossRefPubMed
  20. 20.↵
    1. Kurtzke JF
    . A new scale for evaluating disability in multiple sclerosis. Neurology 1955;5:580–83 doi:10.1212/WNL.5.8.580 pmid:13244774
    FREE Full Text
  21. 21.↵
    1. Fazekas F,
    2. Chawluk JB,
    3. Alavi A, et al
    . MR signal abnormalities at 1.5 T in Alzheimer's dementia and normal aging. AJR Am J Roentgenol 1987;149:351–56 doi:10.2214/ajr.149.2.351 pmid:3496763
    CrossRefPubMed
  22. 22.↵
    1. Andica C,
    2. Hagiwara A,
    3. Kamagata K, et al
    . Gray matter alterations in early and late relapsing-remitting multiple sclerosis evaluated with synthetic quantitative magnetic resonance imaging. Sci Rep 2019;9:8147 doi:10.1038/s41598-019-44615-3 pmid:31148572
    CrossRefPubMed
  23. 23.↵
    1. Mohammadi S,
    2. Moller HE,
    3. Kugel H, et al
    . Correcting eddy current and motion effects by affine whole-brain registrations: evaluation of three-dimensional distortions and comparison with slicewise correction. Magn Reson Med 2010;64:1047–56 doi:10.1002/mrm.22501 pmid:20574966
    CrossRefPubMed
  24. 24.↵
    1. Becker SM,
    2. Tabelow K,
    3. Voss HU, et al
    . Position-orientation adaptive smoothing of diffusion weighted magnetic resonance data (POAS). Med Image Anal 2012;16:1142–55 doi:10.1016/j.media.2012.05.007 pmid:22677817
    CrossRefPubMed
  25. 25.↵
    1. Becker SM,
    2. Tabelow K,
    3. Mohammadi S, et al
    . Adaptive smoothing of multi-shell diffusion weighted magnetic resonance data by msPOAS. Neuroimage 2014;95:90–105 doi:10.1016/j.neuroimage.2014.03.053 pmid:24680711
    CrossRefPubMed
  26. 26.↵
    1. Daducci A,
    2. Canales-Rodriguez EJ,
    3. Zhang H, et al
    . Accelerated Microstructure Imaging via Convex Optimization (AMICO) from diffusion MRI data. Neuroimage 2015;105:32–44 doi:10.1016/j.neuroimage.2014.10.026 pmid:25462697
    CrossRefPubMed
  27. 27.↵
    1. Smith SM,
    2. Jenkinson M,
    3. Woolrich MW, et al
    . Advances in functional and structural MR image analysis and implementation as FSL. Neuroimage 2004;23(Suppl 1):S208–19 doi:10.1016/j.neuroimage.2004.07.051 pmid:15501092
    CrossRefPubMed
  28. 28.↵
    1. Keihaninejad S,
    2. Ryan NS,
    3. Malone IB, et al
    . The importance of group-wise registration in tract based spatial statistics study of neurodegeneration: a simulation study in Alzheimer's disease. PLoS One 2012;7:e45996 doi:10.1371/journal.pone.0045996 pmid:23139736
    CrossRefPubMed
  29. 29.↵
    1. Mori S,
    2. Wakana S,
    3. Nagae-Poetscher LM, et al
    . MRI Atlas of Human White Matter. Amsterdam: Elsevier; 2005
  30. 30.↵
    1. Egger C,
    2. Opfer R,
    3. Wang C, et al
    . MRI FLAIR lesion segmentation in multiple sclerosis: does automated segmentation hold up with manual annotation? Neuroimage Clin 2017;13:264–70 doi:10.1016/j.nicl.2016.11.020 pmid:28018853
    CrossRefPubMed
  31. 31.↵
    1. Schmidt P,
    2. Gaser C,
    3. Arsic M, et al
    . An automated tool for detection of FLAIR-hyperintense white-matter lesions in multiple sclerosis. Neuroimage 2012;59:3774–83 doi:10.1016/j.neuroimage.2011.11.032 pmid:22119648
    CrossRefPubMed
  32. 32.↵
    1. Hagiwara A,
    2. Warntjes M,
    3. Hori M, et al
    . SyMRI of the brain: rapid quantification of relaxation rates and proton density, with synthetic MRI, automatic brain segmentation, and myelin measurement. Invest Radiology 2017;52:647–57 doi:10.1097/RLI.0000000000000365 pmid:28257339
    CrossRefPubMed
  33. 33.↵
    1. Sbardella E,
    2. Tona F,
    3. Petsas N, et al
    . DTI measurements in multiple sclerosis: evaluation of brain damage and clinical implications. Mult Scler Int 2013;2013:671730 doi:10.1155/2013/671730 pmid:23606965
    CrossRefPubMed
  34. 34.↵
    1. Liu Y,
    2. Duan Y,
    3. He Y, et al
    . Whole brain white matter changes revealed by multiple diffusion metrics in multiple sclerosis: a TBSS study. Eur J Radiology 2012;81:2826–32 doi:10.1016/j.ejrad.2011.11.022 pmid:22172535
    CrossRefPubMed
  35. 35.↵
    1. Huang J,
    2. Liu Y,
    3. Zhao T, et al
    . White matter microstructural alterations in clinically isolated syndrome and multiple sclerosis. J Clin Neurosci 2018;53:27–33 doi:10.1016/j.jocn.2018.01.007 pmid:29754967
    CrossRefPubMed
  36. 36.↵
    1. Miller DH,
    2. Barkhof F,
    3. Frank JA, et al
    . Measurement of atrophy in multiple sclerosis: pathological basis, methodological aspects and clinical relevance. Brain 2002;125:1676–95 doi:10.1093/brain/awf177 pmid:12135961
    CrossRefPubMed
  37. 37.↵
    1. Inglese M,
    2. Bester M
    . Diffusion imaging in multiple sclerosis: research and clinical implications. NMR Biomed 2010;23:865–72 doi:10.1002/nbm.1515 pmid:20882528
    CrossRefPubMed
  38. 38.↵
    1. Schneider T,
    2. Brownlee W,
    3. Zhang H, et al
    . Sensitivity of multi-shell NODDI to multiple sclerosis white matter changes: a pilot study. Funct Neurol 2017;32:97–101 doi:10.11138/FNeur/2017.32.2.097 pmid:28676143
    CrossRefPubMed
  39. 39.↵
    1. Chung AW,
    2. Seunarine KK,
    3. Clark CA
    . NODDI reproducibility and variability with magnetic field strength: a comparison between 1.5 T and 3 T. Hum Brain Mapp 2016;37:4550–65 doi:10.1002/hbm.23328 pmid:27477113
    CrossRefPubMed
  40. 40.↵
    1. Barbosa S,
    2. Blumhardt LD,
    3. Roberts N, et al
    . Magnetic resonance relaxation time mapping in multiple sclerosis: normal appearing white matter and the “invisible” lesion load. Magn Reson Imaging 1994;12:33–42 doi:10.1016/0730-725X(94)92350-7 pmid:8295506
    CrossRefPubMed
  41. 41.↵
    1. Davies GR,
    2. Hadjiprocopis A,
    3. Altmann DR, et al
    . Normal-appearing grey and white matter T1 abnormality in early relapsing-remitting multiple sclerosis: a longitudinal study. Mult Scler 2007;13:169–77 doi:10.1177/1352458506070726 pmid:17439881
    CrossRefPubMed
  42. 42.↵
    1. Shepherd TM,
    2. Kirov II,
    3. Charlson E, et al
    . New rapid, accurate T2 quantification detects pathology in normal-appearing brain regions of relapsing-remitting patients with MS. Neuroimage Clin 2017;14:363–70 doi:10.1016/j.nicl.2017.01.029 pmid:28239545
    CrossRefPubMed
  43. 43.↵
    1. Reitz SC,
    2. Hof SM,
    3. Fleischer V, et al
    . Multi-parametric quantitative MRI of normal appearing white matter in multiple sclerosis, and the effect of disease activity on T2. Brain Imaging Behav 2017;11:744–53 doi:10.1007/s11682-016-9550-5 pmid:27138529
    CrossRefPubMed
  44. 44.↵
    1. Fujita S,
    2. Hagiwara A,
    3. Hori M, et al
    . 3D quantitative synthetic MRI-derived cortical thickness and subcortical brain volumes: scan-rescan repeatability and comparison with conventional T1-weighted images. J Magn Reson Imaging 2019 Apr 10. [Epub ahead of print] doi:10.1002/jmri.26744 pmid:30968991
    CrossRefPubMed
  • Received June 6, 2019.
  • Accepted after revision July 28, 2019.
  • © 2019 by American Journal of Neuroradiology
View Abstract
PreviousNext
Back to top

In this issue

American Journal of Neuroradiology: 40 (10)
American Journal of Neuroradiology
Vol. 40, Issue 10
1 Oct 2019
  • Table of Contents
  • Index by author
  • Complete Issue (PDF)
Advertisement
Print
Download PDF
Email Article

Thank you for your interest in spreading the word on American Journal of Neuroradiology.

NOTE: We only request your email address so that the person you are recommending the page to knows that you wanted them to see it, and that it is not junk mail. We do not capture any email address.

Enter multiple addresses on separate lines or separate them with commas.
White Matter Abnormalities in Multiple Sclerosis Evaluated by Quantitative Synthetic MRI, Diffusion Tensor Imaging, and Neurite Orientation Dispersion and Density Imaging
(Your Name) has sent you a message from American Journal of Neuroradiology
(Your Name) thought you would like to see the American Journal of Neuroradiology web site.
CAPTCHA
This question is for testing whether or not you are a human visitor and to prevent automated spam submissions.
Cite this article
A. Hagiwara, K. Kamagata, K. Shimoji, K. Yokoyama, C. Andica, M. Hori, S. Fujita, T. Maekawa, R. Irie, T. Akashi, A. Wada, M. Suzuki, O. Abe, N. Hattori, S. Aoki
White Matter Abnormalities in Multiple Sclerosis Evaluated by Quantitative Synthetic MRI, Diffusion Tensor Imaging, and Neurite Orientation Dispersion and Density Imaging
American Journal of Neuroradiology Oct 2019, 40 (10) 1642-1648; DOI: 10.3174/ajnr.A6209

Citation Manager Formats

  • BibTeX
  • Bookends
  • EasyBib
  • EndNote (tagged)
  • EndNote 8 (xml)
  • Medlars
  • Mendeley
  • Papers
  • RefWorks Tagged
  • Ref Manager
  • RIS
  • Zotero
0 Responses
Respond to this article
Share
Bookmark this article
White Matter Abnormalities in Multiple Sclerosis Evaluated by Quantitative Synthetic MRI, Diffusion Tensor Imaging, and Neurite Orientation Dispersion and Density Imaging
A. Hagiwara, K. Kamagata, K. Shimoji, K. Yokoyama, C. Andica, M. Hori, S. Fujita, T. Maekawa, R. Irie, T. Akashi, A. Wada, M. Suzuki, O. Abe, N. Hattori, S. Aoki
American Journal of Neuroradiology Oct 2019, 40 (10) 1642-1648; DOI: 10.3174/ajnr.A6209
del.icio.us logo Twitter logo Facebook logo Mendeley logo
  • Tweet Widget
  • Facebook Like
  • Google Plus One
Purchase

Jump to section

  • Article
    • Abstract
    • ABBREVIATIONS:
    • Materials and Methods
    • Results
    • Discussion
    • Conclusions
    • Footnotes
    • References
  • Figures & Data
  • Supplemental
  • Info & Metrics
  • Responses
  • References
  • PDF

Related Articles

  • PubMed
  • Google Scholar

Cited By...

  • Longitudinal microstructural MRI markers of demyelination and neurodegeneration in early relapsing-remitting multiple sclerosis: magnetisation transfer, water diffusion and g-ratio
  • Estimating axial diffusivity in the NODDI model
  • Short-Range Structural Connections Are More Severely Damaged in Early-Stage MS
  • Myelin and Axonal Damage in Normal-Appearing White Matter in Patients with Moyamoya Disease
  • Crossref (12)
  • Google Scholar

This article has been cited by the following articles in journals that are participating in Crossref Cited-by Linking.

  • Advanced Diffusion MR Imaging for Multiple Sclerosis in the Brain and Spinal Cord
    Masaaki Hori, Tomoko Maekawa, Kouhei Kamiya, Akifumi Hagiwara, Masami Goto, Mariko Yoshida Takemura, Shohei Fujita, Christina Andica, Koji Kamagata, Julien Cohen-Adad, Shigeki Aoki
    Magnetic Resonance in Medical Sciences 2022 21 1
  • Disentangling in-vivo microstructural changes of white and gray matter in mild cognitive impairment and Alzheimer’s disease: a systematic review and meta-analysis
    Shuchang Zhong, Jingjing Lou, Ke Ma, Zhenyu Shu, Lin Chen, Chao Li, Qing Ye, Liang Zhou, Ye Shen, Xiangming Ye, Jie Zhang
    Brain Imaging and Behavior 2023 17 6
  • Myelin and Axonal Damage in Normal-Appearing White Matter in Patients with Moyamoya Disease
    S. Hara, M. Hori, A. Hagiwara, Y. Tsurushima, Y. Tanaka, T. Maehara, S. Aoki, T. Nariai
    American Journal of Neuroradiology 2020
  • Short-Range Structural Connections Are More Severely Damaged in Early-Stage MS
    H. Wu, C. Sun, X. Huang, R. Wei, Z. Li, D. Ke, R. Bai, H. Liang
    American Journal of Neuroradiology 2022 43 3
  • Altered regional brain white matter in dry eye patients: a brain imaging study
    Yun-Qing Luo, Rong-Bin Liang, San-Hua Xu, Yi-Cong Pan, Qiu-Yu Li, Hui-Ye Shu, Min Kang, Pin Yin, Li-Juan Zhang, Yi Shao
    Aging 2022 14 6
  • Non-contrast magnetic resonance evaluation of active multiple sclerosis lesions: Emerging role of quantitative synthetic magnetic resonance imaging
    Sachin Girdhar, Sruthi S Nair, Bejoy Thomas, Chandrasekharan Kesavadas
    The Neuroradiology Journal 2025 38 2
  • The Effect of Intraventricular Hemorrhage on Brain Development in Premature Infants: A Synthetic MRI Study
    Chunxiang Zhang, Xin Zhao, Meiying Cheng, Kaiyu Wang, Xiaoan Zhang
    Frontiers in Neurology 2021 12
  • Longitudinal Identification of Pre‐Lesional Tissue in Multiple Sclerosis With Advanced Diffusion MRI
    Maria Caranova, Júlia F. Soares, Daniela Jardim Pereira, Ana Cláudia Lima, Lívia Sousa, Sónia Batista, Miguel Castelo‐Branco, João V. Duarte
    Journal of Neuroimaging 2025 35 1
  • Reduced White Matter Fiber Density in Patients with Multiple Sclerosis
    Zeinab Gharaylou, Fatemeh Shahbodaghy, Pirhossein Kolivand, Maryam Kolivand, Fatemeh Azizzadeh, Masoumeh Rostampour
    Brain Connectivity 2024 14 3
  • Technical aspects and clinical applications of synthetic MRI: a scoping review
    Tancia Pires, Saikiran Pendem, Jaseemudheen M.M., Priyanka
    Diagnosis 2025

More in this TOC Section

Adult Brain

  • Diagnostic Neuroradiology of Monoclonal Antibodies
  • Clinical Outcomes After Chiari I Decompression
  • Segmentation of Brain Metastases with BLAST
Show more Adult Brain

Functional

  • Kurtosis and Epileptogenic Tubers: A Pilot Study
  • Glutaric Aciduria Type 1: DK vs. Conventional MRI
  • Multiparametric MRI in PEDS Pontine Glioma
Show more Functional

Similar Articles

Advertisement

Indexed Content

  • Current Issue
  • Accepted Manuscripts
  • Article Preview
  • Past Issues
  • Editorials
  • Editor's Choice
  • Fellows' Journal Club
  • Letters to the Editor
  • Video Articles

Cases

  • Case Collection
  • Archive - Case of the Week
  • Archive - Case of the Month
  • Archive - Classic Case

Special Collections

  • AJNR Awards
  • ASNR Foundation Special Collection
  • Most Impactful AJNR Articles
  • Photon-Counting CT
  • Spinal CSF Leak Articles (Jan 2020-June 2024)

More from AJNR

  • Trainee Corner
  • Imaging Protocols
  • MRI Safety Corner

Multimedia

  • AJNR Podcasts
  • AJNR Scantastics

Resources

  • Turnaround Time
  • Submit a Manuscript
  • Submit a Video Article
  • Submit an eLetter to the Editor/Response
  • Manuscript Submission Guidelines
  • Statistical Tips
  • Fast Publishing of Accepted Manuscripts
  • Graphical Abstract Preparation
  • Imaging Protocol Submission
  • Evidence-Based Medicine Level Guide
  • Publishing Checklists
  • Author Policies
  • Become a Reviewer/Academy of Reviewers
  • News and Updates

About Us

  • About AJNR
  • Editorial Board
  • Editorial Board Alumni
  • Alerts
  • Permissions
  • Not an AJNR Subscriber? Join Now
  • Advertise with Us
  • Librarian Resources
  • Feedback
  • Terms and Conditions
  • AJNR Editorial Board Alumni

American Society of Neuroradiology

  • Not an ASNR Member? Join Now

© 2025 by the American Society of Neuroradiology All rights, including for text and data mining, AI training, and similar technologies, are reserved.
Print ISSN: 0195-6108 Online ISSN: 1936-959X

Powered by HighWire