
Abstract
BACKGROUND AND PURPOSE: Most brain lesions are characterized by hyperintense signal on FLAIR. We sought to develop an automated deep learning–based method for segmentation of abnormalities on FLAIR and volumetric quantification on clinical brain MRIs across many pathologic entities and scanning parameters. We evaluated the performance of the algorithm compared with manual segmentation and existing automated methods.
MATERIALS AND METHODS: We adapted a U-Net convolutional neural network architecture for brain MRIs using 3D volumes. This network was retrospectively trained on 295 brain MRIs to perform automated FLAIR lesion segmentation. Performance was evaluated on 92 validation cases using Dice scores and voxelwise sensitivity and specificity, compared with radiologists' manual segmentations. The algorithm was also evaluated on measuring total lesion volume.
RESULTS: Our model demonstrated accurate FLAIR lesion segmentation performance (median Dice score, 0.79) on the validation dataset across a large range of lesion characteristics. Across 19 neurologic diseases, performance was significantly higher than existing methods (Dice, 0.56 and 0.41) and approached human performance (Dice, 0.81). There was a strong correlation between the predictions of lesion volume of the algorithm compared with true lesion volume (ρ = 0.99). Lesion segmentations were accurate across a large range of image-acquisition parameters on >30 different MR imaging scanners.
CONCLUSIONS: A 3D convolutional neural network adapted from a U-Net architecture can achieve high automated FLAIR segmentation performance on clinical brain MR imaging across a variety of underlying pathologies and image acquisition parameters. The method provides accurate volumetric lesion data that can be incorporated into assessments of disease burden or into radiologic reports.
ABBREVIATIONS:
- BIANCA
- Brain Intensity Abnormality Classification Algorithm
- CNN
- convolutional neural network
- FDR
- false discovery rate
- LST
- lesion segmentation tool
- RMdSPE
- root median squared percentage error
- RMSPE
- root mean squared percentage error
- SVID
- small-vessel ischemic disease
Approximately 36 million MR imaging studies are performed annually in the United States, and this number is rising.1 Approximately 65% of these MRIs are used to assess the central nervous system. The FLAIR sequence is universally used to identify and characterize imaging abnormalities in terms of location, size, and extent, due to its broad utility across many pathologies and lesion appearances. Specific applications of FLAIR include, among numerous others, primary and metastatic brain tumors; demyelinating, autoimmune, infectious, and inflammatory conditions; and ischemia.2⇓–4 Because of its general utility, FLAIR is acquired on nearly every clinical brain MRI. There is a growing need to develop fully automated, rapid, precise, quantitative assessments of FLAIR abnormalities to standardize quantitative descriptions of pathology.
A quantitative lesion-burden assessment has the potential to reduce errors from interobserver variability, 2D measurements, “satisfaction of search,” and confirmation bias, promising to improve workflow efficiency and diagnostic accuracy, eventually translating to better patient outcomes.5,6 To this aim, machine learning methods have been used for identifying FLAIR lesions in specific diseases, such as gliomas,7,8 multiple sclerosis,9⇓–11 acute infarcts,12,13 traumatic brain injury,14 and white matter hyperintensities related to small-vessel ischemic disease and Alzheimer disease.15⇓–17 These methods represent specialized tools for distinct research purposes.18
No methods currently exist to identify FLAIR lesions independent of the underlying etiology in a clinical environment. Many brain MRIs are obtained before a known diagnosis. Furthermore, existing algorithms often assume specific requirements for image acquisition, further decreasing clinical utility. In the clinical setting, brain MRIs and their FLAIR sequences may be acquired with differing image-acquisition parameters and resolutions, which are often suboptimal for automated algorithms. To be clinically applicable across most brain MRIs, a lesion segmentation method must operate well, despite this high degree of image and lesion heterogeneity.
Deep learning–based approaches have recently demonstrated success with a variety of other image-segmentation tasks, including intracranial hemorrhage segmentation on CT,19 structural neuroanatomy classification on brain MR imaging,20 cartilage segmentation on knee MR imaging,21 and left ventricular volume on cardiac MR imaging.22 The winner of the 20th International Conference on Medical Image Computing and Computer Assisted Intervention (MICCAI) 2017 challenge for white matter hyperintensity segmentation23 was based on a U-Net.24 Therefore, we adopted a deep learning approach, adapting a U-Net convolutional neural network (CNN) architecture for 3D imaging for the task of disease-invariant FLAIR lesion segmentation. Our study was designed to test this automated FLAIR lesion-segmentation algorithm on 19 different brain pathologies producing a wide range of lesion appearances and to compare CNN-based automated segmentations with those of manual lesion segmentations and existing automated tools.
Materials and Methods
Subjects and Data
This retrospective study was approved by the institutional review board of the University of Pennsylvania, with a waiver for consent. A total of 387 study subjects (218 females and 169 males; age range, 14–95 years; median age, 53 years) were included, with 1 MRI (2 sequences: T1-weighted and FLAIR) per subject. Subjects were identified by searching the radiology archives of our tertiary care university hospital (Hospital of the University of Pennsylvania) for 19 prespecified diagnoses, confirmed using the electronic medical record and procedures detailed in the On-line Appendix.
Diseases and Training/Validation Assignment
The 19 diseases included in the validation sample are listed in the On-line Appendix (see also Fig 1). These diseases encompass a large range that cause FLAIR abnormalities on brain MR imaging. They were also specifically chosen to represent a very heterogeneous sample, including wide ranges of individual lesion and total lesion volumes and heterogeneity in lesion shape and internal signal characteristics.

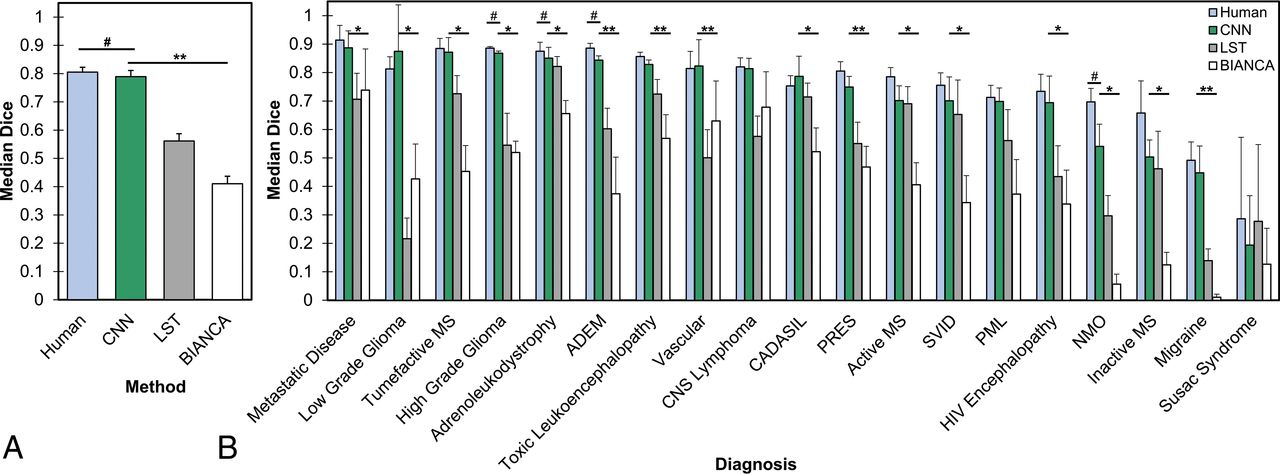
Performance of the CNN compared with human manual segmentation and other automated FLAIR segmentation methods. A, Median Dice scores across all validation cases. The asterisks denotes P < .05 for paired 2-tailed t tests compared with the CNN. The hashtag denotes P < .05 for human performance compared with the CNN. B, Median Dice scores across validation cases separated by underlying diagnosis. The asterisk denotes P < .05 (FDR-corrected for multiple comparisons) for the CNN compared with 1 method, and double asterisks denote P < .05 (FDR-corrected for multiple comparisons) for CNN compared with both methods using paired 2-tailed t tests. The hashtag separately denotes P < .05 (FDR-corrected for multiple comparisons) for human performance compared with the CNN. Error bars represent 1 standard error of the mean) across cases. ADEM indicates acute disseminated encephalomyelitis; PRES, posterior reversible encephalopathy syndrome; PML, progressive multifocal leukoencephalopathy; NMO, neuromyelitis optica.
In assigning cases to training and validation samples, we randomly selected 5 cases of each of the 19 unique diseases to be part of the validation sample. When diagnoses were rare enough that <5 exemplars of the disease existed in the PACS of our institution (which was only the case with Susac syndrome), then all cases of that disease were included in the validation set (none in the training set). The remainder of the cases were assigned to the training set. The training set was also supplemented with 20 age-matched healthy brains (without abnormality on FLAIR) to further boost specificity; more healthy cases were unnecessary given that the remainder of the training cases already included many individual regions without abnormality on FLAIR.
Assignments resulted in 295 training cases and 92 validation cases. Because no hyperparameter optimization was performed (see “CNN Model Architecture [U-Net]” below), this study did not require separate test and validation sets. The model was trained with only the training dataset and was separately tested on the validation dataset.
MR Imaging Parameters and Ground Truth Segmentations
Imaging data stemmed from a wide range of imaging parameters (Table 1), typical of clinical imaging studies. Moreover, imaging was performed on >30 different MR imaging scanners and 16 different scanner models across all study subjects. Image-acquisition parameters for the training sample were similar to those on the validation sample (randomly assigned).
Heterogeneous scanning parameters used for FLAIR sequences in training and validation samples, showing the number of study subjects in each categorya
Criterion standard lesion segmentations were based on manual segmentations by a radiologist using ITK-SNAP (www.itksnap.org),25 further described in the On-line Appendix.
Image Preprocessing
Skull stripping of T1-weighted images was performed with Advanced Normalization Tools (ANTs; http://neuro.debian.net/pkgs/ants.html), which were then registered and applied to FLAIR images.26 Images were normalized by the mean and SD signal intensity to zero mean and unit SDs. Images were resampled to 1-mm3 isotropic resolution via linear interpolation. Despite most MR imaging acquisitions being 2D (Table 1), all 2D and 3D acquisitions were treated with the same preprocessing steps to produce common resolution 1-mm3 volumes suitable for use in a 3D-CNN architecture. Elastic transformations27 were applied to the images for data augmentation, which included small random rotations, translations, scaling, and free-form deformations. We split the full-resolution augmented imaging volume into 96-mm3 cubes (3D patches) as the network input to fit within graphic memory constraints. Note that these 3D regions encompass a large portion of the full-resolution imaging volume (Fig 2) and are created only to address memory constraints. The large patches, in comparison with the size of any lesion, ensure that the lesion transition zones are included within the patches. During training, the cubes were randomly sampled across the full-brain volumes. To prevent sample imbalance, we sampled the same number of patches that included lesion voxels as those that excluded lesions during training. A total of 80 patches were extracted from each training case, with 3 random augmentations per case, resulting in 240 patches per case or a total of 70,800 training patches. During testing, the brain volume was densely sampled with the cubes using a step size of 32 mm in each direction, resulting in a 64-mm overlap between cubes. The overlapped segmentation predictions were averaged.

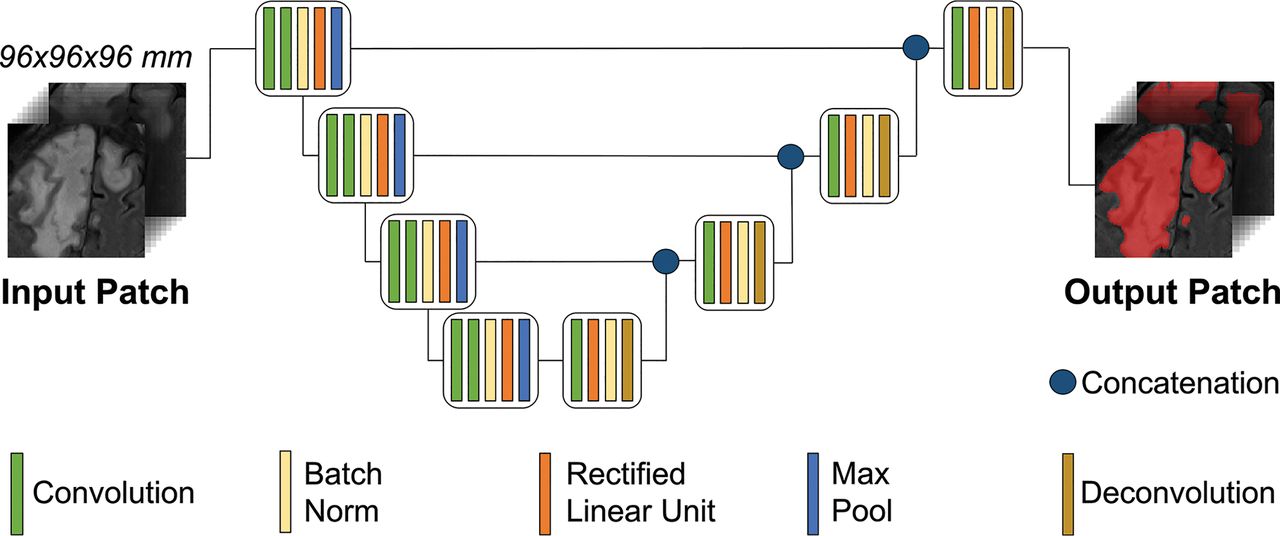
Schematic of the CNN U-net architecture. The architecture uses a 3D region-based approach for training and validation. The sample MR FLAIR images are from a patient with progressive multifocal leukoencephalopathy. Max indicates maximum.
CNN Model Architecture (U-Net)
We used a fine-tuned 3D U-Net28,29 to predict lesion segmentations on the FLAIR images because of the ability of the U-Net to provide pixelwise/voxelwise predictions, ideal for voxelwise segmentation problems. The network consists of 4 consecutive down-sampled blocks followed by 4 consecutive up-sampled blocks. We used the rectified linear unit for nonlinearity. For down-sampling, we used a stride-2 convolution; for up-sampling, we used a stride-2 deconvolution. We used the kernel size 3 × 3 × 3 across the network. We applied a dilation factor of 2 in all convolutional layers. Other than the standard cross-link between corresponding up-sampling and down-sampling blocks, we also added a residual connection between subsequent layers, with a number of features matched by a plain 1 × 1 × 1 convolution. After the final up-sampling block, 3 additional convolutional, rectified linear unit, batched-normalized layers were added before the final normalized exponential (softmax) head function (Fig 2). A batch consisted of six 3D patches.
We used standard cross-entropy loss29 and an Adam optimizer with a learning rate of 10−5. The network was trained for 50 epochs. The network was implemented using TensorFlow (https://www.tensorflow.org/),30 a deep learning module within the Python programming language. Implementation was on a Titan Xp GPU (NVIDIA, Santa Clara, California).
Comparison Algorithms
We compared CNN performance against that of previously published automated algorithms designed for FLAIR lesion identification: lesion segmentation tool (LST; https://www.applied-statistics.de/lst.html)31 and Brain Intensity Abnormality Classification Algorithm (BIANCA; https://fsl.fmrib.ox.ac.uk/fsl/fslwiki/BIANCA).32 We also compared the performance with a second independent radiologist's manual segmentations, which we refer to as “human performance.” These methods were all applied to the same validation dataset. Refer to the On-line Appendix for additional information on comparison methods.
Statistical Analysis
The performance of our U-Net architecture neural network was validated against the manual-segmentation criterion standard on 92 cases (ie, FLAIR volumes) representing 19 different diseases, after being trained on 295 FLAIR volumes. Although acquisition parameters included 2D and 3D methods (Table 1), we refer to all cases as FLAIR volumes, given that we resampled all images to a 1-mm3 resolution (ie, a 3D volume) for CNN training and validation, before resampling back into native space for comparison with native space manual segmentations. All analyses were performed in subject native space. Segmentation performance of all methods was compared using Dice coefficients,33 the most commonly used similarity measure for evaluating segmentation performance, with manual lesion segmentations as the ground truth. Voxelwise performance measures compared with manual segmentation were also calculated. Comparisons of performance across methods was accomplished using paired 2-tailed t tests. Additional statistical comparisons are discussed in the On-line Appendix.
Results
CNN-Based FLAIR Lesion Segmentation Accuracy
The CNN segments brain MR lesions qualitatively with a high degree of accuracy. Representative comparisons of CNN-based automatic segmentations and criterion standard manual segmentations are shown in Fig 3 (see also On-line Fig 2 and the On-line Appendix).
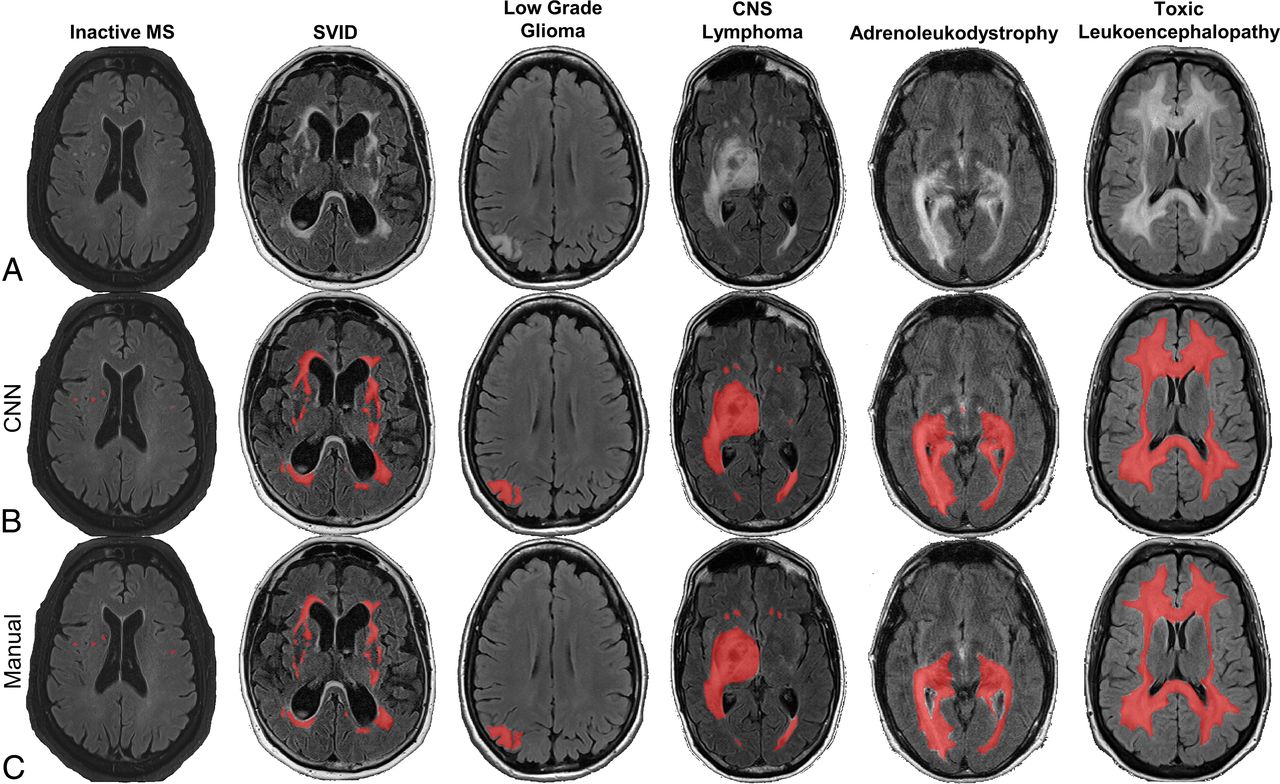
Representative slices from validation samples of FLAIR MR brain images (A) with CNN-based (B) and manual lesion segmentations (C), with predicted or ground truth lesion segmentations overlaid in red. The CNN performs well on a variety of different neurologic disorders, here shown in cases of multiple sclerosis, SVID, low grade-glioma, primary CNS lymphoma, adrenoleukodystrophy, and toxic leukoencephalopathy.
We quantified CNN segmentation performance across all validation cases using Dice scores, and we compared its performance with existing state-of-the-art automated FLAIR segmentation methods, LST and BIANCA31,32 and with a second independent radiologist. Across the validation sample, the CNN demonstrated a median Dice score of 0.789 (mean, 0.699 ± 0.022), which approached human performance (Fig 1A). This performance was significantly higher than the Dice scores of LST (median, 0.562; mean, 0.533 ± 0.026) and BIANCA (median, 0.410; mean, 0.395 ± 0.027) (ANOVA and paired 2-tailed t tests compared with CNN; P < .001). Similarly, among the algorithms tested, other voxelwise measures of performance were highest for the CNN (Table 2). Human performance (median Dice, 0.805; mean, 0.759 ± 0.017) was very slightly-but-consistently better than CNN performance (P < .01, paired 2-tailed t test).
Summary measures of accuracy (Dice, voxelwise sensitivity, specificity, FDR, PPV/NPV) and comparisons of true and predicted lesion volumes by forecasting RMdSPE and Spearman correlation r of methodsa
Effect of Disease Pathology
Next, we examined how segmentation performance varies as a function of underlying disease pathology. The CNN had significantly higher mean Dice scores than at least 1 of the other methods in 16/19 diagnoses and significantly higher than those in both other methods in 5/19 diagnoses (paired 2-tailed t tests, P < .05; false discovery rate [FDR]-corrected for multiple comparisons). Segmentation performance was not statistically different from the performance of the independent radiologist's manual segmentations in 15/19 diagnoses. Note that low sample sizes within each diagnosis group limit statistical power, but the median Dice was numerically higher for the CNN than the other methods in all diseases except Susac syndrome (Fig 1B). Even for those diseases for which LST and BIANCA were specifically designed (multiple sclerosis and small-vessel ischemic disease [SVID], respectively), the CNN produced segmentations that were better than those for SVID (P < .05, paired t test comparing CNN and BIANCA) or not significantly different from those for MS (P > .05, paired t test comparing CNN and LST), the comparison algorithms. Performance was consistently low for Susac syndrome across all methods, likely due to a combination of factors, including the following: a large amount of noise and imaging artifacts, only 2 cases total available (none in the training data), and very small and limited extent of lesions in these 2 cases. Note the low performance of the independent radiologist for these cases as well. Heterogeneity of FLAIR signal within a lesion did not prove a barrier to accurate segmentation; performance on 16 validation cases with heterogeneous FLAIR lesions was excellent, with a median Dice score of 0.87 (range, 0.80–0.92; On-line Fig 2).
Lesion Volume Quantification
We found that the CNN performs well in estimating total lesion volume, with a Spearman correlation ρ = 0.985 and a best fit line slope β = 0.958 when comparing predicted with true total lesion volume across all cases, indicating a very high degree of fidelity between the predicted and true total lesion volumes on an individual subject basis (Fig 4A). The comparison methods, meanwhile, had lower Spearman correlations (LST ρ = 0.862, BIANCA ρ = 0.655) and lower best fit line slopes (LST β = 0.490, BIANCA β = 0.277), with both methods tending to overestimate smaller lesion volumes and underestimate larger lesion volumes. We also analyzed the degree of error in the predicted lesion volume on a subject-specific basis using the root median squared percentage error (RMdSPE) and the root mean squared percentage error (RMSPE), which measure the average percentage error from true lesion volume. The CNN generated lesion volumes with lower errors (RMdSPE = 1.4%, RMSPE = 4.8%) compared with LST (RMdSPE = 3.8%, RMSPE = 72.3%) and BIANCA (RMdSPE = 6.6%, RMSPE = 433.8%) (Table 2).

Performance of segmentation methods according to lesion characteristics. A, Scatterplot of predicted-versus-true total lesion volume with CNN (green circle) (Spearman correlation ρ = 0.985, best fit line slope β = 0.958), LST (gray square) ρ = 0.862, β = 0.490), and BIANCA (white triangle) (ρ = 0.655, β = 0.277) with the y = x line. Note clustering of CNN points along the y = x line, representing low deviation of CNN-based volume estimates from manual lesion volumes. B, Median Dice scores of cases stratified by total lesion volume. C, False discovery rate stratified by total lesion volume. D, Scatterplot of median CNN Dice score versus median true total lesion volume per diagnostic group. E, Median Dice scores of cases grouped by mean individual lesion volume. F, Histogram of lesion volumes in training and validation datasets. Error bars in all panels represent ±1 standard error of the mean across cases. The asterisk denotes P < .01 for the CNN compared with 1 method, and double asterisks denote P < .01 for CNN compared with both methods using 1-way group ANOVA and paired 2-tailed t tests. The hashtag separately denotes P < .05 for human performance compared with the CNN. ADEM indicates acute disseminated encephalomyelitis; ALD, adrenoleukodystrophy; TLE, toxic leukoencephalopathy; aMS, active MS: tMS, tumefactive MS; PRES, posterior reversible encephalopathy syndrome; iMS, inactive MS; NMO, neuromyelitis optica; Vasc, Vascular disease (ischemia); CNSL, CNS lymphoma; Susac S, Susac syndrome; lg, low-grade; hg, high-grade; PML, progressive multifocal leukoencephalopathy.
Effect of Lesion Volume
We investigated how each method performed as a function of lesion volume (Fig 4B). As expected, all methods performed better with larger total lesion volumes, which is partially inherent in the Dice similarity index33,34 and was also true of the independent radiologist's performance. However, the CNN performed the best of the 3 automated methods at all lesion volumes (ANOVA and paired 2-sample t tests compared with CNN P < .01), and performance did not degrade even at the highest lesion volumes (>100 cm3), whereas performance did degrade slightly at the highest lesion volumes for the other methods (Fig 4B). Even at very low total lesion volumes, the CNN produced reasonable estimates, with Dice scores of ∼0.55 and accurate estimates of lesion volume (Fig 3, inactive case of MS, as an example), whereas the other methods performed poorly in these cases. Similarly, false-positive voxels were most common for all methods in cases with low lesion volumes, but this effect was much less pronounced with the CNN and with a second radiologist (Fig 4C).
When we categorized diseases by median CNN Dice and true lesion volume, no apparent clusters arose on the basis of etiology (Fig 4D), noting that the lowest Dice scores were for diseases in which the total lesion volume and individual lesion sizes tend to be small (migraine, multiple sclerosis, neuromyelitis optica, and Susac syndrome). Indeed, Dice scores for all methods including human segmentation depend on individual lesion sizes, with poorer performance in cases with small lesions (Fig 4E) due to a higher number of false-positive and false-negative voxels in these cases (On-line Fig 1). In summary, Dice scores within each disease are driven mainly by lesion size/volume but are otherwise independent of pathology, demonstrating the broad utility of the CNN for a range of diseases.
Effect of Technical Factors
We investigated whether CNN performance depends on technical acquisition factors such as MR imaging scanner models or acquisition parameters (Fig 5). We found no significant differences in CNN performance with respect to different scanner models (1-way ANOVA of Dice across 16 scanner types, F = 0.65, P = .84) or manufacturers (1-way ANOVA across 4 manufacturers, F = 0.61, P = .61). We also found no correlation between the number of training cases and validation performance across scanner types (r2 = 0.015, P = .65, Fig 5B). Thus, the CNN generalizes well across scanner types. Similarly, there was no effect of field strength on performance (2-sample t test, P = 0.22). There was a trend toward better performance with 2D acquisition sequences (P = .06), noting an inherent bias in that patients with small lesions (in particular those with MS) more commonly undergo 3D acquisitions at our institution. Finally, we tested whether performance decreased when the CNN is applied to imaging from outside hospitals. In contrast, we found slightly better Dice scores on those scans obtained at outside hospitals than at our home institution (P < .05), but with no significant difference after accounting for mean lesion size (P = .85), which was overall larger in cases from outside hospitals.

Performance of the CNN segmentation method according to technical characteristics. A, Median Dice scores on validation cases across different scanner models, grouped by MR imaging manufacturer. The dashed line indicates overall mean Dice score. There was no significant difference in Dice scores according to scanner model or manufacturer (P > .05 by 1-way ANOVA, see Results). B, Median Dice scores according to the number of training cases from that scanner model, with the best fit line. There is no significant correlation between the number of training cases and Dice scores (P > .05). C, Median Dice scores on validation cases grouped by field strength (left panel), acquisition dimension (middle panel), and hospital system where images were acquired (right panel). Error bars in all panels represent ± 1 standard error of the mean across cases. The asterisk denotes P < .05 for the 2-tailed t test among groups. See Table 1 for manufacturers' information. Ess indicates Essenza.
Inference Time
One advantage of automated methods over manual lesion segmentation is processing speed. The mean inference time of the CNN on a single FLAIR volume is 28.2 ± 1.48 seconds, which includes all preprocessing steps (brain extraction, interpolation, patches, and so forth), model loading, and model application. The average inference of BIANCA for a single subject was fastest at 4.6 ± 1.35 seconds, also including relevant preprocessing steps. LST was the slowest, with a mean inference time of 1.8 minutes ± 34.0 seconds. All of these times compare favorably with those of manual lesion segmentations, which take, on average, approximately 15–20 minutes for a single FLAIR volume by an experienced individual.
Discussion
This study is the first demonstration of a quantitative, automated FLAIR lesion evaluation algorithm that applies to a multitude of clinically distinct and radiologically unique pathologies. The CNN, specifically a U-Net,28 functions on clinical-grade images from a PACS. We demonstrate that this CNN performs high-quality lesion segmentations despite a number of heterogeneous scanners, image acquisition parameters, lesion sizes, and underlying diagnoses, even with modest training data (≤5 cases per diagnosis).
The CNN performs well at FLAIR lesion segmentation across these variables because of the basic commonality that all these disease pathologies share: hyperintense FLAIR signal. Our 3D-U-Net method is specifically designed for and trained on noisy real-world clinical images to identify hyperintense FLAIR signal while avoiding artifacts. The utility of an algorithm that is broadly trained on hyperintense FLAIR signal, as opposed to specific diseases, is that it can be used in clinical situations even when the diagnosis is unknown. Thus, the CNN can provide accurate lesion-volume estimates on any disease with hyperintense FLAIR signal without being extensively trained with any particular pathology, noting that specific training with 1 disease may boost performance for that disease at the detriment of others. In contrast to using disease-specific methods, we also intentionally avoided inclusion of other MR images beyond FLAIR, such as T1,24 in the training model because those sequences do not consistently show abnormalities across the wide range of pathologies included in the study or in neuroimaging generally.
As a result, the CNN estimates true total lesion volumes with very high fidelity across a range of 19 diseases tested here, thereby making the algorithm clinically applicable to quantitatively measuring lesion volume. The CNN outperforms current state-of-the-art algorithms in brain FLAIR lesion segmentation, as measured by Dice overlap coefficients, false-positives, false-negatives, and predictions of lesion volume. On clinical imaging, it outperforms or is equivalent to these algorithms both on those diseases for which those algorithms are designed (MS for LST and SVID for BIANCA), as well as for diseases (eg, adrenoleukodystrophy) for which no algorithms currently exist. For high-grade glioma whole-tumor segmentation, it functions at a level comparable with the winning algorithms from the Brain Tumor Image Segmentation (BraTS 2017) challenge.35⇓–37 Overall, it functions nearly at the level of a human expert.
Another strength of the current method is that it generates accurate lesion segmentations despite a very heterogeneous array of imaging-acquisition parameters. This particular feature allows the methodology to be easily integrated into the clinical workflow because it has no specific requirements for FLAIR image acquisition. In addition to supporting the clinical workflow, the method has strong potential to be applied retrospectively in extracting quantitative lesion data from the massive amount of clinical data available in PACS storage across radiology departments. When used in combination with natural language processing on radiology reports or other diagnostic data from electronic medical records, these measures may support the association of quantitative lesion characteristics with various neurologic diseases on a large scale.
There is room for further improvement in the methodology. From a technical standpoint, we found that the most difficult cases for the CNN, as with any method, are cases with a small extent of lesions and small lesion sizes. Further developments in the neural network model architecture and training, including hyperparameter optimization, additional training cases, and/or the use of specialized techniques such as a second object localization network,19 may continue to boost performance in such situations. Specific training methods have been developed for avoiding false-positives, such as fine-tuning the network with more representative baseline lesion distributions or using the Dice score as the loss function.28
Furthermore, while the current results are promising, there are limitations to the conclusions we can draw from this cross-sectional retrospective study. Prospective use of the technology may encounter a different typical range of lesion appearances than in our study. However, we expect the CNN to iteratively improve in such situations, further learning from the cases at an institution. The algorithm already appears to generalize well across multiple MR imaging scanners, even from outside institutions. Finally, a critically important test of the system for future clinical implementation will be to test the longitudinal precision of the methodology, to evaluate changes in lesion volume with time. Current studies are underway to address these important questions.
Conclusions
Our findings indicate that a fully-automated deep learning algorithm can achieve high performance on brain MR imaging (FLAIR) lesion segmentation across an array of different diseases and image acquisitions. It outperforms current state-of-the-art FLAIR lesion segmentation algorithms in detecting lesions and quantifying their volume, and it approaches near-human performance. We anticipate that such a system may be useful for descriptions of brain lesions in the clinical setting, replacing subjective, qualitative assessments with objective quantitative metrics, an essential component of a modern and efficient neuroradiologic workflow.
Acknowledgments
We graciously acknowledge NVIDIA for the donation of 2 Titan Xp GPUs, through their GPU Grant Program, that were used for this research.
Footnotes
Michael Tran Duong and Jeffrey D. Rudie contributed equally to this work and are co-first authors.
Disclosures: Jeffrey D. Rudie—RELATED: Grant: National Institutes of Health T32-EB004311-10 (Research Track Radiology Residency), Radiological Society of North America Resident Research Grant (RR1778)*; UNRELATED: Grants/Grants Pending: American Society for Neuroradiology, Radiological Society of North America, Comments: I have applied for additional grants to fund related work.* Suyash Mohan—UNRELATED: Grants/Grants Pending: Galileo Clinical Decision Support, Comments: research grant.* Andreas M. Rauschecker—RELATED: Grant: Radiological Society of North America Resident Research and Education Foundation, Comments: Resident Research Grant RR1778*; Other: National Institutes of Health, Comments: T32 Training Grants: T32-EB004311–10, T32-EB001631–14*; UNRELATED: Support for Travel to Meetings for the Study or Other Purposes: American College of Radiology–Association of University Radiologists Research Scholar Program, Comments: $1000 to support travel to and presentation at the Association of University Radiologists 2018 on this work.* James C. Gee—RELATED: Grant: National Institutes of Health, Comments: National Institutes of Health grants supported the contribution and participation of me and my lab members with respect to development, evaluation, and application of methods for neuroimage processing and analysis*; UNRELATED: Employment: University of Electronic Science and Technology of China, Comments: I receive effort support for my role as Director of Center for Health Innovation at University of Pennsylvania–University of Electronic Science and Technology of China; Stock/Stock Options: mutual funds, Comments: as part of general retirement investment portfolio; Travel/Accommodations/Meeting Expenses Unrelated To Activities Listed: various scientific societies and academic institutions, Comments: for invited scientific lectures and presentations. *Money paid to the institution.
A.M. Rauschecker was supported by a Radiological Society of North America Resident Grant (RR1778). A.M. Rauschecker and Jeffrey D. Rudie were supported by a National Institutes of Health T-32 Training Grant from Penn Radiology for the duration of the project (T32-EB004311-10). A.M. Rauschecker was also supported by a National Institutes of Health T-32 Training Grant from the University of California, San Francisco, Radiology, for a portion of the project (T32-EB001631-14).
Indicates open access to non-subscribers at www.ajnr.org
REFERENCES
- Received January 28, 2019.
- Accepted after revision June 17, 2019.
- © 2019 by American Journal of Neuroradiology


Jump to section
Related Articles
Cited By...
- 3D Capsule Networks for Brain Image Segmentation
- 3D Capsule Networks for Brain Image Segmentation
- Development of Gestational Age-Based Fetal Brain and Intracranial Volume Reference Norms Using Deep Learning
- A Stacked Generalization of 3D Orthogonal Deep Learning Convolutional Neural Networks for Improved Detection of White Matter Hyperintensities in 3D FLAIR Images