
Abstract
BACKGROUND AND PURPOSE: NeuroQuant is an FDA-approved software that performs automated MR imaging quantitative volumetric analysis. This study aimed to compare the accuracy of NeuroQuant analysis with visual MR imaging analysis by neuroradiologists with expertise in epilepsy in identifying hippocampal sclerosis.
MATERIALS AND METHODS: We reviewed 144 adult patients who underwent presurgical evaluation for temporal lobe epilepsy. The reference standard for hippocampal sclerosis was defined by having hippocampal sclerosis on pathology (n = 61) or not having hippocampal sclerosis on pathology (n = 83). Sensitivities, specificities, positive predictive values, and negative predictive values were compared between NeuroQuant analysis and visual MR imaging analysis by using a McNemar paired test of proportions and the Bayes theorem.
RESULTS: NeuroQuant analysis had a similar specificity to neuroradiologist visual MR imaging analysis (90.4% versus 91.6%; P = .99) but a lower sensitivity (69.0% versus 93.0%, P < .001). The positive predictive value of NeuroQuant analysis was comparable with visual MR imaging analysis (84.0% versus 89.1%), whereas the negative predictive value was not comparable (79.8% versus 95.0%).
CONCLUSIONS: Visual MR imaging analysis by a neuroradiologist with expertise in epilepsy had a higher sensitivity than did NeuroQuant analysis, likely due to the inability of NeuroQuant to evaluate changes in hippocampal T2 signal or architecture. Given that there was no significant difference in specificity between NeuroQuant analysis and visual MR imaging analysis, NeuroQuant can be a valuable tool when the results are positive, particularly in centers that lack neuroradiologists with expertise in epilepsy, to help identify and refer candidates for temporal lobe epilepsy resection. In contrast, a negative test could justify a case referral for further evaluation to ensure that false-negatives are detected.
ABBREVIATIONS:
- HS
- hippocampal sclerosis
- PPV
- positive predictive value
- NPV
- negative predictive value
Hippocampal sclerosis (HS) is one of the most common neuropathologic substrates of temporal lobe epilepsy, which often requires surgical resection in patients who are drug resistant. The current clinical standard of practice for the evaluation of drug-resistant seizures requires a neuroradiologist’s assessment of the patient’s brain MR imaging. The ability to detect lesions (HS or other lesions) is known to correlate with marked improvement in surgical outcomes and may motivate the treating neurologist to initiate a surgical evaluation. Literature that compares the ability of general radiologists with that of neuroradiologists with expertise in epilepsy in identifying HS is limited but suggests a superiority that favors trained specialists.
A study from 2002 by Von Oertzen et al1 claimed that “nonexpert” neuroradiologists who evaluated standard MRIs in patients with temporal and extra-temporal epilepsies had a sensitivity of 39% in detecting epileptogenic abnormalities compared with 50% by neuroradiologists who had expertise in epilepsy reading standard MRIs and 91% when reading epilepsy-dedicated MRIs. These figures include different types of lesions; however, the exact figures for HS sensitivity and specificity are not clear in that study.1 Nevertheless, such performance discrepancies contribute to a health care delivery gap that needs to be bridged to allow centers without dedicated expertise to detect epileptogenic lesions, including HS, and to better identify patients in need of surgical evaluation. This gap is particularly relevant, given abundant literature that demonstrates the underutilization of epilepsy surgery, partly attributed to the reluctance to refer patients who are “nonlesional” for a surgical evaluation for fear of a lower odds of postoperative seizure freedom.2⇓-4
NeuroQuant is the first FDA-approved automated software (CorTechs Labs, San Diego, California) that provides absolute volumes of brain structures as well as the relative volume between left- and right-sided structures (eg, left hippocampus relative to the right hippocampus) and compares the structural volumes to a normative control (with results reported as percentiles compared with the normative cohort). It was previously used to assess hippocampal volume changes in patients with Alzheimer disease,5 traumatic brain injury,6 and multiple sclerosis,7,8 but studies in epilepsy have been limited by heterogeneous patient cohorts,9,10 and small sample sizes.11 Furthermore, none of these studies were based on a histopathologic confirmation of HS as a reference standard. These limitations complicate the clinical applicability and generalizability of NeuroQuant analysis for epilepsy. The purpose of this study was to compare the clinical accuracy, sensitivity, and specificity of a neuroradiologist with expertise in epilepsy with that of volumetric analysis with NeuroQuant.
METHODS
Study Design and Patient Selection
We selected adult patients from our tertiary-care center who underwent a comprehensive presurgical evaluation for temporal lobe epilepsy resections from 2010 to 2017. The presurgical evaluation consisted of clinical history, video electroencephalography, PET, and MR imaging, in addition to SPECT, magnetoencephalography, and invasive electroencephalography when indicated. Patients were included if they had a 3T preoperative MR imaging and a postoperative hippocampal pathology report. We excluded patients with hippocampal tumors on pathology (n = 8) to avoid the volumetric software counting tumor as hippocampal volume or patients with a history of epilepsy surgery (n = 22). We included a total of 144 patients in the analysis, 61 with HS confirmed by histopathology and 83 patients with histopathology negative results for HS. This study was approved by the Cleveland Clinic Institutional Review Board.
Definition of HS
Postoperative histologic analysis was reviewed by an epilepsy-trained neuropathologist (I.B.). Each patient in this study was classified as HS+ (histopathology diagnostic of HS) as defined by using the most recent International League Against Epilepsy classification system of clinical-neuropathologic subtypes of mesial temporal sclerosis,12,13 or as HS– (the hippocampus is normal on histopathology or shows nonspecific findings). This histologic classification was the reference standard that we used to assess the accuracy of expert visual MR imaging analysis relative to NeuroQuant analysis in identifying HS.
MR Imaging Visual Analysis
All MRIs in this study were acquired on a 3T scanner and were reviewed before surgery by a neuroradiologist with expertise in epilepsy in the setting of an interdisciplinary epilepsy patient management conference in which patients are assessed for potential surgical interventions. The interdisciplinary team consists of neuroradiologists with epilepsy expertise, epileptologists, epilepsy-trained neurosurgeons, and neuropsychologists. There are 4 main neuroradiologists at our institution who provide the preoperative MR imaging assessments for the patient management conferences, with an average of 20 years of experience (minimum of 3 years) with epilepsy imaging and research. Only 1 neuroradiologist at a time attends the meeting to provide an official reading of the MR imaging.
After the case is presented, the MR imaging is reviewed and the neuroradiologist confirms the final impression. The standard MR imaging protocol for this study consisted of a 3T sagittal T1-weighted sequence, axial FLAIR and DWI sequences, volumetric coronal T1-weighted MPRAGE, thin-section coronal FLAIR, and T2-weighted sequences. In addition, the team had access to past MR imaging studies, the patient’s semiology, and other studies (eg, PET, SPECT, electroencephalography) to aid in the holistic determination of the patient’s HS status. The inclusion of other studies beyond MR imaging also helped to lower the risk of favoring a solely imaging-based diagnosis because patients could be referred for surgery even in the absence of MR imaging findings.
Criteria for MR Imaging Signs of HS
Each patient was classified as having MR imaging signs of HS (visual MR imaging HS+) or not (visual MR imaging HS–) by using features such as an increased T2/FLAIR signal, loss of hippocampal architecture, and loss of hippocampal volume. Ancillary signs included volume loss of the temporal pole and a corresponding subcortical white matter signal abnormality. There were a total of 80 visual MR imaging HS– and 64 visual MR imaging HS+ included in this study. Any MR imaging studies that showed questionable signs of HS were classified as visual MR imaging HS–.
Quantitative Hippocampal Volumetric Analysis by Using NeuroQuant Software
T1 MRIs were de-identified before uploading to the NeuroQuant servers. The NeuroQuant software segments T1 volumetric images, quantifies various volumes of the brain, and compares them against a normative data base adjusted for age (3 to 100 years), sex, and cranial volume.14 NeuroQuant is easy to use and is compatible with 1.5T and 3T noncontrast MR imaging, which creates volumetric reports in roughly 5–10 minutes (Figs 1 and 2).

NeuroQuant triage brain atrophy report provides volumetric percentiles of left and right regions of the brain.

NeuroQuant hippocampal atrophy report provides volumetric percentiles of the left and right regions of the hippocampus as well as the normative percentile of the hippocampus compared with the normative control group of patients.
After uploading de-identified 3D volumetric T1 images, we used the NeuroQuant hippocampal asymmetry report to classify all hippocampal volumes less than the 5th percentile (compared with the normative control group) as hippocampal atrophy (NeuroQuant HA+ group). To further ensure that we selected an adequate cutoff point, we also analyzed cutoff values of 7, 6, 4, 3, and 2, and found that the 5th percentile cutoff mark recommended by NeuroQuant analysis was the most sensitive and specific for hippocampal atrophy (Table 1). We further classified the hippocampal volumes based on the side of surgery as right or left, and used the surgical side to compare with pathology and visual analysis results.
Sensitivities, specificities, PPVs, and NPVs, with varying cutoff points of NeuroQuant analysis
Statistical Analysis
We used the first 30 cases to determine the a priori discordance rate (how many times the results from MR imaging and NeuroQuant analysis differed), and, by using an alpha of 0.05 to achieve a power of 0.80, we determined that we needed at least 60 study subjects with HS and 60 without HS. Our final study had 61 patients with HS and 83 patients without HS. A McNemar paired test of proportions was then used for sensitivity and specificity testing between NeuroQuant analysis and MR imaging (Table 2). Because the positive predictive value (PPV) and negative predictive value (NPV) in this study are specific to the Cleveland Clinic’s epilepsy population and the prevalence of HS in that population, we wanted to evaluate how the PPV and NPV would change with changes in HS prevalence so that our results could be applied in settings with a varying prevalence of HS. We used the Bayes theorem (Equations 1 and 2) to calculate PPV and NPV based on the prevalence, sensitivity, and specificity found in this study (Figs 1 and 2).
 1)
1)
 2)
2)
Results for NeuroQuant analysis vs visual MR imaging analysis in identifying HS by using histopathology as the reference standard for HS
RESULTS
Cohort Characteristics
To examine potential confounding variables, we analyzed sex, mean age at surgery, hippocampal volume, and side of surgery in the pathology HS+ and pathology HS– groups. There were no differences between these 2 groups, except for age at surgery with the pathology HS– group having a lower mean age (35.36 years) compared with the pathology HS+ group (40.4 years; P = .047), with otherwise comparable cohorts (Table 3).
Sample Demographics
NeuroQuant Analysis versus MR Imaging Visual Analysis Comparison
Next, we compared the sensitivity and specificity of NeuroQuant analysis with MR imaging visual analysis. By using a cutoff value of 5% for volume, NeuroQuant analysis correctly identified 42 of 61 positive cases of pathology HS+, whereas expert visual MR imaging analysis detected 57 of 61 cases of pathology HS+ (Table 2). NeuroQuant analysis correctly identified 75 of 83 cases of pathology HS–, whereas expert visual MR imaging analysis correctly identified 76 of 83 cases of pathology HS– (Table 2). The sensitivity of the NeuroQuant analysis in detecting HS was 68.8% compared with 93.4% for visual MR imaging analysis (P = .0007) (Table 4). The specificity of the NeuroQuant analysis was 90.4% compared with 91.6% for visual MR imaging analysis (P = 1) (Table 4).
Sensitivity and specificity values for NeuroQuant analysis and visual MR imaging analysis
By using different cutoff values of 7%, 6%, 4%, 3%, and 2%, we found that the NeuroQuant analysis had the highest sensitivity and specificity at the cutoff value of 5, which we selected for this study (Table 1). When using a cutoff of 7 or 6 (including some values that NeuroQuant analysis deems normal) for HS, we found that the sensitivity was higher than when using a narrower cutoff window of 4, 3, or 2 (Table 1). PPV, however, was low, at 50–52%, for all cutoff values, except for the cutoff value of 5, at which the PPV was 84.0% (Table 1). The NPV was roughly 60–62% at cutoff values of 7, 6, 4, 3, and 2, and was 79.8% at a cutoff value of 5.
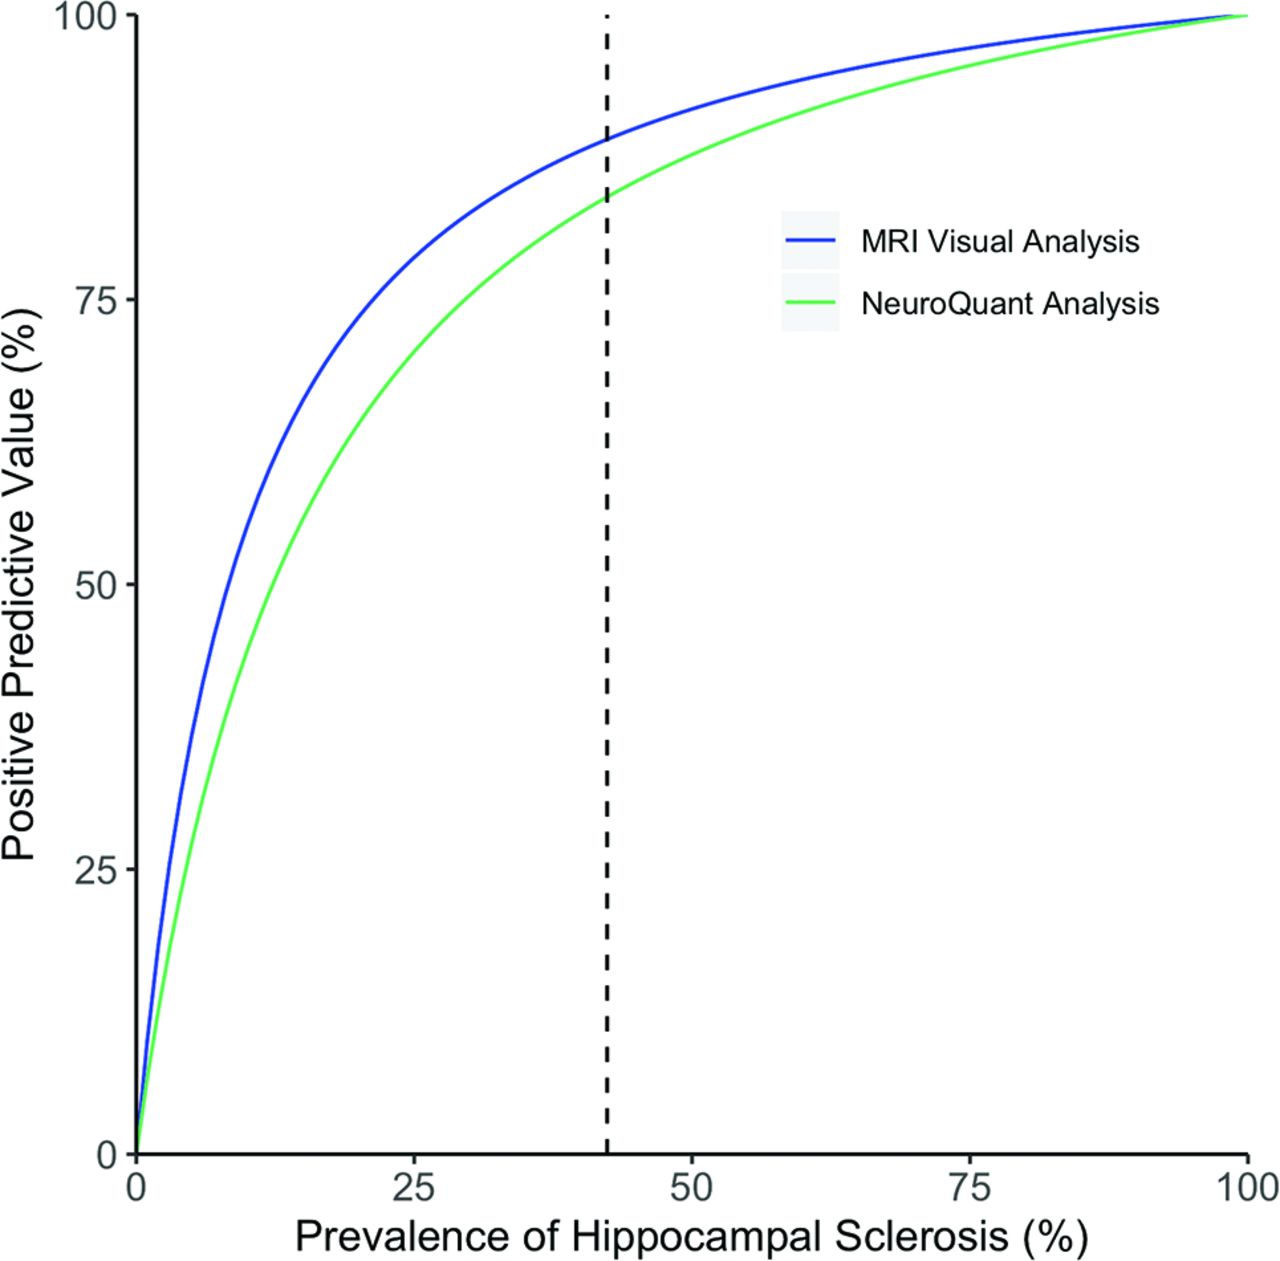
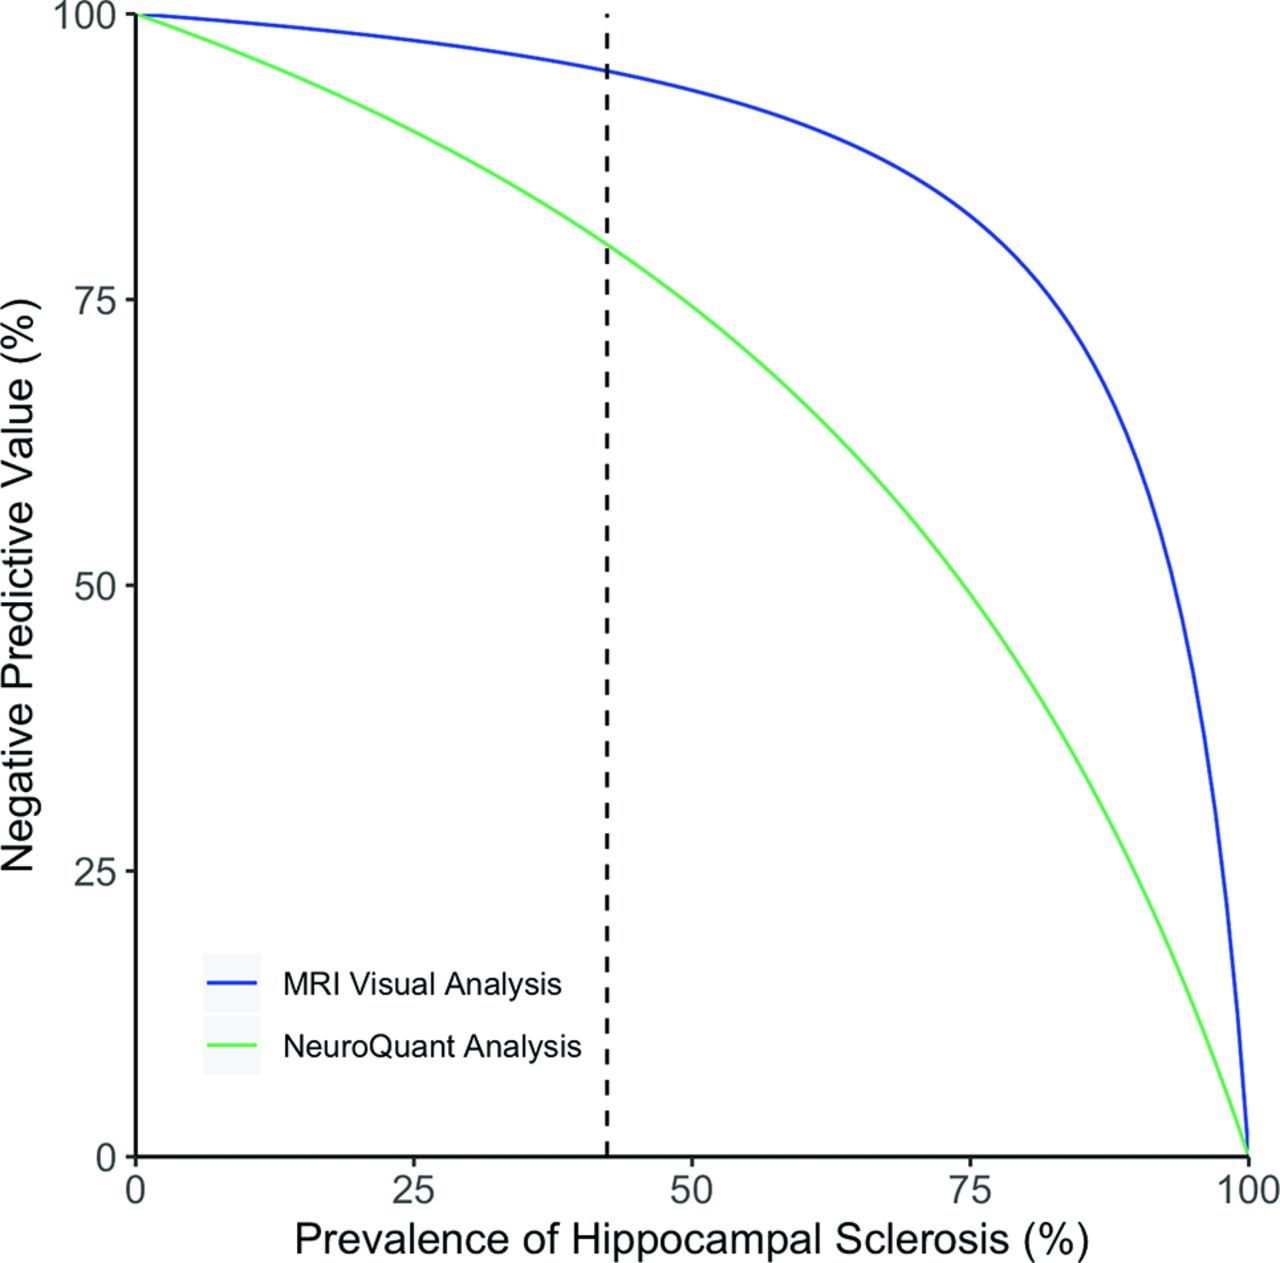
The PPV and NPV of the NeuroQuant analysis in this study were 84.0% and 79.8%, respectively, whereas the PPV and NPV of the visual MR imaging analysis were 89.1% and 95.0%, respectively (Figs 3 and 4). How the PPV changes for both MR imaging and NeuroQuant analysis as the prevalence of HS changes with an increase in PPV that occurs at a higher disease prevalence of HS is shown in Fig 3. How NPV changes for MR imaging and NeuroQuant analysis, with an increase in NPV as the prevalence of HS decreases is show in Fig 4. For both NPV and PPV, the MR imaging visual analysis had higher predictive probabilities than did NeuroQuant analysis overall.9

PPV of visual MR imaging analysis and NeuroQuant analysis results as the prevalence of HS increases. In our study, HS had a prevalence of 42.4% (black dotted line), NeuroQuant analysis had a PPV of 84%, and MR imaging had a PPV of 89.1%. With a decreased prevalence of HS, both MR imaging and NeuroQuant (NQ) have a decreased PPV, whereas an increased prevalence of HS results in a higher PPV for both analytic methods.

NPV of visual MR imaging analysis and NeuroQuant analysis results as the prevalence of HS increases. In our study, HS had a prevalence of 42.4% (black dotted line). In areas with a lower prevalence of HS than our institution, the NPV increases for both MR imaging and NeuroQuant.
DISCUSSION
Typically, HS is identified by MR imaging visual analysis based on 3 features: increased T2 signal, structural changes or loss of structure of the hippocampus, and decreased volume of the hippocampus itself.13 In this study, we sought to determine how the automated quantitative volumetric results reported by the NeuroQuant analysis compared with visual MR imaging analysis in detecting HS and found that NeuroQuant had a lower sensitivity compared with visual MR imaging analysis. Because NeuroQuant only evaluates volume changes in the hippocampus, in contrast to a neuroradiologist’s evaluation of T2 signal and structural changes, it makes sense that, overall, neuroradiologists had a higher sensitivity than did NeuroQuant analysis.
Furthermore, neuroradiologists had access to clinical information (eg, semiology and past MR images) to which NeuroQuant did not have access. As a result, there was some bias toward a neuroradiologist being able to identify a lesion on MR imaging and having a higher sensitivity compared with the volumetric software of NeuroQuant, which does not use clinical information. Clinically, due to the lower sensitivity of NeuroQuant analysis, if a NeuroQuant test came back negative, then follow-up work with a neuroradiologist’s assessment is recommended to truly rule out HS.
We acknowledge the possible selection bias due to the retrospective nature of this study and because all the patients in this study were surgical candidates. Another possible limitation was that current MR imaging sequence protocols, including other contrasts such as double inversion recovery, may improve on the sensitivity and specificity of visual analyses for the detection of HS compared with the protocol used in this study. However, even if contemporary protocols could improve the sensitivity and specificity for visual analysis in the detection of HS (which were already high, at 93.4% and 91.6% in this study), it would not change the performance of NeuroQuant because high-resolution T1-weighted volumetric sequences as used in this study are still the reference standard for volumetric measurements.
Another potential limitation was that we excluded secondary causes of mesial temporal sclerosis, for example, temporal lobe tumors, that encroached on the hippocampal area; therefore, the generalizability of dual pathology needs to be further evaluated because the results of this study could not be applied to patients with hippocampal tumors. Similarly, patients with a previous stroke, trauma, or surgery would likely not benefit from a NeuroQuant analysis due to morphologic variation that NeuroQuant is likely not equipped to account for at this time.
Furthermore, it is not possible to make direct comparisons with our study and that of Von Oertzen et al.1 This is because Von Oertzen et al1 primarily analyzed the results of standard MRIs reported by “nonexpert” radiologists, standard MRIs evaluated by epilepsy “expert” radiologists, and then epilepsy-specific MR imaging protocols read by “expert” radiologists in 123 patients with temporal and extratemporal lobe epilepsies with varying types of underlying lesions. In addition, because Von Oertzen et al1 evaluated 1.5T MRIs acquired between 1996 and 1999, the resolution in our study was superior because MRIs were acquired in a 3T scanner between 2010 and 2017.
The specificity between NeuroQuant analysis and visual MR imaging analysis was not statistically different (P = 1). Given the high specificity of both NeuroQuant analysis and visual MR imaging analysis by a neuroradiologist, along with NeuroQuant’s PPV of 84% (compared with the visual MR imaging analysis PPV of 89.1%), if a NeuroQuant test came back positive, then the treating neurologist could be confident that HS is very likely the potential epileptic substrate and may consider referral for an epilepsy surgery evaluation if clinically indicated: the PPV and specificity of the NeuroQuant report is comparable with that of a neuroradiologist’s assessment.
This would especially be of use in centers with limited resources and that do not have neuroradiologists with expertise in epilepsy. These centers could use NeuroQuant to help decide when a further work-up and referral to a center with a trained radiologist is essential (negative NeuroQuant assessment for HS) versus when a patient can be referred for surgery (positive result on NeuroQuant analysis for probable HS). Even in tertiary centers where specialized neuroradiology resources are available, NeuroQuant could help streamline workflows and optimize resource utilization, even if it may not be able to capture all true cases of HS due to its low sensitivity.
Other studies looked into quantifying structural changes of the hippocampus and changes in the T2 signal as a means of capturing HS on MR imaging. However, these tools are not FDA-approved; NeuroQuant is.15,16 It is hoped that, in the future, these tools will be more readily available to better supplement the detection capability of NeuroQuant.
Given that many complex epilepsy cases with refractory epilepsy are often referred to the Cleveland Clinic, we may have an overinflated population of medically refractory HS (a prevalence of 42.4% in this study). We are aware that the PPV and NPV for visual MR imaging analysis and NeuroQuant analysis in this study are specific to the Cleveland Clinic’s population of patients with temporal lobe epilepsy (particularly those with medically intractable epilepsy) and that the predictive power of NeuroQuant may change with a varying prevalence of HS. To account for ranges in HS prevalence based on different institutions across the United States and their prevalence of pharmacoresistant temporal lobe epilepsies, we plotted how the PPV and NPV would change with a lower and higher prevalence of HS in Figs 3 and 4, respectively.
The PPV of MR imaging and NeuroQuant analysis decreased with a lower prevalence of HS; however, overall, the PPV of MR imaging and NeuroQuant analysis were similar, with the largest difference in PPV being 10.9% at a prevalence of 11% for HS. This suggests that, even if the prevalence of HS at other institutions is slightly under our prevalence of 42.4%, the PPVs of MR imaging and NeuroQuant analysis are comparable enough that a positive result on NeuroQuant analysis could potentially hold the same value as a positive MR imaging radiologist assessment in referring a patient for surgery without needing to refer the patient to other centers. However, at any prevalence of HS, MR imaging had an overall higher NPV, which suggests a negative test on NeuroQuant should always be followed up with a neuroradiologist’s assessment to ensure that any true HS cases are not missed (Fig 3).
Because NeuroQuant works by uploading a patient’s T1 MR imaging volumetric sequence, it is a quick and easy test to run because most of these patients will already have MR imaging as part of their presurgical evaluation. As a result, a positive NeuroQuant result could be a very useful tool in helping neurologists better define and recommend patients with temporal lobe epilepsy for surgical resection.
CONCLUSIONS
Overall, MR imaging analysis by a neuroradiologist with expertise in epilepsy has both a higher sensitivity and specificity than NeuroQuant analysis, which makes it an overall better assessment tool for HS. However, there is a potential clinical role for NeuroQuant in lower resource centers that do not have access to epilepsy-trained radiologists to use NeuroQuant to assess drops in hippocampal volume status to consider referring patients with positive NeuroQuant test results for surgery, while pursuing follow-up and trained neuroradiologist consults for patients with negative NeuroQuant test results.
Footnotes
This research was supported by National Institute of Neurological Disorders and Stroke of the National Institutes of Health under award number 1R01NS097719-01A1.
Disclosures: Marcia Morita-Sherman—RELATED: Grant: National Institutes of Health (NIH), Comments: NIH grant 1R01NS097719-01A1*; UNRELATED: Employment: Cleveland Clinic, Comments: Cleveland Clinic pays me as a research fellow; Grants/Grants Pending: NIH, Comments: NIH grant 1R01NS097719-01A1*. Stephen Jones—RELATED: Grant: NIH*; Support for Travel to Meetings for the Study or Other Purposes: NIH, Comments: Travel is part of the NIH grant*; UNRELATED: Consultancy: Monteris International; Expert testimony: Law firm in South Carolina*; Grants/Grants Pending: NIH, Biogen, St Jude, DoD; Payment for Lectures including Service on Speakers Bureaus*: St Jude Hospital; Royalties: Book; Payment for Development of Educational Presentations: Cleveland Clinic Educational Material; Travel/Accommodations/Meeting Expenses Unrelated to Activities Listed: Siemens Ultra High Field meeting, Comments: Covered travel expenses.* Deborah Vegh—RELATED: Grant: Cleveland Clinic, Comments: NIH funded grant activity where I serve as research coordinator and am salaried via the grant*; Support for Travel to Meetings for the Study or Other Purposes: Cleveland Clinic.* Nancy Obuchowski—UNRELATED: Consultancy: IBM, Siemens, QIBA, Comments: Dr Obuchowski provides statistical consulting through a contract with her institution.* Fernando Cendes—RELATED: Grant: São Paulo Research Foundation (FAPESP), Grant 2013/07559-3*; UNRELATED: Consultancy: UCB Pharma; Employment: Universidade Estadual de Campinas-UNICAMP, Brazil; Grants/Grants Pending: CNPq-Conselho Nacional de Desenvolvimento Científico e Tecnológico, Brazil; Payment for Lectures, Including Service on Speakers Bureaus: UCB Pharma. Lara Jehi—RELATED: Grant: NINDS*; UNRELATED: Grants/Grants Pending: Eisai Inc.* *Money paid to institution.
Indicates open access to non-subscribers at www.ajnr.org
References
- Received November 7, 2019.
- Accepted after revision January 17, 2020.
- © 2020 by American Journal of Neuroradiology


Jump to section
Related Articles
Cited By...
- Radiologic Classification of Hippocampal Sclerosis in Epilepsy
- Convolutional Neural Network Algorithm to Determine Lateralization of Seizure Onset in Patients With Epilepsy: A Proof-of-Principle Study
- Trends in Clinical Validation and Usage of Food and Drug Administration (FDA)-Cleared Artificial Intelligence (AI) Algorithms for Medical Imaging