
Abstract
BACKGROUND AND PURPOSE: During thyroidectomy incomplete resection of the thyroid gland may occur. This complicates the imaging surveillance of these patients as residual thyroid needs to be distinguished from local recurrence. Therefore, the purpose of this study was to determine if multiphasic multi-detector computed tomography (4D-MDCT) can differentiate residual nonmalignant thyroid tissue and recurrent thyroid carcinoma after thyroidectomy.
MATERIALS AND METHODS: In this retrospective study, Hounsfield unit values on multiphasic multidetector CT in precontrast, arterial (25 seconds), venous (55 seconds), and delayed (85 seconds) phases were compared in 29 lesions of recurrent thyroid cancer, 29 with normal thyroid, and 29 with diseased thyroid (thyroiditis/multinodular thyroid). The comparison of Hounsfield unit values among lesion types by phase was performed using ANOVA. The performance of Hounsfield unit values to predict recurrence was evaluated by logistic regression and receiver operating characteristic analysis.
RESULTS: All 3 tissue types had near-parallel enhancement characteristics, with a wash-in–washout pattern. Statistically different Hounsfield unit density was noted between the recurrence (lowest Hounsfield unit), diseased (intermediate Hounsfield unit), and normal (highest Hounsfield unit) thyroid groups throughout all 4 phases (P < .001 for each group and in each phase). Dichotomized recurrence-versus-diseased/normal thyroid tissue with univariate logistic regression analysis demonstrated that the area under the receiver operating characteristic curve for differentiating benign from malignant thyroid for the various phases of enhancement was greatest in the precontrast phase at 0.983 (95% CI, 0.954–1), with a cutoff value of ≤62 (sensitivity/specificity, 0.966/0.983) followed by the arterial phase.
CONCLUSIONS: Recurrent thyroid carcinoma can be distinguished from residual nonmalignant thyroid tissue using multiphasic multidetector CT with high accuracy. The maximum information for discrimination is in the precontrast images, then the arterial phase. An optimal clinical protocol could be built from any number of phases but should include a precontrast phase.
ABBREVIATIONS:
- 4D-MDCT
- multiphasic multidetector CT
- ROC
- receiver operating characteristic
In the United States, between 1975 and 2013, the incidence of thyroid cancer increased by 211% and the average annual increases in incidence and mortality rates were 3.6% and 1.1%, respectively.1 Papillary thyroid carcinoma, the least aggressive type of thyroid cancer, accounts for most new cases.2 In patients with thyroid cancer, thyroid surgery is the mainstay of treatment.3,4
After the operation, approximately 20%–30% of patients experience local recurrence of soft-tissue or nodal metastases.5 Routine follow-up imaging to detect early recurrence includes CT and sonography to assess structural recurrence and thyroid-stimulating hormone and thyroglobulin levels for biochemical assessment.6
During thyroidectomy, an area of difficulty for surgeons is the Berry ligament, which tethers the thyroid to the trachea, because the recurrent laryngeal nerve is generally intimately associated with this ligament.7 In inexperienced hands, incomplete resection of the thyroid at the Berry ligament may occur as a result of the surgeon’s attempt to avoid damaging this nerve.8 D’Andrea et al9 studied the rate of residual thyroid tissue after total thyroidectomy and found that 34 of 102 patients (33.3%) had “significant thyroid tissue remnants” in the thyroid bed.
The problem this creates in the imaging follow-up of these patients is that residual tissue needs to be correctly characterized as either benign or malignant. Accurate delineation of thyroid bed tissue as residual thyroid may avoid an unnecessary operation with complications including damage to the recurrent laryngeal nerve as well as the inherent risks of anesthesia. On the other hand, treatment of recurrent disease is necessary to avoid unfavorable outcomes including locoregional complications such as invasion of the trachea and esophagus and to avoid distant metastases.10
Differentiation between these 2 entities is not always straightforward.7 An additional diagnostic challenge is superimposed if there is background benign thyroid disease in the residual thyroid tissue, such as thyroiditis or a multinodular goiter.11 To the best of our knowledge, no prior studies have addressed this issue using CT.
In this study, we address this gap in imaging knowledge and determine whether multiphasic multidetector CT (4D-MDCT) can be used to characterize residual thyroid tissue after an operation as either benign or malignant. 4D-MDCT involves high-resolution helical CT before and during the administration of a bolus of iodinated contrast at specific points in time to allow the changing distribution of contrast to be assessed. 4D-MDCT is in common clinical use for the localization of parathyroid adenomas, which show characteristic contrast handling attributes that allow accurate localization.12-17
We hypothesized that 4D-MDCT can be used similarly to differentiate recurrent thyroid carcinoma from residual normal and diseased thyroid tissue. We also hypothesized that recurrent tumor and normal and diseased thyroid would have diagnostic patterns of contrast enhancement that allow them to be clearly discriminated.
MATERIALS AND METHODS
Our institutional review board approved this study and waived the requirement for informed consent. Data were acquired in compliance with all applicable Health Insurance Portability and Accountability Act regulations.
Study Population
We reviewed the medical records of 152 consecutive patients who underwent 4D-MDCT of the thyroid beds for localization of suspected recurrent thyroid carcinoma following total thyroidectomy. In these patients, recurrent lesions were suspected due to an elevated thyroglobulin level, surveillance CT findings, surveillance ultrasound findings, and/or the results of an ultrasound-guided fine-needle aspiration. For inclusion in this group (group 1), patients were required to have pathologically proved disease by either fine-needle aspiration or subsequent surgical resection. The 4D-MDCT studies in group 1 were performed between 48 days and 14 years 9 months (mean, 4 years 3 months) after thyroidectomy.
Seventy-five separate patients underwent 4D-MDCT for localization of a parathyroid adenoma. From these patients, we identified 2 groups of patients: patients with a normal thyroid, defined as a homogeneously enhancing thyroid gland on 4D-MDCT (group 2); and patients with a diseased-but-nonmalignant thyroid, defined as a thyroiditis with increased vascular flow or benign multinodular goiter on sonography or pathology, and a heterogeneously enhancing thyroid gland on 4D-MDCT (group 3). For inclusion in the study, patients with a normal or diseased thyroid had to have no evidence of a primary cancer either at the time of the 4D-MDCT study or previously.
The medical records were searched until equal numbers of recurrent lesions (group 1) and both normal thyroid (group 2) and diseased thyroid (group 3) cases in each group were identified. The review was completed when there were an equal number of cases in each of the 3 study groups.
Image Acquisition
The 4D-MDCT examinations were performed on a multidetector CT LightSpeed scanner (GE Healthcare) with the following parameters: 140 kV, 220–250 mA, and a 1.25-mm section thickness covering the neck from the bottom of the orbits to the arch of the aorta. We acquired 4 phases: an initial noncontrast helix and then 3 additional helixes acquired after intravenous contrast agent injection in the arterial phase (25 seconds after the start of the contrast injection), venous phase (55 seconds after injection), and delayed phase (85 seconds after injection).
ROI Analysis
CT images were transferred to an ADW-2 workstation (GE Healthcare) with Volume Share 2, Version 4.4, software. A head and neck radiologist (J.M.D.) with >15 years of experience in head and neck radiology who was not blinded to the tissue type results drew ROIs around the recurrent lesions and areas of normal and diseased thyroid using freehand contouring. In the freehand contouring technique (Fig 1), the ROI was contoured to the visual outline of the lesion or the thyroid gland through the different phases of enhancement, with no requirement for the ROI size to remain constant. The outline from the largest area of enhancement representing the entire lesion was copied onto a similar site on the precontrast phase image. An attempt was made to place the contour 1 mm from the edge of the lesion to minimize the effects of partial volume averaging. Any visible surgical clips or calcifications associated with the lesions were excluded.
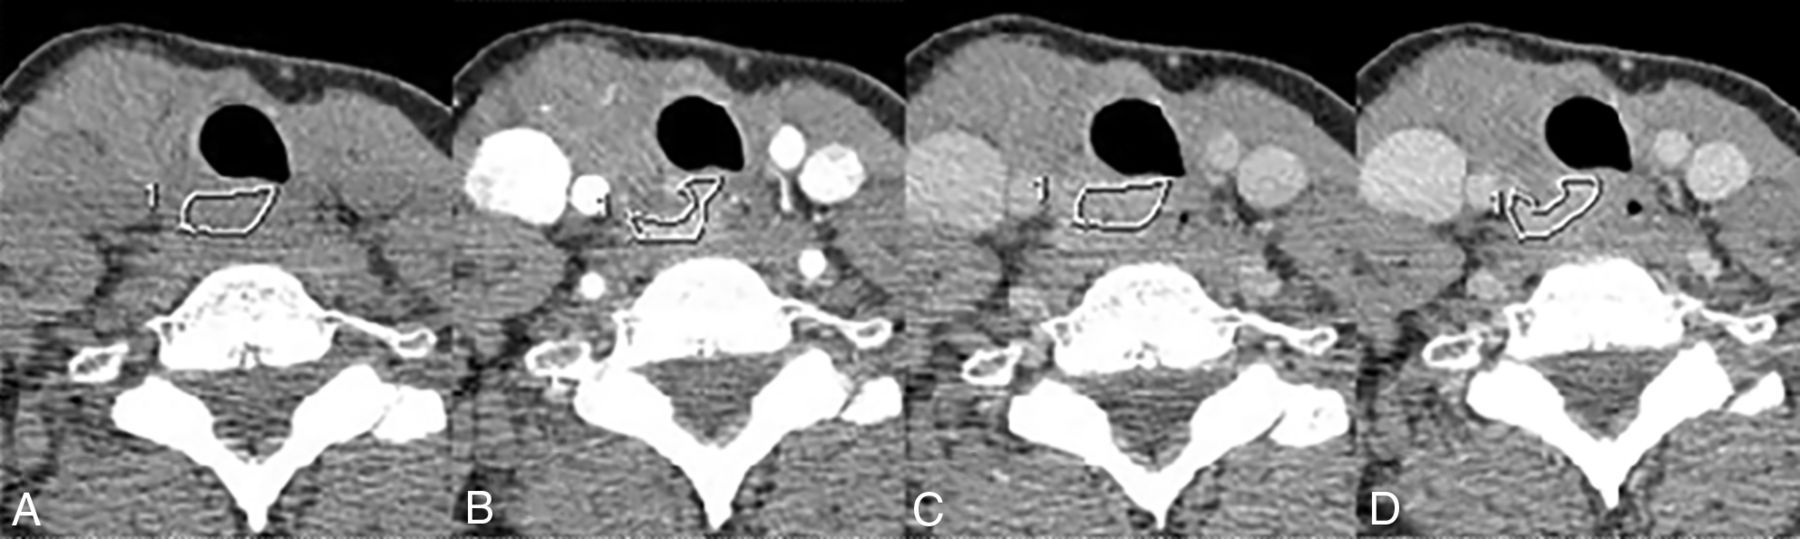
Freehand contouring method of drawing the ROI. In the freehand contouring method, the borders of the lesion were traced on images in the arterial (B), venous (C), and delayed (D) phases of enhancement, with no requirement for the ROI size to remain constant. The largest area, the venous phase in this example, was then copied onto the (A) precontrast phase, where the lesion contrast with background was typically worse.
Mean, SD, and minimum-maximum of the grouped data were calculated to compare recurrence, normal thyroid, and diseased thyroid Hounsfield unit values through the 4 phases of enhancement. First, ANOVA was used to compare Hounsfield unit values among 3 tissue types. Tukey-Kramer adjustment was used to control the overall type I error rate at 5%. A 2-sample t test was used to compare Hounsfield unit values of dichotomized cases of recurrence versus benign thyroid (normal and diseased combined). Second, a univariate logistic regression model was used to associate Hounsfield units with tissue status (recurrence versus benign thyroid). As a high correlation among the different phases was determined, a multivariate model was reduced to a univariate model by the backward deletion. Third, the performance of Hounsfield units to discriminate recurrence from benign thyroid tissue using both the results of the univariate and bivariate analyses was evaluated using receiver operating characteristic (ROC) curve analysis. ROC analysis was used to determine the optimal cutoff point by maximizing the Youden index, sensitivity + specificity–1. Next, ROC curve analysis of Hounsfield units to discriminate recurrence from benign thyroid tissue was performed using univariate and multivariate analyses with 2, 3, or 4 combinations of the various 4 phases (precontrast, arterial, venous, and delayed).
Similar overall root mean square error values were then calculated for each phase. Matrix scatterplots with Pearson correlation were used to compare the Hounsfield unit density through the 4 phases. All tests were 2-sided, and P ≤ .05 was considered statistically significant. Statistical analysis was performed using SAS, Version 9.4 (SAS Institute) and R statistical and computing software, Version 3.5.3 (http://www.r-project.org/).
RESULTS
Study Population
Twenty-nine recurrent thyroid cancer lesions (group 1) were identified in 24 patients (16 women, 8 men; 21–80 years of age; mean, 52.5 ± 15.8 years); 5 patients each had 2 separate lesions. The types of primary thyroid cancer were as follows: papillary thyroid carcinoma (n = 21), follicular variant papillary thyroid carcinoma, (n = 3), medullary thyroid carcinoma (n = 3), and Hurthle cell carcinoma (n = 2). Sixteen of 24 patients (19 lesions) received radioactive iodine following thyroidectomy. The lesions ranged in size from 0.7 to 2.4 cm (mean, 1.2 ± 0.4 cm) and were diagnosed by surgical resection (n = 28) or fine-needle aspiration (n = 1). Twenty-nine patients with normal thyroid (group 2) (25 women, 4 men; 34–85 years of age; mean, 63 ± 13.2 years) and 29 patients with diseased thyroid (group 3) (18 multinodular goiters, 11 cases of thyroiditis) (23 women, 6 men; 45–86 years of age; mean, 63.5 ± 10.9 years) were also included.
Discrimination among Normal, Diseased, and Recurrent Thyroid
Hounsfield unit densities for recurrent, normal, and diseased thyroids were compared precontrast and at 25 (arterial), 55 (venous), and 85 (delayed) seconds. ANOVA analysis showed that recurrent disease demonstrated significantly lower Hounsfield unit values in all 4 phases compared with diseased thyroid (P < .001). Diseased thyroid also had a significantly lower values than normal thyroid (Table 1). Combined benign thyroid (normal and diseased thyroid) was also significantly different from recurrence (P < .001) in all 4 phases using a 2-sample t test (Table 2). A line graph with error bars was drawn to show this evolution of Hounsfield unit density with time for the recurrent disease and benign thyroid groups (Fig 2).
Summary of Hounsfield units by phase and lesion type using 3 categories—normal, diseased, and recurrent
Summary of Hounsfield units by phase and lesion type using 2 categories—recurrence and benign (includes both normal and diseased thyroid)

Line graphs with error bars show the evolution of Hounsfield unit density across time for the recurrent disease (blue solid lines) and benign thyroid (red dashed lines) groups through the 4 phases. The peak Hounsfield unit density for both groups occurred in the arterial phase followed by washout of contrast.
Statistical Analysis
On univariate logistic regression analysis of benign thyroid versus recurrence, the odds ratios for differentiating the various phases were as follows: precontrast odds ratio, 0.856 (95% CI, 0.767–09.11); arterial OR, 0.92 (95% CI, 0.867–0.952); venous OR, 0.928 (95% CI, 0.892–954); and delayed OR, 0.916 (95% CI, 0.874–0946). Statistically significant differences were noted in each phase (P < .001) (Table 3). ROC curve analysis of Hounsfield units to discriminate recurrence from benign thyroid showed that the area under the ROC curve was slightly greater in the precontrast phase (0.983) than in the arterial (0.979), venous (0.965), and delayed phases (0.957) (Fig 3). The area under the curve, 95% confidence intervals, optimal Hounsfield unit cutoff, sensitivity, and specificity are provided in Table 4. Similar ROC curve analysis of Hounsfield units using univariate and multivariate analyses with combinations of 2, 3, or 4 of the 4 phases (precontrast, arterial, venous, and delayed) (Table 5) showed that the area under the ROC curve was slightly greater compared with the precontrast phase alone. However, compared with the precontrast phase, none of these combinations were statistically significant (P > .05) (Table 5).
Summary of univariate logistic regression model using Hounsfield units to predict lesion status (benign thyroid and recurrence)
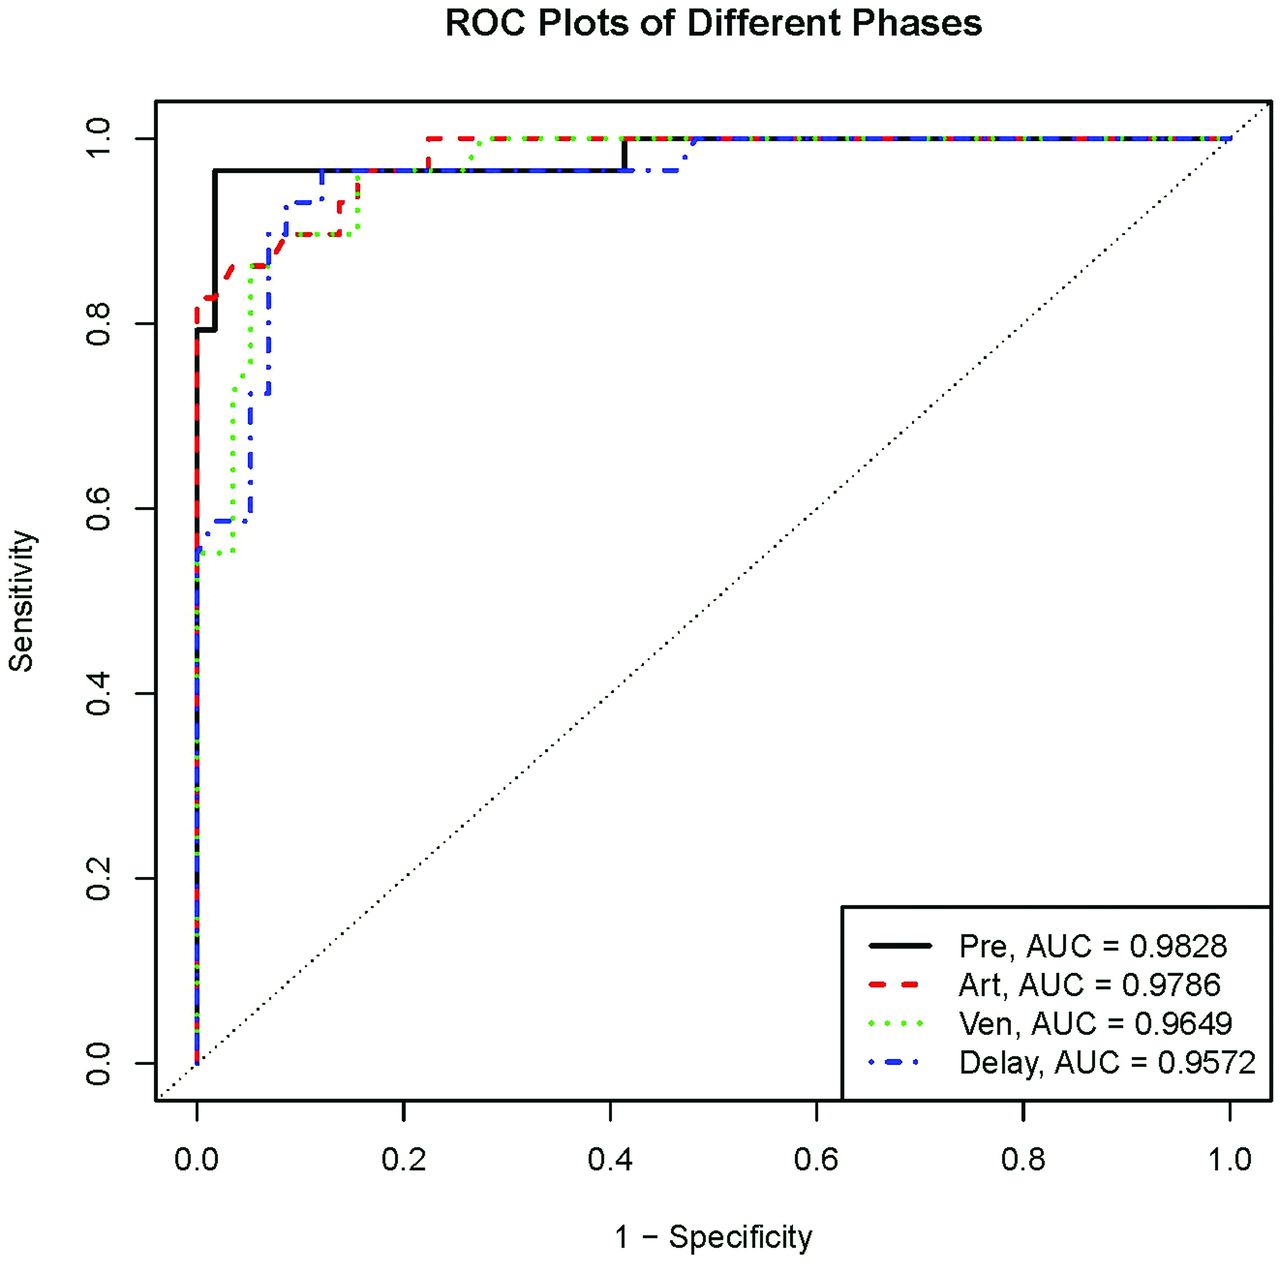
ROC plots comparing recurrent and benign thyroid through 4 phases. The greatest area under the curve was in the precontrast (Pre) phase followed by the arterial (Art), venous (Ven), and delayed (Delay) phases.
Area under ROC curve (univariate analysis)
Area under ROC curve for multivariate analysis with P values compared with precontrast phase alone
The optimal cutoff point to differentiate benign thyroid from recurrence in each of the 4 phases by ROC analysis was as follows: precontrast, ≤62 HU; arterial phase, ≤129 HU; venous phase, ≤120.6 HU; and delayed phase, ≤125 HU (Fig 4). Overall root mean square error values were as follows: precontrast, 34.8; arterial, 29.5; venous, 26.4; and delayed, 26.

Logistic regression analysis determined the optimal cutoff Hounsfield unit value in each of the 4 phases. The least overlap was present in the precontrast phase with a value of ≤62 HU.
To validate these findings, we made an effort to combine the phases into an indicator with better performance, but matrix scatterplots revealed 2 outlier cases that were misclassified regardless of phase, indicating that a combination of phases could not be used to improve performance (though there might be clinical reasons to include >1 phase).
DISCUSSION
Our results demonstrate that 4D-MDCT can be used to distinguish recurrent thyroid carcinoma from benign thyroid tissue, including both normal and diseased nonmalignant thyroids. In all 4 phases, the Hounsfield unit value was significantly lower for recurrent thyroid carcinoma than for benign tissue, with diseased thyroid intermediate between recurrent and normal thyroid. The mean time-enhancement curves ran parallel and did not cross in any phase. Based on the ROC curve analysis, the best single phase to distinguish recurrent disease from benign thyroid tissue, both normal and diseased, was the precontrast phase with a cutoff value of ≥62 HU, yielding a sensitivitiy of 0.966 and specifity of 0.983. Arterial, venous, and delayed phases each followed with cutoff values of 129, 120.6, and 125, respectively, with sensitivity/specificities of 0.828/1, 0.897/0.931, and 0.966/0.879, respectively. Each individual phase, in other words, yields quite acceptable performance, but the precontrast phase, according to our data, contains the most diagnostic information for this application. The ROC curve analysis of univariate and multivariate data showed that the area under the curve could be slightly improved from 0.983 (precontrast phase alone) in various phase combinations of 2, 3, and 4 phases, but none of these were statistically significant (P > .05) in comparison with the precontrast phase alone.
On precontrast MDCT, both normal and diseased thyroid had a higher Hounsfield unit density compared with recurrence. This is attributed, at least in part, to the iodine content of normal thyroid tissue and the inclusion of this thyroid tissue in the ROI measurements of the diseased thyroid. Histologically, the thyroid gland is composed of epithelial cells surrounding follicles. Thyroid hormones produced from thyroglobulin and iodide are stored within colloid and account for 25% of the iodide of the body. Because colloid volume is about 3 times greater than the epithelial cell volume,18 the high electron density of the iodine colloid leads the high attenuation of the thyroid on MDCT.19-21 Our results are confirmed in a report by Han et al,22 who studied the appearance of the thyroid gland using PET/CT. They found that thyroid density is proportional to colloid volume and inversely proportional to the cellular component of the thyroid and FDG avidity. A study by Hunter et al17 compared the 4D-CT enhancement pattern of normal thyroid tissues with parathyroid adenomas on multiphasic multidetector CT. They noted that the higher density of the thyroid gland in the “precontrast phase [as this phase] allows distinction between the iodine-rich thyroid and the surrounding tissue.”
Fitzgerald et al23 studied the 4D-MDCT patterns of benign and malignant thyroid nodules. Their results in the precontrast phase were similar to ours because the precontrast attenuation of malignant nodules was significantly lower than that of benign lesions (36 versus 61 HU, P = .05). In addition to the inclusion of normal hyperdense thyroid tissue in our study, the innate higher density of benign nodules compared with malignant nodules described by Fitzgerald et al may also contribute to our findings of the higher density of benign and diseased thyroid compared with recurrent disease.
Lee et al24 studied the significance of incidental thyroid nodules detected on non-contrast-enhanced low-dose CT for lung cancer screening and found that a “mean attenuation value of 55 HU or more (P = .036) and the presence of dense calcifications (P = .048)” were associated with malignancy. In our study, recurrent disease had a mean of 37 HU in the precontrast phase. The divergence between their findings and ours is likely related to the inclusion of calcification in the study of Lee et al, which was specifically excluded in our study.
In the arterial phase, we found an increase in Hounsfield unit values within normal thyroid tissue, diseased thyroid, and recurrence. Similarly, the study by Hunter et al17 found that the peak enhancement of normal thyroid tissue in the arterial phase (25 seconds) was approximately 50 HU over baseline and parathyroid adenomas increased approximately 100 HU from baseline. Ours and the study of Hunter et al also found the greatest separation between thyroid tissue and recurrence, and adenomas and thyroid tissue in the arterial phase, respectively. Fitzgerald et al23 found no significant difference in HU values between the benign (128 HU) and malignant nodules (144 HU) in the arterial phase (P = .7). Differences between their study and ours are likely related to the inclusion of normal thyroid tissue in the diseased thyroid group in our study, which would not be present in the thyroid nodules studied by Fitzgerald et al.23
In our study, there was washout of contrast in the delayed and late phases in all 3 studied groups. Similarly, Hunter et al17 found washout of enhancement of thyroid tissue and parathyroid adenomas in the delayed (55 seconds) and late (100 seconds) phases. Fitzgerald et al23 found no significant difference in Hounsfield unit values between the benign (74 HU) and malignant nodules (98 HU) in the delayed phase (P = .3). Again, this difference is likely related to the inclusion of hyperdense thyroid tissue in the normal and diseased thyroid group in our study.
Yoon et al25 examined 734 patients with incidental thyroid nodules, 9% of which were malignant. They found that nodular or rim calcifications and Hounsfield unit values of >130 HU on postcontrast CT with a 45-second delay were suggestive of malignancy. On venous phase imaging (55 seconds), we found mean Hounsfield unit values of 91 HU for recurrent thyroid carcinoma. We speculate that the differences in results between our study and that of Yoon et al25 may also be related to the presence of calcifications in the incidentally detected thyroid carcinomas described in their study.
Limitations include the retrospective nature of the study and the relatively small number of patients (29 in each category). Another limitation is that the lesions in our study may have been detected earlier in their development, given that the patients in our study were being screened for recurrence. During a longer time course, recurrence and residual tissue may have a different appearance. However, the current study design is useful in the early follow-up period when such information is most useful clinically and could be used to decide on questions such as re-operation. Another limitation is that patients with a multinodular thyroid as part of the diseased thyroid group could conceivably have had an undetected indolent thyroid cancer. In addition, the use of radioactive iodine for the treatment of thyroid cancer might alter the imaging appearance of benign thyroid tissue from what we observed. After radioactive ablation therapy, residual thyroid tissue undergoes fibrosis and appears sonographically as an avascular heterogeneously hypoechoic mass.26,27 Caution should be used when extrapolating work done in the thyroid gland that has been treated with radioactive iodine to our current findings in the postthyroidectomy population. Further investigation is needed in this area.
Approximately 27 mSv of radiation is administered during a 4D-MDCT examination, with a roughly equal contribution from each phase. Because approximately 3 mSv is the estimated yearly natural background radiation exposure, the 4D-MDCT dose in our study is equivalent to the dose received naturally in 9 years.28 The dose for a CT study could potentially be cut to about 6.75 mSv if only 1 phase is acquired (but see next paragraph).
CONCLUSIONS
Our data suggest that the precontrast imaging for characterizing residual tissue after thyroidectomy actually contains the most valuable information and should certainly be a component of any imaging protocol performed for this purpose. The choice of which phase or phases to include is informed but not dictated by our work. Clinical needs might demand that contrast-enhanced sequences be a part of the imaging protocol (for example to demonstrate lymph nodes and vascular anatomy). Individual radiologists and practices can use the data found in this study to optimally select those imaging phases needed in their practice and balance the need for clinical information against radiation burden, as their patients’ needs might require. Prospective clinical imaging trials using these cutoff values are justified.
Footnotes
The University of Texas MD Anderson Cancer Center is supported, in part, by the National Institutes of Health through Cancer Center Support Grant CA016672.
Disclosures: Mark E. Zafereo—UNRELATED: Grants/Grants Pending: Merck, Eli Lilly, GenePro, Comments: research funding for clinical trials.* Maria E. Cabanillas—UNRELATED: Consultancy: Blueprint Medicines, Ignyta, Bayer Onyx, Loxo Oncology; Grants/Grants Pending: Eisai, Exelixis, Genentech, Kura Oncology; Payment for Lectures Including Service on Speakers Bureaus: various Continuing Medical Education lectures with multiple sponsors; Travel/Accommodations/Meeting Expenses Unrelated to Activities Listed: various Continuing Medical Education lectures. *Money paid to the institution.
Indicates open access to non-subscribers at www.ajnr.org
References
- Received October 8, 2019.
- Accepted after revision February 24, 2020.
- © 2020 by American Journal of Neuroradiology


Jump to section
Related Articles
Cited By...
- No citing articles found.