
Abstract
BACKGROUND AND PURPOSE: Studies associate repeat gadolinium-based contrast agent administration with T1 shortening in the dentate nucleus and globus pallidus, indicating CNS gadolinium deposition, most strongly with linear agents but also reportedly with macrocyclics. Renal impairment effects on long-term CNS gadolinium deposition remain underexplored. We investigated the relationship between signal intensity changes and renal function in patients who received ≥10 administrations of the macrocyclic agent gadobutrol.
MATERIALS AND METHODS: Patients who underwent ≥10 brain MR imaging examinations with administration of intravenous gadobutrol between February 1, 2014, and January 1, 2018, were included in this retrospective study. Dentate nucleus-to-pons and globus pallidus-to-thalamus signal intensity ratios were calculated, and correlations were calculated between the estimated glomerular filtration rate (minimum and mean) and the percentage change in signal intensity ratios from the first to last scan. Partial correlations were calculated to control for potential confounders.
RESULTS: One hundred thirty-one patients (73 women; mean age at last scan, 55.9 years) showed a mean percentage change of the dentate nucleus-to-pons of 0.31%, a mean percentage change of the globus pallidus-to-thalamus of 0.15%, a mean minimum estimated glomerular filtration rate of 69.65 (range, 10.16–132.26), and a mean average estimated glomerular filtration rate at 89.48 (range, 38.24–145.93). No significant association was found between the estimated glomerular filtration rate and percentage change of the dentate nucleus-to-pons (minimum estimated glomerular filtration rate, r = –0.09, P = .28; average estimated glomerular filtration rate, r = –0.09, P = .30,) or percentage change of the globus pallidus-to-thalamus (r = 0.07, P = .43; r = 0.07, P = .40). When we controlled for age, sex, number of scans, and total dose, there were no significant associations between the estimated glomerular filtration rate and the percentage change of the dentate nucleus-to-pons (r = 0.16, P = .07; r = 0.15, P = .08) or percentage change of the globus pallidus-to-thalamus (r = –0.14, P = .12; r = –0.15, P = .09).
CONCLUSIONS: In patients receiving an average of 12 intravenous gadobutrol administrations, no correlation was found between renal function and signal intensity ratio changes, even in those with mild or moderate renal impairment.
ABBREVIATIONS:
- DN/P
- dentate nucleus-to-pons
- eGFR
- estimated glomerular filtration rate
- GBCA
- gadolinium-based contrast agent
- GP/T
- globus pallidus-to-thalamus
- SI
- signal intensity
Gadolinium-based contrast agents (GBCAs) are commonly used in imaging to increase conspicuity and reveal enhancement characteristics of lesions. GBCAs can have either a macrocyclic or a linear molecular structure. Recent studies investigating CNS gadolinium deposition following repeat GBCA administrations showed measurable T1 shortening in the dentate nucleus and globus pallidus in patients who received GBCAs with a linear molecular structure.1⇓⇓⇓⇓⇓⇓⇓⇓⇓⇓-12 Postmortem studies in patients who received linear agents have documented gadolinium deposition in the CNS, again most prominently in the dentate nucleus and globus pallidus, lending further credibility to imaging findings.13⇓-15
The underlying mechanism of gadolinium retention remains unknown, as does the chemical formulation of the accumulated gadolinium. Despite these unknown mechanisms, gadolinium deposition is thought to involve dissociation of gadolinium from its chelating ligand, so macrocyclic agents are thought to be more stable than linear GBCAs due to their lower dissociation constants.16 Although the CNS deposition of linear GBCAs has been demonstrated previously, most studies failed to show increased signal intensity in the dentate nucleus and globus pallidus2⇓⇓⇓⇓⇓⇓⇓-10,17⇓⇓⇓⇓⇓⇓⇓⇓⇓-27 after the use of macrocyclic GBCAs. Nevertheless, a few studies do report increased signal in the brain,20,27⇓-29 including a postmortem study that detected brain gadolinium, even in the setting of macrocyclic GBCA use.30 On the other hand, two studies using highly sensitive inductively coupled plasma mass spectrometry to measure gadolinium in the brain in animal models did not find significant deposition with macrocyclic agents in the parenchyma, so the picture remains mixed.31,32
GBCAs undergo primary renal clearance;33 hence, determining whether renal impairment could predispose a patient to gadolinium deposition is important. Patients on hemodialysis receiving a linear GBCA have a greater increase in dentate nucleus signal intensity (SI) compared with controls not on dialysis.11 In 2017, Lee et al20 showed that in a subgroup of 28 patients, there was a significant change in SI ratios in patients with estimated glomerular filtration rates (eGFR) between 45 and 60 mL/min/m2 who received the macrocyclic agent gadoterate meglumine. Although much has been discussed regarding nephrogenic systemic fibrosis in the context of renal impairment, there is surprisingly little known regarding the potential effects of abnormal renal function on long-term CNS gadolinium deposition.
The purpose of this study was to specifically investigate whether a relationship exists between SI and renal function in patients receiving a large number (≥10) of administrations of the macrocyclic GBCA gadobutrol.
MATERIALS and METHODS
This single-institution retrospective study was approved by the institutional review board. A waiver of consent was obtained due to the anonymized and retrospective nature of the study.
Subject Selection
MR images and electronic health records of all patients who underwent ≥10 brain MR imaging studies with intravenous gadobutrol contrast at our institution between February 1, 2014, and January 1, 2018, were included. Exclusion criteria were a history of contrast-enhanced MR imaging at an outside facility during the study period, a lack of precontrast axial T1-weighted images in either the first or last study, no creatinine measurements in the electronic health record during the study period, and the presence of masses or lesions that precluded the ability to interrogate any of the following regions of interest (ROIs): dentate nucleus, globus pallidus, pons, and thalamus.
Clinical Data
Demographic and clinical data were obtained, including indications for imaging. The number of gadobutrol MR imaging scans and gadobutrol doses for each scan were recorded, from which the total gadobutrol administration was calculated. The time between the first and last MR imaging examinations during the study period was also calculated. Peak and average creatinine during the study period was collected for each patient. As per standard clinical practice, the Chronic Kidney Disease Epidemiology Collaboration equation was used to calculate the minimum and average eGFR for adult patients, while the Bedside Schwartz equation was used for this purpose in patients younger than 18 years of age.34,35
MR Imaging and Analysis
MR imaging examinations were performed using clinical 1.5T or 3T MR imaging units at our institution (1.5T Magnetom Aera, 1.5T Magnetom Avanto, 3T Magnetom Trio, 3T Biograph mMR, 3T Magnetom Skyra, 3T Magnetom Prisma; Siemens). Axial unenhanced T1-weighted images were obtained using standard product pulse sequence clinical scanning parameters for 2D T1-weighted turbo spin-echo imaging, though the exact parameters varied on the basis of the scanner. Section thickness ranged from 3 to 5 mm.
All MR imaging examinations were performed before and after the administration of the intravenous agent Gadavist (gadobutrol; Bayer Schering Pharma), using a standard, weight-based target dose of 0.1 mL/kg (0.1 mmol/kg) to obtain contrast-unenhanced and contrast-enhanced images.
Unenhanced axial T1-weighted turbo spin-echo images were analyzed using previously described techniques by Kanda et al.36 Circular ROIs were placed on the dentate nucleus, globus pallidus, pons, and thalamus for the first and last imaging study in each patient. ROIs were placed on left-sided anatomic structures, unless a mass or lesion precluded proper ROI placement on the left, in which case the right-sided structure was used if suitable. These ROIs were used to measure the mean SI in each structure and to calculate the SI ratios of the dentate nucleus-to-pons (DN/P) and the globus pallidus-to-thalamus (GP/T) for first and last scans as per previously described methodology.36 ROIs were placed in consensus by 2 observers blinded to the number of scans.
Statistical Analysis
Statistical analyses were performed using GraphPad Prism (Version 8; GraphPad Software) and Matlab (2018a; MathWorks). Normality of data was determined using the Shapiro-Wilk test, and parametric or nonparametric statistical tests were applied correspondingly.
Variables of interest were age at last scan, sex, total gadobutrol dose, total number of scans, percentage changes in DN/P and GP/T SIs from first to last scan (ΔDN/P, ΔGP/T), and the minimum and mean eGFR. The null hypothesis that ΔDN/P and ΔGP/T were equal to zero was first tested using a 1-sample t test or Wilcoxon signed rank test. Pearson and Spearman correlations were performed to check for associations between the ΔDN/P and ΔGP/T with each of age, sex, total dose, number of scans, and minimum and mean eGFR. Partial correlations were then calculated between ΔDN/P and ΔGP/T and minimum and mean eGFR while controlling for the other variables. Subjects were batched into groups based on minimum eGFR, using standard cutoffs for stages of chronic kidney disease (>90, 60–90, 45–60, <45) and average eGFR (>90, 60–90, <60), and differences in ΔDN/P and ΔGP/T between the groups were assessed using the ANOVA test. Two-sided P values ≤ .05 were considered statistically significant. All correlations were performed in Matlab (MathWorks), while the other statistical tests were performed via GraphPad Prism (GraphPad Software).
RESULTS
197 patients underwent ≥10 contrast-enhanced MR imaging examinations with gadobutrol at our institution between February 1, 2014, and January 1, 2018. Of these, 28 were excluded due to lack of unenhanced precontrast axial T1-weighted images in the needed studies, 24 were excluded due to contrast imaging at an outside hospital during the study period, 9 were excluded due to the presence of brain lesions precluding ROI placement, and 5 were excluded on the basis of the lack of documented creatinine during the study period (Fig 1A). 131 patients were ultimately included in the study, with a range of 10–28 total number of scans per patient (Fig 1B). Demographics and clinical characteristics are summarized in Table 1. 127 of 131 patients were imaged for prior or active tumors, and 101 patients (77.1%) received radiation therapy during the study period.

Flow chart detailing patient selection (A) along with a histogram detailing how many subjects had a specific number of scans performed (B).
Patient demographics and clinical characteristicsa
The Shapiro-Wilk test showed that eGFR, mean eGFR, and ΔGP/T between first and last scans were normally distributed (P > .05), while age at last scan, sex, total gadobutrol dose, number of scans, and ΔDN/P between the first and last scans were not. These results dictated whether parametric or nonparametric tests would be used for statistical analyses.
When we compared the first and last scans among all patients, the average ΔDN/P was 0.31%, while the average ΔGP/T was 0.15% (Fig 2). A 1-sample t test with the null hypothesis that the average ΔGP/T was equal to zero was statistically insignificant (95% confidence interval, 0.57–0.87; P = .68). A Wilcoxon signed rank test with the null hypothesis that the median ΔDN/P was equal to zero also failed to show a statistically significant change (data median = 0.24, sum of positive ranks = 4629, sum of negative ranks = −4018, P = .48).

Plot of the percentage change from the first to last scan of the signal intensity ratios of both DN/P and GP/T. Circles represent each of the 131 individual subjects. Error bars indicate the SD from the mean.
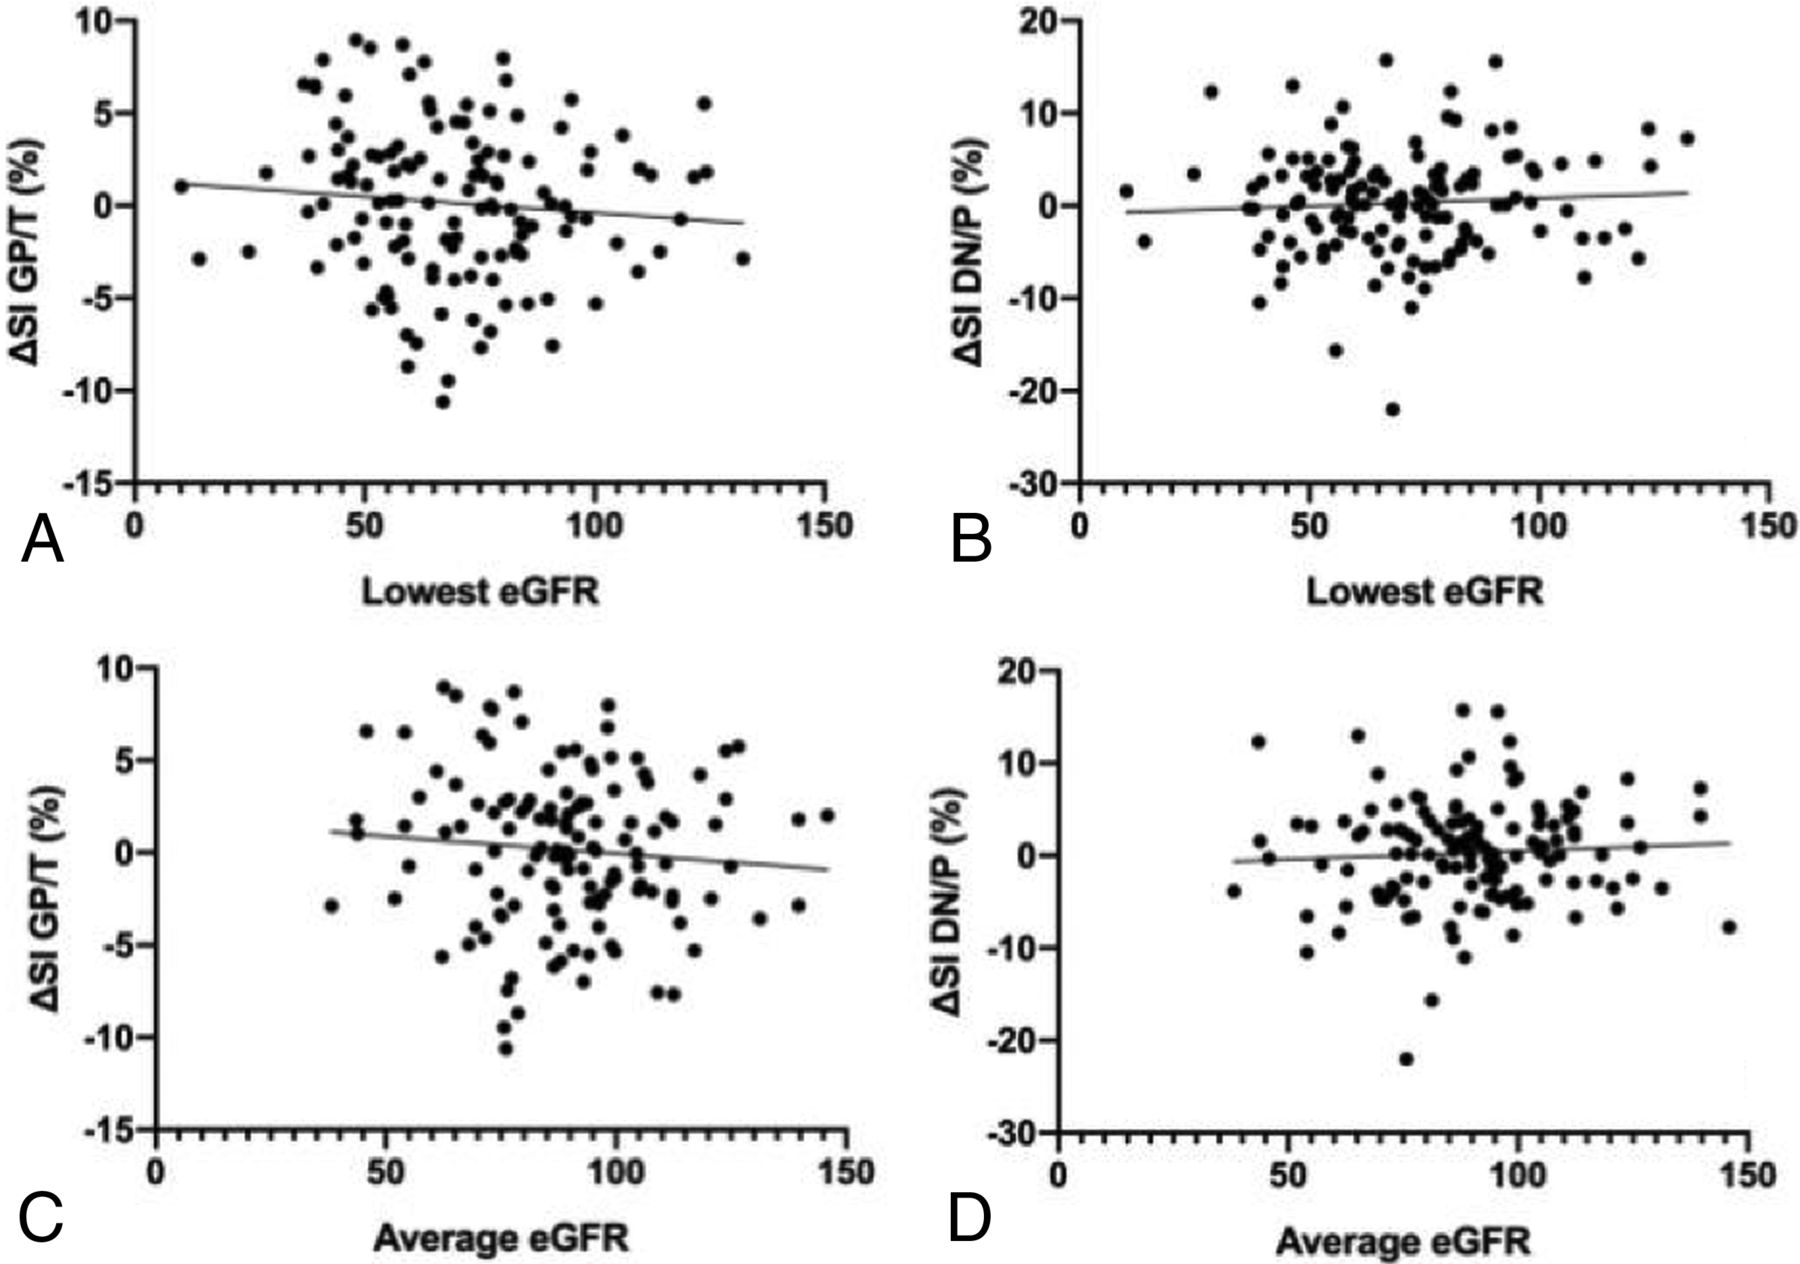
Figure 3 shows scatterplots of ΔDN/P and ΔGP/T versus the minimum and mean eGFR. The results of correlational analyses are shown in Table 2. Pearson correlations were calculated for ΔGP/T versus the minimum and mean eGFR, while Spearman correlations were calculated for every other comparison. We found no association between eGFR and ΔDN/P (r = −0.09, P = .28; r = −0.09, P = .30 for minimum and mean eGFR, respectively) or ΔGP/T (r = 0.07, P = .43; r = 0.07, P = .40). There was also no association of ΔGP/T with age at last scan (r = −0.05, P = .54), sex (r = −0.04, P = .65), total gadobutrol dose (r = 0.12, P = .18), and number of scans (r = 0.09, P = .33). Furthermore, no significant associations were present between ΔDN/P and age at last scan (r = 0.11, P = .21), sex (r = 0.05, P = .54), total gadobutrol dose (r = −0.07, P = .43), or number of scans (r = 0.12, P = .18).

Scatterplot of the lowest and average eGFR versus percentage change in signal intensity ratios of GP/T, shown in A and C, respectively, and DN/P, shown in B and D, respectively, from first to last scan. Lines of best fit are also shown on each graph.
Correlation coefficients and P values for relationships between either ΔGP/T or ΔDN/P and age at last scan, sex, total gadobutrol dose, number of scans performed with gadolinium contrast, lowest eGFR, and average eGFRa
Table 2 shows the results of partial correlations performed to assess the relationships of both ΔGP/T and ΔDN/P with minimum eGFR and average eGFR, controlling for the other variables. Again, no statistically significant correlations were present (r = 0.16, P = .07; r = 0.15, P = .08 for ΔDN/P; r = −0.14, P = .12; r = −0.15, P = .09 for ΔGP/T).
Patients were batched into groups based on their minimum eGFR and mean eGFR (Fig 4). Groups for minimum eGFR were the following: >90 (n = 22, average ΔGP/T = 0.18, average ΔDN/P = 2.13), 60–90 (n = 59, ΔGP/T = −0.41, ΔDN/P = −0.57), 45–60 (n = 34, ΔGP/T = 0.28, ΔDN/P = 1.06), and <45 (n = 16, ΔGP/T = 1.91, ΔDN/P = −0.51). Because only four patients had a minimum eGFR below 30, we did not create a group with eGFR < 30. Groups for average eGFR were >90 (n = 61, ΔGP/T = −0.08, ΔDN/P = .68), 60–90 (n = 61, ΔGP/T = 0.17, ΔDN/P = .02), and <60 (n = 9, ΔGP/T = 1.60, ΔDN/P = −0.18). Because only three patients had an average eGFR of <45, we did not create a group with eGFR < 45. ANOVA was performed to check whether there were differences in the mean ΔGP/T and ΔDN/P between groups. ANOVA in the minimum eGFR group did not find a significant difference in either mean ΔGP/T (F = 1.34, P = .26) or mean ΔDN/P (F = 1.52, P = .21). ANOVA in the average eGFR group also did not find a significant difference in either mean ΔGP/T (F = 0.63, P = .53) or mean ΔDN/P (F = 0.23, P = .79).
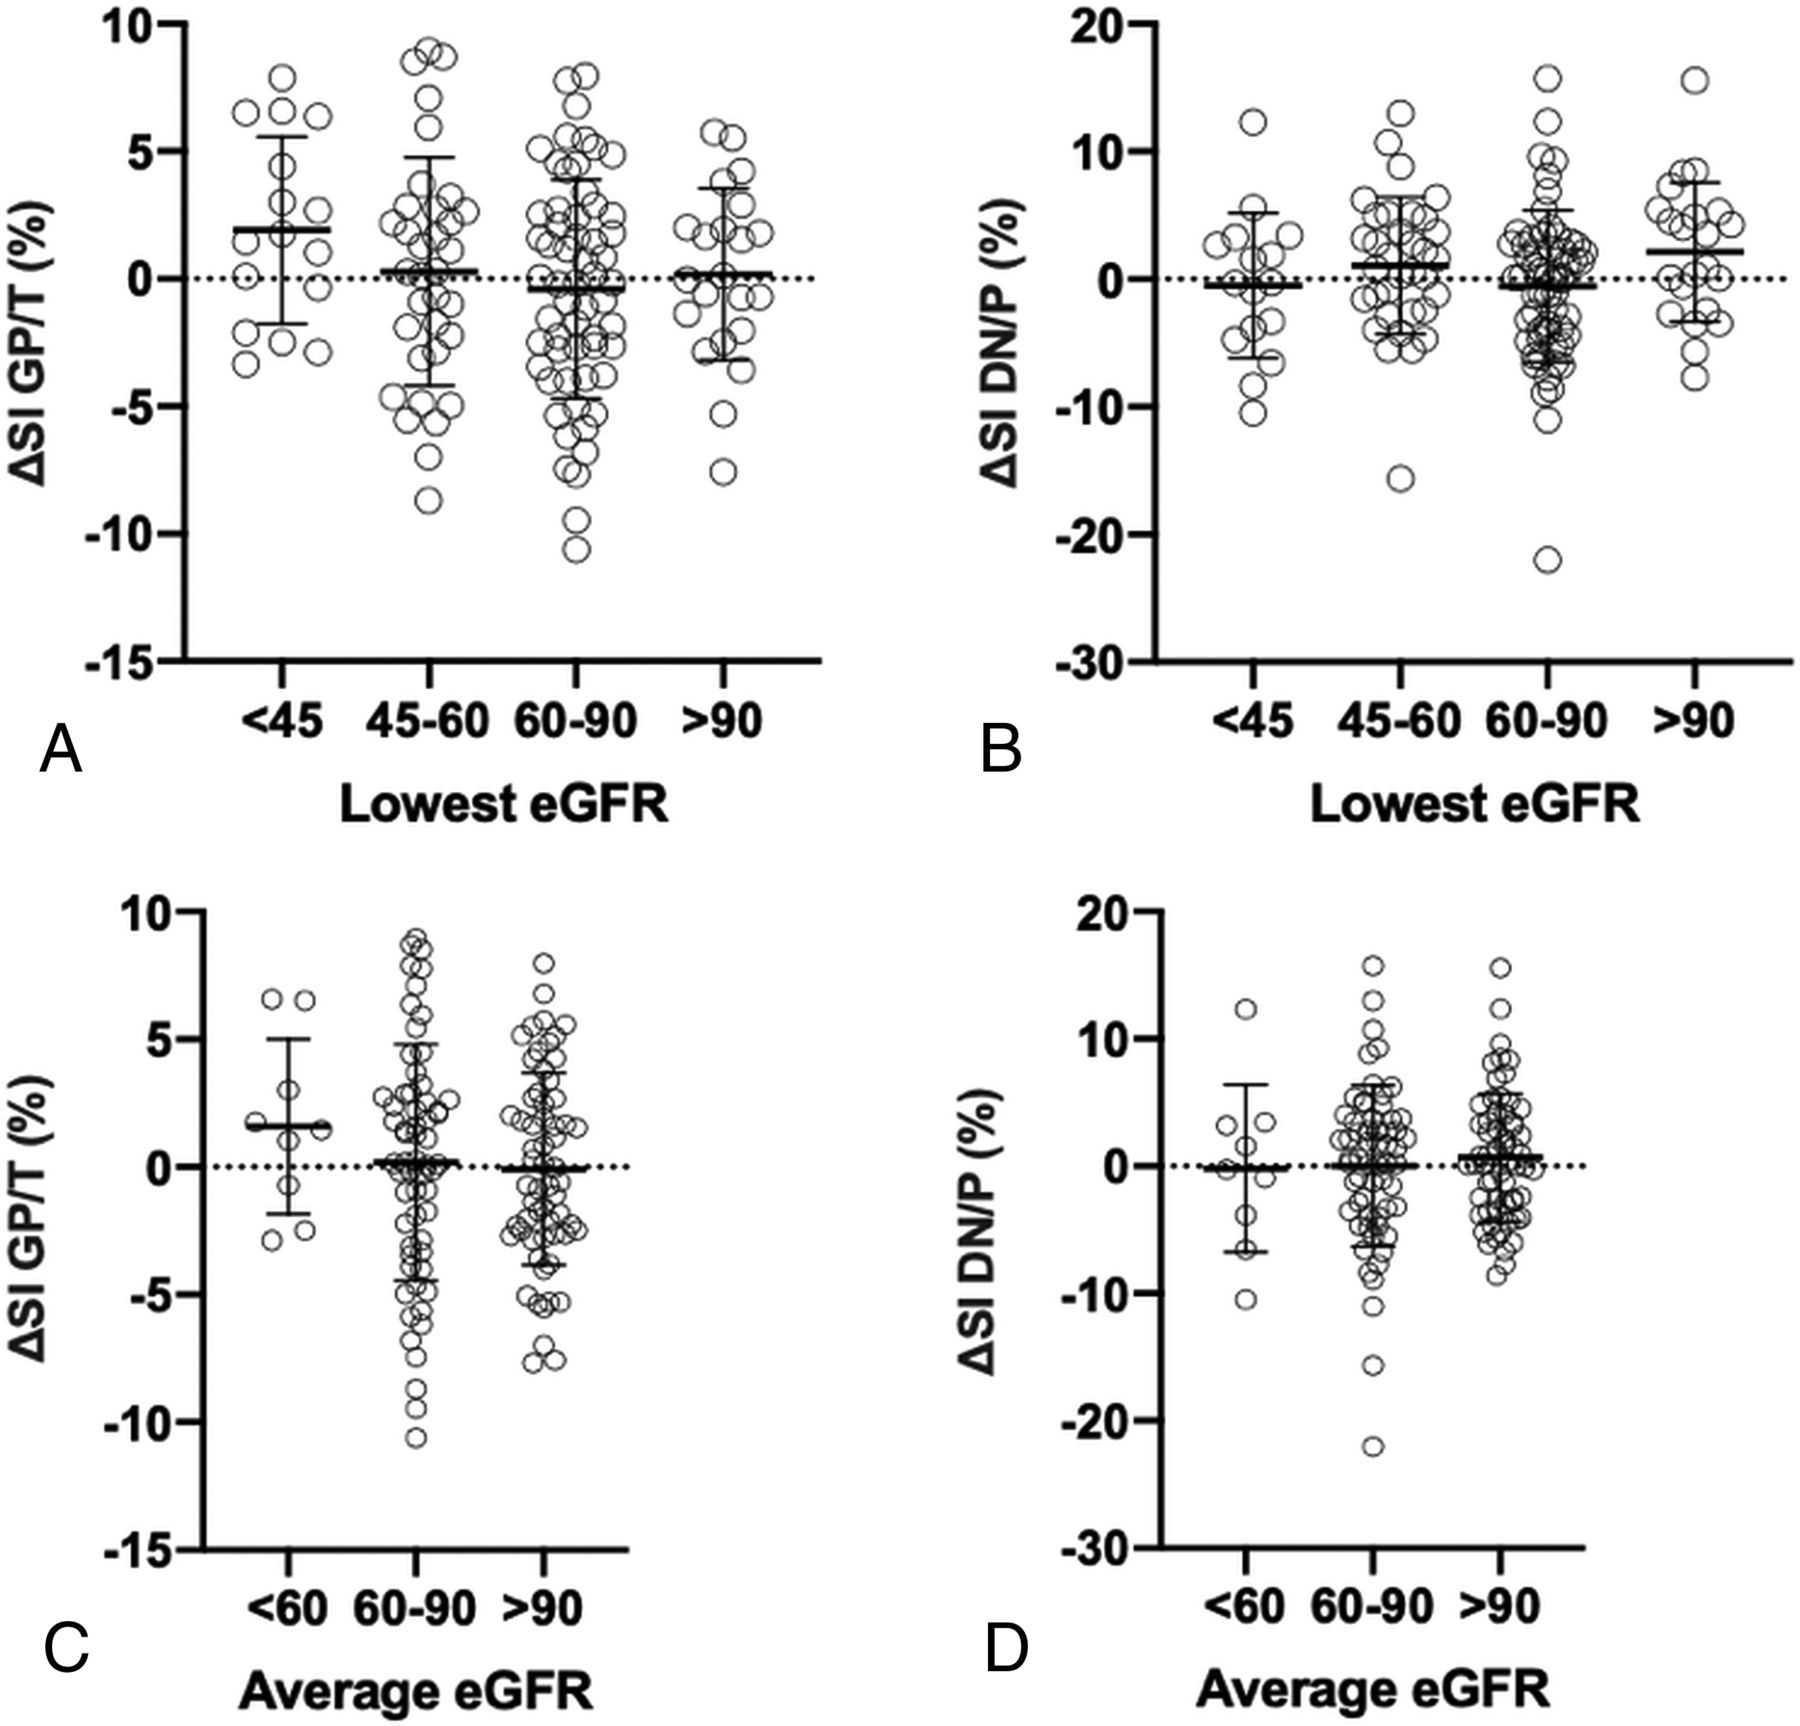
Plot of the lowest and average eGFR versus percentage change in signal intensity ratios of GP/T, shown in A and C, respectively, and DN/P, shown in B and D, respectively, from first to last scan, broken down by eGFR groupings. eGFR batches were >90, 60–90, 45–60, <45 for the lowest eGFR, and >90, 60–90, <60 for the average eGFR. Circles represent each of the 131 individual subjects. Error bars indicate the SD from the mean.
DISCUSSION
In this study of 131 clinical patients with variable renal function and high gadobutrol exposure during a 4-year period, we found no clear relationship between gadobutrol exposure (either total dosage or number of administrations) and SI change in anatomic brain regions implicated in previous reports of GBCA CNS deposition, including in patients with mild or moderate renal impairment.
GBCAs undergo renal clearance, and renal insufficiency is associated with nephrogenic systemic fibrosis. Peripheral tissue fibrosis has been correlated with the amount of deposited gadolinium.37 By prolonging GBCA circulation, renal impairment may effectively increase gadolinium exposure and potentially increase the risk of gadolinium deposition. Previous studies have documented increased DN/P or GP/T SI associated with intravenous gadolinium administration, particularly with linear agents. Macrocyclic agents have been shown to be markedly less frequently associated with such long-term CNS gadolinium effects. Nevertheless, pathology reports show that even macrocyclic agents can be associated with small amounts of CNS gadolinium deposition, though it remains unclear why corresponding MR imaging signal changes are not frequently detected.30
Limited studies explored the effect of renal function on the deep gray nuclei T1 after gadolinium exposure. Lee et al20 have previously reported a significant DN/P SI ratio increase from the first to last examinations in a subgroup of 28 patients with moderate renal insufficiency (eGFR = 45–60) who received gadoterate meglumine. Differences in our results may reflect differences in the contrast agent; although gadoterate meglumine and gadobutrol are both macrocyclic agents, there are differences in the relaxivity profile and formulation.38
Saake et al39 evaluated SI ratio changes and T1 relaxation times in patients with normal and abnormal renal function. In concordance with our study, no differences in the SI ratio were seen in subjects with either normal or impaired renal function who had a gadobutrol injection. However, changes in T1 relaxation time were demonstrated in the globus pallidus in subjects with gadolinium studies, indicating that T1 relaxation time changes may be more sensitive to gadolinium retention than SI ratios. Given the limitations of obtaining pathologic tissue samples, MR imaging remains a practical in vivo alternative, and overall, the use of SI ratios remains a practical approach to assessing clinical scans, though it has more limited sensitivity for the detection of low levels of gadolinium deposition in the brain compared with pathologic assessments and possibly the use of absolute relaxation times.
Limitations of the study include its retrospective nature. There were difficulties in globally capturing renal function throughout the study period, and because of the possibility of fluctuations in renal function, the granularity of renal function may be incompletely captured. However, we included two measures (minimum and mean eGFR) to develop a reasonable estimate of renal function throughout the study period, and, in fact, the results are similar using both metrics. The low number of patients with severe renal impairment (eGFR < 30) suggests that our results are most applicable to patients with mild or moderate renal impairment. Other limitations are the variability of scanner type, field strength, and pulse sequence parameters among subjects as well as scans; however, some of this variability should be mitigated via normalization of parenchymal values against internal structures, as has been used previously. As in similar studies, it is possible that age-related CNS changes during the course of the study period may have partially masked gadolinium deposition.
CONCLUSIONS
In 131 subjects who underwent an average of 12.3 MR imaging scans with intravenous administration of the macrocyclic GBCA gadobutrol, no clear relationship was observed between kidney impairment and detectable changes in DN/P or GP/T SI ratios.
Footnotes
Disclosures: Maria J. Borja—UNRELATED: Employment: NYU Langone Health; Stock/Stock Options: Teachers Insurance and Annuity Association of America-College Retirement Equities Fund; Travel/Accommodations/Meeting Expenses Unrelated to Activities Listed: reimbursement from NYU for Continuing Medical Education meetings. Yvonne W. Lui—RELATED: Grant: Leon Lowenstein Foundation.* *Money paid to the institution.
References
- Received August 18, 2020.
- Accepted after revision November 24, 2020.
- © 2021 by American Journal of Neuroradiology


