
Abstract
BACKGROUND AND PURPOSE: Intravoxel incoherent motion can simultaneously measure diffusion and perfusion characteristics. Our aim was to determine whether the perfusion and diffusion parameters derived from intravoxel incoherent motion could act as imaging biomarkers for distinguishing recurrent tumor from treatment effect in patients with glioblastoma.
MATERIALS AND METHODS: Fifty-one patients with pathologically confirmed recurrent tumor (n = 31) or treatment effect (n = 20) were assessed by means of intravoxel incoherent motion MR imaging. The histogram cutoffs of the 90th percentiles for perfusion and normalized CBV and the 10th percentiles for diffusion and ADC were calculated and correlated with the final pathology results. A leave-one-out cross-validation was used to evaluate the diagnostic performance of our classifiers.
RESULTS: The mean 90th percentile for perfusion was significantly higher in the recurrent tumor group (0.084 ± 0.020) than in the treatment effect group (0.040 ± 0.010) (P < .001). The 90th percentile for perfusion provided a smaller number of patients within an overlap zone in which misclassifications can occur, compared with the 90th percentile for normalized CBV. The mean 10th percentile for diffusion was significantly lower in the recurrent tumor group than in the treatment effect group (P = .006). Receiver operating characteristic curve analyses showed the 90th percentile for perfusion to be a significant predictor for differentiation, with a sensitivity of 87.1% and a specificity of 95.0%. There was a significant positive correlation between the 90th percentiles for perfusion and normalized CBV (r = 0.674; P < .001).
CONCLUSIONS: A histogram analysis of intravoxel incoherent motion parameters can be used as a noninvasive imaging biomarker for differentiating recurrent tumor from treatment effect in patients with glioblastoma.
ABBREVIATIONS:
- IVIM
- intravoxel incoherent motion
- ROC
- receiver operating characteristic
- AUC
- area under the ROC curve
- nCBV
- normalized CBV
In clinical practice, it is often difficult to determine whether a progressively enhancing lesion occurring after concurrent chemoradiotherapy is caused by a recurrent tumor or by treatment effect.1 Several studies have used physiologic imaging techniques, such as T2*-weighted dynamic susceptibility-weighted contrast-enhanced perfusion MR imaging, to differentiate recurrent tumor from treatment effect.1,2 Intravoxel incoherent motion (IVIM) was introduced by Le Bihan et al3,4 as a method for simultaneously measuring perfusion and diffusion. Le Bihan et al4 defined IVIM as the microscopic translational motions that occur in each image voxel in MR imaging. In biologic tissues, these incoherent motions include molecular diffusion of water and microcirculation of blood in the capillary network, called “perfusion.” These 2 phenomena account for the bi-exponential decay of the signal intensity on DWI when different diffusion b-values are applied. With the use of IVIM theory, both true molecular diffusion and water molecule motion in the capillary network can be estimated by means of a single diffusion imaging acquisition technique. The major advantages of IVIM MR imaging are as follows: it allows the simultaneous acquisition of diffusion and perfusion parameters, which can provide perfusion measures within corresponding solid lesions on ADC or the D-map without the requirement for a co-registration processing step; intravenous contrast injection is not required; and it allows processing and image analysis to be performed within a reasonable timeframe.
In the present study, we attempted to validate IVIM-derived perfusion and diffusion parameters through the use of both the pathologic correlation and normalized CBV (nCBV) derived from DSC MR perfusion imaging, which has been commonly used as a perfusion parameter for assessing the glioblastoma treatment response. For pathologic correlation, we used IVIM MR imaging in patients with pathologically confirmed recurrent tumor or treatment effect.
Our first hypothesis was that the difference in vascularity between recurrent tumor and treatment effect can be assessed by means of an IVIM-derived perfusion fraction (f), and it would correlate with the value of nCBV derived from DSC MR perfusion imaging. Our second hypothesis was that the true diffusion parameter (D), derived from a biexponential model that separates perfusion effects, may be more significantly different between the recurrent tumor and the treatment effect groups than ADC. The purpose of this study was to determine whether the perfusion (f) and diffusion (D) parameters derived from IVIM can act as imaging biomarkers for distinguishing recurrent tumor from treatment effect in patients with glioblastoma.
Materials and Methods
Our institutional review board approved this retrospective study and waived the informed consent requirement.
Patients
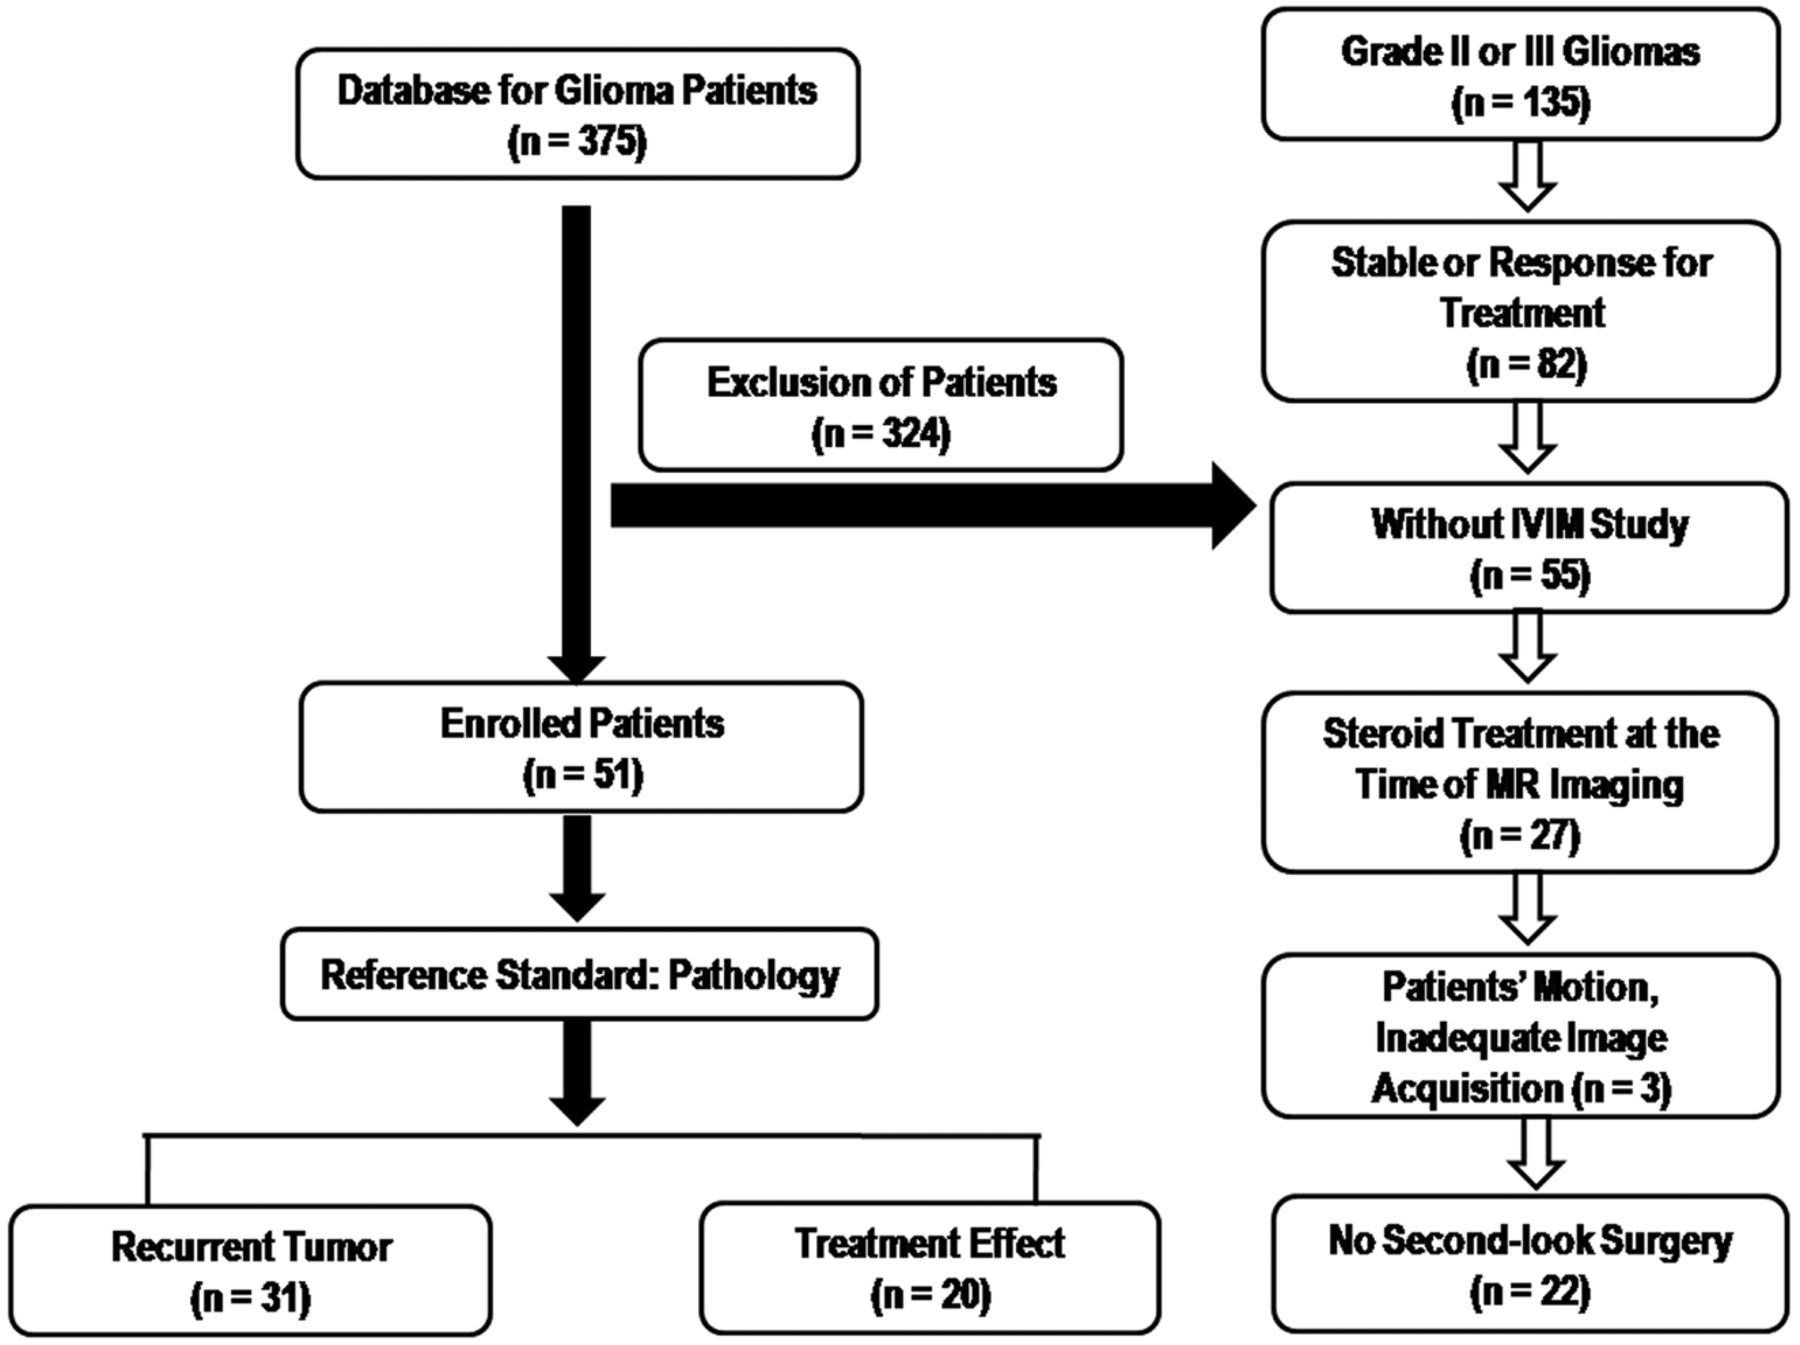
A retrospective review of our institution's data base identified 375 patients who had undergone MR imaging studies for pretreatment and posttreatment glioma evaluation between May 2011 and April 2013. Among these patients, 51 were included on the basis of the following criteria: 1) had pathologically confirmed glioblastomas before standard glioblastoma treatment; 2) underwent concurrent chemoradiotherapy after surgical resection; 3) demonstrated new or enlarged contrast-enhancing lesions seen on serial follow-up MR images including IVIM MR imaging; 4) did not have corticosteroid administration between the prior follow-up MR imaging and the time of IVIM MR imaging; 5) had adequate image acquisition and quality without patient motion or a significant susceptibility artifact; and 6) were pathologically confirmed with recurrent tumor or treatment effect after their second surgical resection. The study patient accrual process is summarized in Fig 1. Of the 51 study patients, 31 had recurrent tumor (mean age, 52.2 years; range, 35–72 years) and 20 had treatment effect (mean age, 50.5 years; range, 25–67 years).

Flow chart of our study population.
Histopathologic Diagnosis
Well-recognized pathologic features of a recurrent tumor included cellular sheets and/or nests of atypical cells, often with mitotic figures. The finding of fewer atypical cells, in a linear infiltrative configuration in parenchyma without prominent reactive changes, was also classified as recurrence. Pathologic features of treatment effects were geographic coagulative necrosis without pseudopalisading, vascular necrosis, vascular hyalinization, reactive vascular changes, dystrophic calcification, perivascular chronic inflammation, and gliosis with atypia.5
IVIM Model
In biologic tissue, IVIM includes microcirculation of blood in the capillary network, also referred to as perfusion.5 The relationship between signal variation and b factors with an IVIM-type sequence can be expressed by use of the Equation6:
 where S is the mean signal intensity, S0 is the signal intensity without diffusion, f is the fraction of the diffusion linked to microcirculation, D is the diffusion parameter representing pure molecular diffusion (the slow component of diffusion), and D* is the diffusion parameter representing incoherent microcirculation within the voxel, that is, perfusion-related diffusion or the fast component of diffusion (Fig 2).

Example of biexponential signal decay as a function of the 16 different diffusion b-values in a given voxel of a recurrent tumor. Bold, solid line is the IVIM nonlinear regression fit providing D, D*, and f. Blue line is the biexponential fit providing fast decay associated with perfusion; red line is slow decay of the biexponential fit, indicating true diffusion; yellow line is the monoexponential fit providing ADC.
MR Imaging Protocols
MR imaging was performed with the use of a 3T system (Achieva; Philips Medical Systems, Best, the Netherlands) with an 8-channel sensitivity-encoding head coil. We acquired 16 different b-values (0, 10, 20, 40, 60, 80, 100, 120, 140, 160, 180, 200, 300, 500, 700, and 900 s/mm2) in 3 orthogonal directions. The distribution of b-values was chosen to cover both the initial pseudodiffusion decay (b <200 s/mm2) and the molecular diffusion decay (b ≥200 s/mm2).7 We used a large number of lower b-values in our study to improve the accuracy of the pseudodiffusion (D*). The dependence of the diffusion-weighted signal (in log plots) on the b-value is no longer straight, as would have been expected for free diffusion, but curved, thus reflecting the multiplicity of the underlying process.8 Perfusion is expected to contribute to this curvature in a biexponential mode4 for b-values in the very low range (0–200 s/mm2 or higher for very slow flow). The total acquisition time was 4 minutes, 21 seconds. The DWI with multiple b-values was performed before contrast-enhanced MR imaging.
DSC MR perfusion imaging was performed with the use of a gradient-echo, echo-planar sequence during administration of contrast material (Dotarem; Guerbet, Paris, France) at a rate of 4 mL/s by use of an MR imaging–compatible power injector (Spectris; Medrad, Pittsburgh, Pennsylvania). The bolus of contrast material was followed by a 20-mL bolus of saline administered at the same injection rate. The detailed imaging parameters for the DSC study were as follows: repetition time/echo time, 1407/40; flip angle, 35°; field of view, 24 cm; matrix, 128 × 128; and number of sections, 20. The total DSC MR image acquisition time was 1 minute, 30 seconds.
Image Processing
All imaging data were transferred from the MR scanner to an independent, personal computer for quantitative IVIM and DSC MR perfusion analyses. An in-house program with Matlab2010b TM (MathWorks, Natick, Massachusetts) was developed to evaluate the diffusion process, not only of the monoexponential model but also of the biexponential model. Simplified biexponential models, including the Le Bihan simplified method, the Luciani method, and the Sigmund method, were implemented. A full biexponential model was also implemented to evaluate the exact IVIM diffusion parameters. IVIM parameters, including f and D, were calculated by means of the Le Bihan simplified method.
The DSC perfusion parametric map was obtained through the use of a commercial software package (nordicICE; NordicNeuroLab, Bergen, Norway). For DSC MR perfusion imaging, after eliminating recirculation of the contrast agent by use of γ-variate curve fitting and contrast agent leakage correction, the relative CBV was computed by numeric integration of the curve. On a pixel-by-pixel basis, the nCBV maps were calculated by dividing each relative CBV value by an unaffected, white matter–relative CBV value defined by an experienced neuroradiologist (H.S.K., with 9 years of clinical experience in neuro-oncologic imaging).
For quantitative analysis, contrast-enhancing lesion volumes were segmented on 3D, postcontrast, T1-weighted images by use of a semi-automated adaptive thresholding technique so that all of the pixels above the threshold value were selected. Therefore, significant regions of macroscopic necrosis that were not enhancing, as well as cystic areas, were excluded. The resulting entire enhancing tumor volumes were verified by the experienced neuroradiologist (H.S.K.), who was blinded to the clinical outcome, and they were co-registered and mapped to the f, D, nCBV, and ADC maps. Each parametric value was calculated on a pixel-by-pixel basis for the segmented contrast-enhancing volume and used for the histogram analysis (Fig 3). For the cumulative histogram parameters, the 90th percentile for f (f90) and nCBV (nCBV90) and the 10th percentile for D (D10) and ADC (ADC10) were derived (the nth percentile is the point at which n% of the voxel values that form the histogram are found to the left).

A 51-year-old man with recurrent tumor. A, Axial contrast-enhanced T1-weighted image shows a necrotic contrast-enhancing lesion in the left temporoparietal lobe. The f-map (B) and nCBV map (C) show visual increases of the f and nCBV values in the corresponding areas of the contrast-enhancing lesion. The visual D-value (D) is similar to that of white matter.
Statistical Analysis
Kaplan-Meier curves and log-rank tests were used to evaluate the association of the pathologic results (recurrent tumor/treatment effect) with overall survival. All data are expressed as mean ± standard deviation. The Student t test was used to assess significant differences in f90, nCBV90, D10, and ADC10 between the recurrent tumor and the treatment effect groups.
In the receiver operating characteristic (ROC) curve analysis, the cutoff points, determined by maximizing the sum of the sensitivity and specificity, were calculated to differentiate the 2 entities. A leave-one-out cross-validation was used to evaluate the performance of our classifiers. In each round of the leave-one-out validation, one participant was selected as a testing sample. The remaining participants were used as training samples to construct the classifier. The testing sample was then classified with the trained classifier. This procedure was repeated until each participant was tested once. The performance of the histogram parameters was evaluated with sensitivity and specificity. Sensitivity was determined as TP/(TP + FN), and specificity was determined as TN/(TN + FP), where TP is a true-positive finding (test results showed recurrent tumor, and the final pathologic diagnosis was also recurrent tumor); TN, a true-negative finding (test results showed treatment effect, and the final pathologic diagnosis was also treatment effect); FP, a false-positive finding (test results showed recurrent tumor, but the final pathologic diagnosis was treatment effect); and FN, a false-negative finding (test results showed treatment effect, but the final pathologic diagnosis was recurrent tumor).
The association of f90 and nCBV90 was assessed by means of Pearson and partial correlation analyses. SPSS 19.0 for Windows (IBM, Armonk, New York) was used to perform all statistical analyses. Probability values <.05 were considered to indicate statistically significant differences.
Results
The mean interval between IVIM MR imaging and second-look surgery was 12.5 days. The mean time for postprocessing of the IVIM histogram was 3 minutes, 37 seconds. Descriptive statistics regarding the demographic data obtained in both the patients with recurrent tumor and treatment effect are summarized in Table 1. When the Kaplan-Meier curves and log-rank tests were used to evaluate the association of the pathologic results (recurrent tumor/treatment effect) with overall survival, we found that the differences were not statistically significant, though the patient group with treatment effect tended to have longer overall survival than those with recurrent tumor (Table 1).
Comparison of study patient demographic data
Visual Analysis of the IVIM MR Parameters and Histogram Distribution
Among the 51 study patients, all patients with recurrent tumor and 5 patients with treatment effect showed that the signal decay curve, plotted as a function of the diffusion b-values, was biexponential and ranged from 0–900 s/mm2. Recurrent tumors show more rapid signal decay than do treatment effects in the range of lower b-values (b <200 s/mm2). In the remaining 15 of the 20 patients with treatment effect, the signal decay curve was similar to the monoexponential pattern. The f histogram in recurrent tumors showed a higher relative frequency at a high f value compared with treatment effects, thus resulting in substantial divergence between recurrent tumors and treatment effects at the high end of the cumulative histograms. The D-histogram in recurrent tumors showed a higher relative frequency at a low D value compared with treatment effects, thus resulting in a substantial divergence between recurrent tumors and treatment effects at the low end of the cumulative histograms. The f- and D-maps and their histograms of representative cases of recurrent tumor and treatment effect are shown in Figs 3 and 4.

A 45-year-old man with treatment effect. A, Axial contrast-enhanced T1-weighted image shows a necrotic contrast-enhancing lesion in the right temporoparietal lobe. The f-map (B) and nCBV map (C) show no visual increase of the f and nCBV values in the corresponding areas of the contrast-enhancing lesion. D-map (D) shows visual increase of the D value.
Diagnostic Performance of the IVIM Histogram Parameters
The mean ± standard deviation of f90, D10, nCBV90, and ADC10 in both the recurrent tumor and treatment effect groups are shown in Table 2, and representative cases of each group are shown in Figs 3 and 4. f90 showed statistically significant differences between recurrent tumor and treatment effect, with the recurrent tumor group showing higher f90 (mean ± standard deviation, 0.084 ± 0.020 versus 0.040 ± 0.010; P < .001). On the ROC curve and box-and-whisker plots, f90 showed a clear difference between the 2 groups and provided a smaller number of patients within an overlap zone in which misclassifications can occur compared with nCBV90 (14 patients versus 19 patients; Figs 5 and 6). The mean D10 was significantly lower in the recurrent tumor group (mean ± standard deviation; 0.940 ± 0.097 [10−3·mm2·s−1]) than in the treatment effect group (1.008 ± 0.045 [10−3·mm2·s−1]) (P = .006).
Difference of the mean cumulative histogram cutoff values of IVIM MR imaging parameters, nCBV, and ADC in patients with recurrent tumor and treatment effect

ROC curve indicates the sensitivities and specificities of f90-based differentiation between recurrent tumor and treatment effect. The overlap zone (14 patients) between dotted lines on the box-and-whisker plot shows the same interval in which misclassifications can occur on the ROC curve.

ROC curve indicates the sensitivities and specificities of nCBV90-based differentiation between recurrent tumor and treatment effect. Overlap zone (19 patients) between dotted lines on the box-and-whisker plot shows the same interval in which misclassifications can occur on the ROC curve.
The results of the ROC analyses of the quantitative IVIM histogram parameters used to distinguish recurrent tumor from treatment effect are summarized in Table 3. ROC curve analyses showed f90 to be the best predictor for differentiating recurrent tumor from treatment effect (area under the ROC curve [AUC], 0.957; 95% CI, 0.860–0.994). Although f90 showed the largest AUC, the difference of AUC between f90 and nCBV90 was not significant. ROC curve analysis indicated that the diagnostic models that were based on all of the IVIM histogram parameters had a statistically significant P value.
Diagnostic performance of the cumulative histogram cutoff values of the IVIM MR imaging parameters, nCBV, and ADC values for differentiating recurrent tumor from treatment effect
According to ROC curve analyses for distinguishing recurrent tumor from treatment effect, the cutoff values were 0.056 for f90 and 0.970 for D10 when all 51 patients were regarded as a training set. With f90 as a discriminative index, sensitivity and specificity for differentiation were 87.1% (27 of 31 patients with recurrent tumor) and 95.0% (19 of 20 patients with treatment effect), respectively. With D10 as a discriminative index, sensitivity and specificity were 71.0% (22 of 31 patients with recurrent tumor) and 75.0% (15 of 20 patients with treatment effect), respectively (Table 3).
Partial correlation analysis showed a significantly positive correlation between f90 and nCBV90 (r = 0.674; P < .001) for all cases with histopathology as the controlling variable.
Discussion
To the best of our knowledge, the treatment response evaluation for brain tumor by use of the IVIM method has not yet been reported. In the present study, we attempted to validate the IVIM-derived perfusion and diffusion parameters to determine whether an enlarging, contrast-enhancing lesion was caused by recurrent tumor or by treatment effect as the perfusion and diffusion characteristics of posttreatment tumors can differ from those suggested by the Le Bihan biexponential model. Our study clarified the different perfusion characteristics of recurrent tumor and treatment effect on the basis of the IVIM biexponential model. We found that the mean f90 had a significantly higher value in the recurrent tumor group than in the treatment effect group. According to ROC curve analysis, f90 and D10 showed excellent diagnostic accuracy as predictors for differentiating recurrent tumor from treatment effect.
Previous reports have proposed that DSC perfusion MR imaging has the potential to distinguish tumor recurrence from treatment effect through the use of relative CBV maps.9,10 In the present study, we found that the diagnostic performance of IVIM-derived perfusion and diffusion parameters were more successful for differentiating recurrent tumor from treatment effect than prior work that was based on perfusion and diffusion imaging alone; however, the difference was not statistically significant. The possible explanation for this result might be attributed to the contrast agent leakage effects, which depend on the attenuation and spatial distribution of tumor cells within the extracellular extravascular space and can lead to an additional susceptibility calibration factor. Moreover, IVIM MR imaging by use of spin-echo–based DWI can be less sensitive to T2* susceptibility artifact than is DSC MR imaging.
Le Bihan et al6 suggested that the f value measures the fractional volume of capillary blood flowing in each voxel. Regarding tumor angiogenesis and its correlation with perfusion parameters, tumor angiogenesis is a complex multistep process and is characterized morphologically by an increase in the number of blood vessels and endothelial cell proliferation.11,12 Recurrent tumors are usually higher-grade tumors with increased neoangiogenesis, which leads to increased CBV as well as increased permeability surface area product. In the present study, we did not find any visual discordance between the nCBV and IVIM-derived perfusion parameters for differentiating recurrent tumor and treatment effect. However, the correlation coefficient between f90 and nCBV90 was not as high as we had expected. There can be a number of reasons that account for this correlation result. The most important reason could be that these 2 perfusion parameters represent different aspects of tumor vessels. CBV measures mainly microvascular attenuation, and f measures microscopic translational motions associated with microcirculation of blood. Similarly, Jain et al13 reported that CBV showed a significant positive correlation with microvascular attenuation, whereas permeability parameter showed a significant positive correlation with microvascular cellular proliferation, which suggests that these perfusion parameters represent different aspects of tumor vessels. Moreover, spin-echo–based IVIM imaging has a substantially different vessel size sensitivity profile from that of gradient-echo–based DSC MR imaging. Further studies that correlate the IVIM-derived perfusion fraction with various MR perfusion parameters, including CBF and permeability parameters, are needed for understanding the exact meaning of the IVIM-derived perfusion parameter.
On quantitative analysis, 4 of 31 patients with recurrent tumors showed false-negative findings on both IVIM and DSC perfusion MR images. The detailed mechanism of these concordance false-negative findings of the 2 imaging methods remains unclear. However, the possible mechanism is that tumor vessels can be compromised as the result of the rapid growth of the tumor cells, necrosis, and increased permeability of the vessels causing interstitial edema, which can result in compression of the smaller vessels, also leading to areas of hypoperfusion. Another mechanism may be a technical limitation that the diffusion parameters estimated from the biexponential model could be sensitive to noise and to the initial values used for data fitting.
DWI with the use of quantitative summary measures such as the ADC has shown the potential to distinguish tumor regrowth from radiation injury. Several previous studies have shown that the ADC value with a monoexponential model can help to differentiate tumor recurrence from treatment-related change.14,15 Our study showed that D10 differed more significantly between the recurrent tumor and the treatment effect groups than did ADC10. Although the exact pathophysiologic mechanism for determining the difference between the ADC10 and D10 results is unclear, the significant perfusion difference between the recurrent tumor and the treatment effect groups may contribute to the ADC-D difference. Similarly, Yamada et al16 reported lower IVIM-derived D values compared with ADC in enhancing lesions of the liver, confirming that ADC is contaminated by perfusion.
To date, no objective study of IVIM MR imaging has been used to assess the treatment response of brain tumor. IVIM MR imaging has several major advantages. First, it is clinically relevant to simultaneously obtain diffusion and perfusion information17 and can provide ADC or D-map–guided perfusion measures without a co-registration processing step. Second, although we used a contrast-enhanced protocol for direct comparison between DSC perfusion MR and IVIM parameters, IVIM MR imaging can provide perfusion information without the need for intravenous contrast media. This is particularly relevant in patients with compromised renal function or severe allergies and those who cannot be given intravenous, gadolinium-based contrast media.18 Last, the IVIM method can provide standardized values if the same modeling was used; therefore this method has potential to be used in multicenter clinical trials.
Our study has several limitations. First, the number of study patients was relatively small. Further prospective analyses with a larger number of patients will be needed to validate our results. Second, 9 of 51 study patients underwent stereotactic biopsy, which is subject to sampling errors, at the time of second-look surgery, and our pathology estimates of regions of recurrent tumor versus treatment effect were not determined by direct correlation between tissue-specimen histopathology and corresponding region of parametric map, as shown by Hu et al.2 However, in clinical practice, such quantitative correlation is very difficult to achieve and may be less clinically important than determining a robust method for distinguishing areas of abnormality that are unlikely to progress rapidly from areas that are likely to progress. Last, the set of b-values used in our study was not optimized. To achieve a shorter examination time without sacrificing the precision of the techniques, the b-values might be further optimized in a separate study as a function of the available IVIM parameter values in the brain.
Conclusions
IVIM-derived perfusion and diffusion parameters can act as noninvasive imaging biomarkers for assessing the treatment response in patients with posttreatment glioblastoma.
Footnotes
This study was supported by the Basic Science Research Program through the National Research Foundation of Korea, funded by the Ministry of Education, Science, and Technology (grant 2009–0076988).
Indicates open access to non-subscribers at www.ajnr.org
REFERENCES
- Received May 10, 2013.
- Accepted after revision July 1, 2013.
- © 2014 by American Journal of Neuroradiology


