Abstract
SUMMARY: Resting-state fMRI was first described by Biswal et al in 1995 and has since then been widely used in both healthy subjects and patients with various neurologic, neurosurgical, and psychiatric disorders. As opposed to paradigm- or task-based functional MR imaging, resting-state fMRI does not require subjects to perform any specific task. The low-frequency oscillations of the resting-state fMRI signal have been shown to relate to the spontaneous neural activity. There are many ways to analyze resting-state fMRI data. In this review article, we will briefly describe a few of these and highlight the advantages and limitations of each. This description is to facilitate the adoption and use of resting-state fMRI in the clinical setting, helping neuroradiologists become familiar with these techniques and applying them for the care of patients with neurologic and psychiatric diseases.
ABBREVIATIONS:
- ALFF
- Amplitude of Low Frequency Fluctuations
- BOLD
- blood oxygen level–dependent
- FCD
- functional connectivity density
- ICA
- independent component analysis
- ReHo
- regional homogeneity
- rs-fMRI
- resting-state fMRI
The brain controls all the complex functions in the human body. Structurally, the brain is organized grossly into different regions specialized for processing and relaying neural signals; functionally, the brain is subspecialized for perceptual and cognitive processes. Working in concert, these subspecialized areas orchestrate complex bodily functions and allow human behavior.
Neurons do not contain any internal reserves of energy, either in the form of glucose or oxygen. When activated, they are provided with more energy by the adjacent capillaries through a process called the hemodynamic response, which supplies them with increased regional cerebral blood flow and an increase in oxygen supply, usually even greater than their needs.1,2 This process results in a change in terms of the relative levels of oxyhemoglobin and deoxyhemoglobin that can be detected by MR imaging on the basis of their differential magnetic susceptibilities. This imaging approach is called blood oxygen level–dependent (BOLD) contrast imaging. Conventionally, BOLD signal change has been known to be modulated by the arterial partial pressure of CO2 level. More recent research suggests that BOLD signal is determined by both the arterial partial pressure of O2 and CO2, rather than CO2 alone.3 The change in the BOLD signal is the cornerstone of functional MR imaging,4,5 which is traditionally used to construct maps indicating subspecialized brain regions that are activated by certain tasks or reacting to a stimulus at a low frequency (0.01–0.1Hz). The frequencies of neural activity fluctuations measured by fMRI (which are low-frequency and indirectly measured using BOLD signal) and of neural firing measured in neurophysiologic studies (which are high-frequency and are directly measured) are different.6,7
The biologic significance of the neural activity fluctuations was first described by Biswal et al in 1995.8 When the subjects were asked to perform bilateral finger tapping in that experiment, researchers identified a highly correlated BOLD time course between the left somatosensory cortex and the homologous areas in the contralateral hemisphere.8 Since then, fMRI has been widely used in both healthy subjects and patients with neurologic and psychiatric disorders to analyze synchronous, spontaneous fluctuations of various resting-state networks.9 Because of the neurovascular coupling, the BOLD signal, while vascular in nature, is strongly related to neuronal activity.10 However, the delay of the hemodynamic response following neural activation is responsible for the relatively poor temporal resolution of fMRI,11 and the BOLD signal can be altered in brain regions where the blood circulation is altered.12⇓–14 For example, pathologic conditions such as traumatic brain injury15⇓–17 or anoxic brain injury18⇓⇓–21 might affect neurovascular coupling and therefore make fMRI suboptimal to assess neural activity in these pathologic conditions. Therefore, these factors should be taken into consideration when designing calibrated BOLD experiments and interpreting functional connectivity data, especially in patients with vascular pathologies.3
As opposed to paradigm- or task-based functional MR imaging, resting-state fMRI (rs-fMRI) is acquired in the absence of a stimulus or a task, in other words at rest. The principle of rs-fMRI is also based on the BOLD signal fluctuation, which is the same as for active-task fMRI. rs-fMRI focuses on spontaneous BOLD signal alterations. Data can be acquired with a dedicated scan, in which individuals are instructed to simply rest, or by inferring resting-state data from periods of rest embedded within a series of tasks.22 The lack of a task makes rs-fMRI particularly attractive for patients who may have difficulty with task instructions, such as those with neurologic, neurosurgical, and psychiatric conditions, as well as for pediatric patients. Thus, the application of rs-fMRI in the research and clinical setting has been growing for the past 2 decades.9,23
There are multiple ways to analyze rs-fMRI data, and each approach has implications in terms of what information can be extracted from the data. This article attempts to provide a broad overview of major analysis methods that are used in rs-fMRI. We will systematically describe these approaches, their advantages, and limitations. This work will help nonexperts become familiar with rs-fMRI techniques and how to apply them to the benefit of patients with neurologic, neurosurgical, and psychiatric disorders.24,25
Analytic Methods
rs-fMRI analysis is challenging due to the massive amount of data and the need for sophisticated analysis. Before one applies any of the analytic methods, realignment and removal of confounding artifacts (eg, head motion, CSF signal) are important preprocessing steps. Other main preprocessing steps are required on rs-fMRI data, including removing the first 10∼20 time points, slice timing, data normalization, and band-pass filtering. Other possible procedures, including smoothing, may be performed in different sequences according to the analytic method applied. Several software packages, including but not limited to statistical parametric mapping, Analysis of Functional Neuro Images (AFNI; http://afni.nimh.nih.gov/afni), the CONN toolbox (https://www.nitrc.org/projects/conn/), MELODIC (https://fsl.fmrib.ox.ac.uk/fsl/fslwiki/MELODIC), and Group ICA of fMRI Toolbox Software (GIFT; http://mialab.mrn.org/software/gift/), are commonly used to analyze rs-fMRI data. Pipelines26,27 have also been developed to analyze data almost automatically, which make the data analysis much easier for nonexperts.
Proper interpretation of rs-fMRI data results requires an understanding of anatomy, pathophysiology, and neuroscience, to make logical inferences. For easy understanding, the large amount of information contained in the rs-fMRI data can be compared with a map.28 When one looks at a map, one can focus on finding cities or highways linking cities with each other. Similarly, when one analyzes rs-fMRI data, one can extract information on the function of specific brain regions or the functional connectivity between different brain regions. Analytic approaches can be broadly divided into 2 types: functional segregation and functional integration.29,30 Functional segregation focuses on the local function of specific brain regions and is mainly used for brain mapping. Functional integration focuses on the functional relationships or connectivity between different brain areas and assesses the brain as an integrated network. Functional segregation techniques rely on the analysis of rs-fMRI activity, while functional integration techniques rely on the analysis of rs-fMRI connectivity. By comparing the rs-fMRI results with the way we look at a map, one can understand these different methods more intuitively.
Functional Segregation Methods for Identifying Neural Networks
Functional segregation divides the brain into regions according to their specific functions30: Amplitude of Low Frequency Fluctuations (ALFF) and regional homogeneity (ReHo) are methods commonly used in functional segregation assessments. Fractional-ALFF and ReHo reflect different aspects of regional neural activity (“cities”) but do not provide information on functional connectivity (“highways”). Although they are similar in many ways, they reveal different aspects of brain abnormalities in clinical populations.31⇓⇓–34 The combined application of these 2 methods provides more information than either method alone. We next discuss each of these methods and their advantages and disadvantages and how they complement each other.
ALFF Analysis
The ALFF method measures the total power of the BOLD signal within the low-frequency range between 0.01 and 0.1 Hz (Fig 1A35; the results are visualized with the REST Slice Viewer; http://www.restfmri.net36). ALFF is proportional to regional neural activity.35 Fractional-ALFF is a variant that measures the power within the low-frequency range (0.01–0.1 Hz) divided by the total power in the entire detectable frequency range and represents the relative contribution of the low-frequency oscillations.37 ALFF and fractional-ALFF measure regional brain activity only (like traffic in cities on a map, ALFF reveals the density of “traffic” as an absolute value, while fractional-ALFF looks at the density of traffic as a proportion in cities). Thus, they do not provide information on functional connectivity between brain regions.

Results of ALFF and ReHo studies (1-sample t test results of 200 healthy volunteers [M.W., unpublished data, February 6, 2017]). A, ALFF results. B, ReHo results. Results of increased ALFF and ReHo are mostly overlapped with the default mode network, which is activated at resting-state in healthy volunteers. (For different kinds of patients, abnormal ALFF or ReHo findings may be detected in other brain areas in the resting-state.) Both ALFF and ReHo results reflect regional neural activities. ALFF is focused on measuring the strength of the activity, while ReHo is more specific for coherence and centrality of regional activity. T indicates peak intensity.
Subsets of frequency bands have been reported as follows: 1) Frequencies between 0.010 and 0.027 Hz may reflect cortical neuronal activity, 2) frequencies between 0.027 and 0.073 Hz may reflect basal ganglia activity, and 3) frequencies between 0.073 and 0.198 Hz and 0.198 and 0.250 Hz have been associated with physiologic noise and white matter signal, respectively.38⇓⇓⇓–42 However, there is an active ongoing debate about whether rs-fMRI can actually detect white matter activity. Reasons for white matter fMRI activation remain controversial and require further investigation.13 Mounting evidence supports the spatial properties of the white matter being assessed using functional correlation tensor analysis based on rs-fMRI data.43,44 Functional correlation tensor results showed similarities to those of diffusion tensor imaging but represent a separate entity. Future studies involving functional correlation tensor analysis of rs-fMRI data may provide insight into the network interaction features of the brain within the white matter.
The advantage of the ALFF and fractional-ALFF methods lies in the simplicity of the analysis without any underlying hypothesis. Both ALFF and fractional-ALFF show remarkably high temporal stability45 and long-term (about 6 months) test-retest reliability.46 Fractional-ALFF is reportedly more specific to gray matter37; however, it has slightly lower test-retest reliability.46 Therefore, both measurements are commonly reported together to maximize the reliability across subjects, with sufficient specificity to examine individual differences.
Regional Homogeneity Analysis
ReHo analysis is a voxel-based measure of the similarity between the time-series of a given voxel and its nearest neighbors, as calculated by the Kendall coefficient of concordance of the BOLD time-series. It measures the synchrony of adjacent regions (equivalent to the concordance of traffic between “downtown” and the “suburbs” in a city) (Fig 1B).47 A higher ReHo value represents higher coherence and centrality of regional brain activity. Higher coherence and centrality are usually associated with, but not necessarily, equal-to-high activity. Thus, the results of fractional-ALFF and ReHo should be discussed separately.48 Areas that overlap in ALFF and ReHo represent regions that are not only active at the same time frequency but are also active in sync with neighboring voxels. This representation means that the regions are not only active but also engaging a relatively large group of neurons.47
ReHo is usually calculated within a low-frequency range, typically between 0.01 Hz and 0.1 Hz. It can be subdivided into different frequency bands. Lower frequency (0.01–0.04 Hz) ReHo is more sensitive for cortical activity.49 The exact biologic meaning of ReHo measurements in different frequency bands still needs further exploration. Several studies demonstrated the frequency dependence of the ReHo changes in different neurologic conditions.42,50⇓–52 Future rs-fMRI research focusing on the biologic meaning of ReHo should be conducted in both healthy subjects and patients with specific conditions using spectrum-specific analytic strategies.
The test-retest reliability of the ReHo method is very high, even when subjects are rescanned after a long interval (6 months).46 Zuo et al53 developed a ReHo computation method along 2 dimensions (surface) using cortical surface-based fMRI analysis after projecting individual preprocessed data into a cortical surface space. It is more reliable than a method based on conventional 3D (volume) because of the following: 1) It could accurately calculate the ReHo value on the cortical surface by avoiding a mixture of gray and white matter; and 2) by avoiding mixing adjacent brain tissues in 3D space due to the highly folded human cortex, it could more precisely characterize functional homogeneity within a brain region. Like ALFF, ReHo does not require an a priori definition of the ROI and can provide information about regional activity throughout the brain. ALFF and ReHo may also be applied together to reveal different aspects of brain regional function and abnormalities arising in clinical populations.31,33,34,54,55
Both ALFF and ReHo methods can be used to reveal local neural activity of the brain. Those methods are used to define an ROI for seed-based functional connectivity analysis (further discussed below). However, because the brain is more appropriately studied as an integrated network rather than isolated clusters, the excitement for stand-alone functional segregation methods has gradually receded in favor of functional integration methods. Another limitation of ReHo is the relatively unclear biologic meaning of ReHo in the different frequency bands.
Functional Integration Methods for Identifying Neural Networks
Functional integration focuses on the functional connectivity (highways on the map) between different regions of the brain. Functional connectivity measures the degree of synchrony of the BOLD time-series between different brain regions. The connectivity can be the result of a direct anatomic connection or an indirect path56 via a mediating region or may have no known anatomic correlate. Functional connectivity can also be due to a common source of input signals. Of note, with rs-fMRI, the highways may not be directly visualized, only the brain regions presumably connected by these paths. Separate research effort focuses on directly visualizing the highways using different MR imaging modalities, including diffusion tensor imaging and tractography. Functional integration is the foundation of information transfer between different brain areas.30,57
For assessing functional integration features, commonly used computational methods include functional connectivity density analysis, ROI-based functional connectivity analysis, independent component analysis (ICA), and graph analysis.
Functional Connectivity Density Analysis
Functional connectivity density (FCD) is the most basic measurement of functional connectivity.58 FCD analysis attempts to identify the highly connected functional hubs (Fig 2). FCD reveals only how connected a voxel is but not the regions with which this voxel is connected. FCD analysis calculates the correlation of the BOLD time-series between each voxel and all the other voxels in the brain. Short-range and long-range FCD maps can be calculated.59,60 The cutoff distance is typically 75 mm.59,60 Short-range FCD is measured by the correlation analysis of the BOLD time-series between each voxel and the voxels around it within a distance of 75 mm (and represents some kind of long-range ReHo). The short-range FCD may reflect the regional functional connectivity plasticity around this voxel.60 The long-range FCD is the result of the global FCD minus the short-range FCD and could reflect long-distance functional connectivity plasticity.

Results of an FCD study (1-sample t test results of 200 healthy volunteers [M.W., unpublished data, February 6, 2017]). The FCD reaches its highest value in the posterior cingulate cortex/precuneus, reflecting the highest density of functional connectivity of these voxels in healthy subjects. Results are like those of previous studies reviewed by Tomasi.58 FCD parameters: TSNR = 50 and Tc = 0.6.
FCD analysis is straightforward. It does not need any model assumptions to be performed. It can reveal the importance of functional hubs of brain connectivity but does not indicate which regions are connected. FCD should be interpreted with caution due to its moderate long-term (about 6 months) test-retest reliability.46
Seed-Based Functional Connectivity Analysis
Seed-based functional connectivity, also called ROI-based functional connectivity, finds regions correlated with the activity in a seed region. In seed-based analysis, the cross-correlation is computed between the time-series of the seed and the rest of the brain (telling us where the traffic is communicating between selected cities) (Fig 3, the results are visualized with the BrainNet Viewer; https://www.nitrc.org/projects/bnv/61). Several metrics (eg, the cross-correlation coefficient, partial correlations, multiple regressions, and synchronization likelihood) can be used to assess associations between time-series of brain areas. The coupling of activation between different brain areas indicates that they are involved in the same underlying functional process and thus interpreted as functionally connected. These brain regions may not be directly connected by neural fibers. The overall connectivity of the brain with this method can be visualized using a connectivity matrix, showing the strength of all connections between seed regions within the brain (Fig 3). Such a matrix has been commonly used in clinical applications, (eg, presurgical localization, identification of patients with Alzheimer disease, or distinction of different types of dementia).62 Such clinical applications of rs-fMRI have been extensively described in previous reviews.63⇓–65

Brain maps show the group average spatial representation of the results of a seed-based functional connectivity study (results of 200 healthy volunteers [M.W., unpublished data, October 6, 2017]). The posterior cingulate cortex was set as a seed. Nodes represent brain area; lines represent functional connectivity between nodes. A, Left view. B, Right view. C, Upper view. D, Lower view. R indicates right; L, left; PCC, posterior cingulate cortex; ACC, anterior cingulate cortex; SFG, superior frontal gyrus; IPL, inferior parietal lobule.
Seed analysis requires a priori determination of the seeds, which is often based on a hypothesis or prior results. Seeds may also be derived from ALFF or ReHo calculations. Seed time-series may also be performance or physiologic variables (such as breathing or heart rate). The main advantage of seed analysis is that the computation is simple and the interpretation of the results is intuitive. However, when the seed region changes, the results of the functional connectivity analysis will also change, and sometimes obviously. Thus, the disadvantage of seed analysis is its dependence on the selection of seeds, which makes it vulnerable to bias.
Independent Component Analysis
Independent component analysis uses multivariate decomposition to separate the BOLD signal into several independent functional networks in the form of spatial maps, which are temporally correlated.66⇓–68 Each functional network (component) embodies an independent network of neurons with synchronized BOLD activity (network of cities with high traffic between them). Each functional network is reported as a spatial map of the z scores derived from the correlation between the time-series of each voxel and the mean time-series of that brain network. The average z score for each network indicates the magnitude of functional connectivity within the network.
There are several resting-state networks that commonly emerge from ICA analysis in rs-fMRI studies, including but not limited to the default mode network, auditory network, salience network, executive control network, medial visual network, lateral visual network, sensorimotor cortex, dorsal visual stream (frontoparietal attention network), basal ganglia network, limbic network, and precuneus network.68⇓–70 These networks show resting-state connectivities, some of which are observed to be up- or down-regulated during specific cognitive tasks.
ICA is data-driven as opposed to seed-based analysis, which is ROI-driven. ICA can be performed without any a priori assumptions, except the selection of the number of independent components to identify. While seed analysis extracts only the regions functionally connected to the ROI, ICA extracts all detectable networks within the subject (Fig 4). ICA analysis shows relatively high test-retest reliability for both the short term (<45 minutes) and the long term (5∼16 months).71 However, the underlying cause of the perceived synchrony within the functional networks may be non-neural in origin (such as breathing or pulsation). This inherent property of ICA complicates the interpretation of ICA results. ICA only presents brain networks one by one. It does not show between-module connections or communications between different brain networks.72 Additional issues are that a single network could be broken into subnetworks, depending on the number of independent components specified, and that using ICA requires either manual or computer-driven identification of specific networks.

Typical reported networks (results of 200 healthy volunteers [M.W., unpublished data, February 6, 2017]). A, Default mode network. B, Auditory network. C, Medial visual network. D, Lateral visual network. E, Sensorimotor network. F, Precuneus network. G, Dorsal visual stream (frontoparietal attention network). H, Basal ganglia network. I, Executive control network. J, Visuospatial network.
Independent vector analysis73⇓–75 is a recent extension of ICA. Like ICA, independent vector analysis maximizes the dependence between associated components from different datasets. These components are conceptually regrouped into so-called source component vectors. The ability of independent vector analysis to capture variability in spatial components across individuals and groups may be superior to that of ICA.76⇓–78 Independent vector analysis can also be applied in the analysis of spatiotemporal dynamic features of brain networks.
Graph Analysis
Graph theory has been extensively used to examine the properties of complex networks. A small-world network (or “clique”), which was first described in social networks, is characterized as graphs with attenuated local connections and few long connections.79 A small-world network is one in which most nodes (ie, regions) are not connected to one another, but nodes can be reached from every other node through a small number of connections. In other words, there are small networks of highly connected nodes in clusters (cities in 1 “state”) working together (“brain moduli”72 or states) to carry out a specific task or perform a specific cognitive function, with a few connections (limited number of highways between states) between these networks exhibiting prominent small-world organization and facilitating efficient information delivery at low wiring and energy costs.80
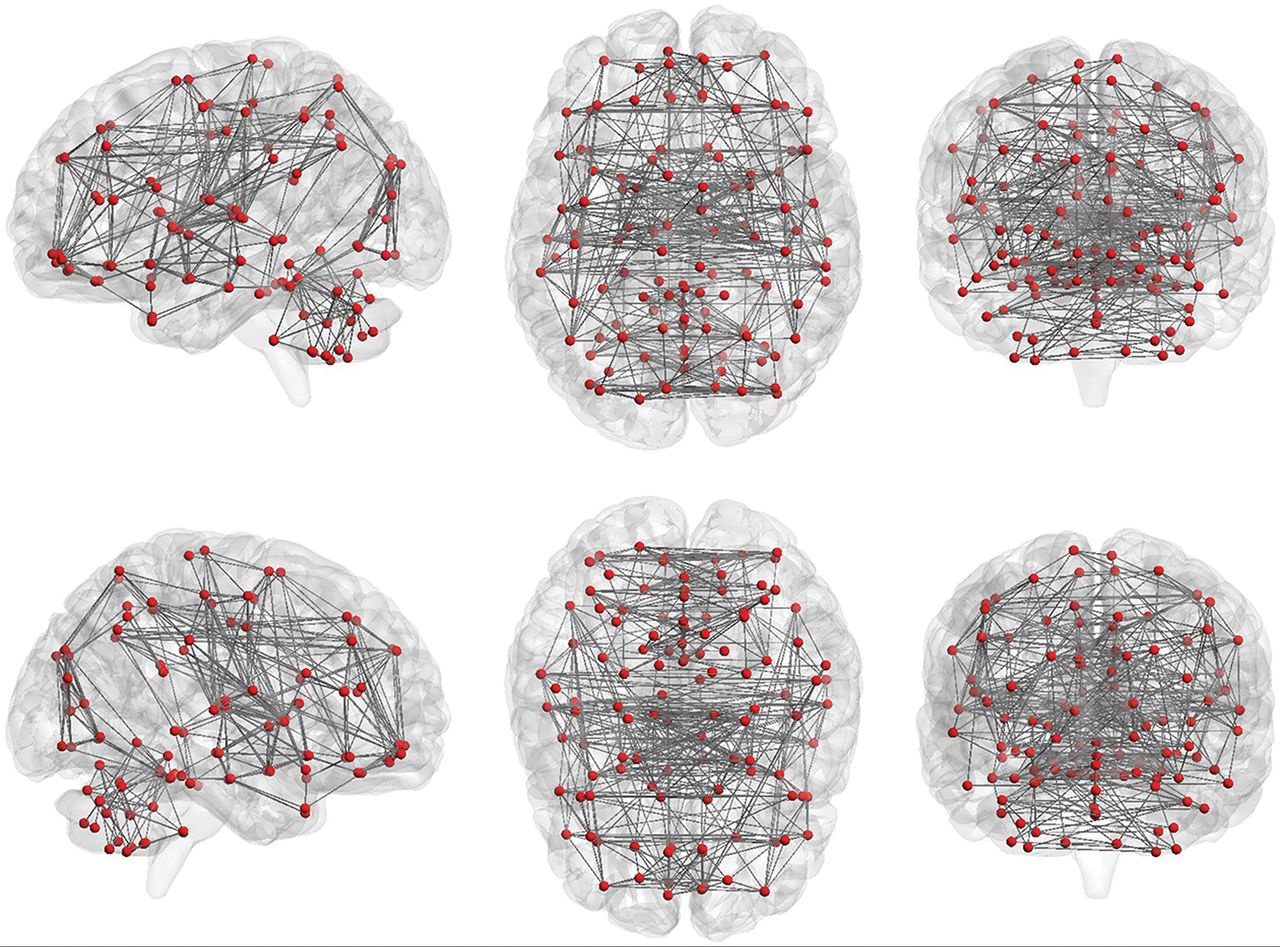
Graph theory provides a theoretic framework for analyzing the topology of brain networks by examining both the local and global organization of neural networks.80⇓–82 In graph theory, functional brain networks can be defined as a graph (G) as a function of nodes (V) and functional connections (E), represented by G = f(V,E).59,83,84 Nodes (V) may represent voxels or ROIs. The Automated Anatomical Labeling atlas, which contains 116 regions (90 nodes in the cerebrum and 26 nodes in the cerebellum, Fig 5), can be used to define the nodes for this analysis, but there are also many other parcellation schemes available for general use.69,85⇓–87 The level of functional connectivity (E) between 2 nodes is computed by the correlation between the time-series of the 2 nodes. First, the functional connectivity between all possible node-pairs is computed. A graph representation of the functional brain network is then constructed using a predefined cutoff threshold of E. The following are some of the key graph analysis parameters:
Nodes and functional connections are the basis of graph analysis. The whole brain includes 116 seeds (red dots; 45 nodes in each hemisphere of the cerebrum and 26 nodes in cerebellum) set on the basis of the anatomic parcellation defined by the Automated Anatomical Labeling atlas. Lines represent possible functional connections between those seeds.
1) “Clustering coefficient” describes the level of local neighborhood clustering. It reflects the level of local connectedness of a network.
2) “Characteristic path length” describes the average number of connections between all pairs of nodes. It reflects the global connectivity of the network, which reflects the efficiency of the network.
3) “Node degree” describes the number of connections of a node. It helps identify the highly connected nodes within the network.
4) “Centrality” describes the number of short-range connections for each node. Nodes with higher centrality contribute more to the overall efficiency of the network.
5) “Modularity” describes the extent to which groups of nodes are connected to the members of their own group. It reflects the existence of subnetworks within the full network.
Graph analysis of rs-fMRI reveals a highly efficient organization of the brain network optimized toward a high level of local and global efficiency,81,82 often referred to as small-world topology. The small-world topology could characterize the whole-brain map as well as different brain networks. Graph analysis can be automatically performed using published software,88 without any a priori assumptions and with minimal bias. However, the results are often not intuitive and may be difficult to interpret.
Combined Study Recommendations
rs-fMRI has been widely used to characterize neuropsychiatric disorders using many of the methods described above.89 There are multiple methods available to identify networks within rs-fMRI data on the basis of the connectivity using data-driven parcellation and on anatomic priors. Each method emphasizes different approaches to defining brain connectivity. There is no single method currently considered a criterion standard on its own. Thus, these different methods are complementary to each other. The application of rs-fMRI is facilitated by methods that use a priori definitions of brain regions and brain networks. Combining different methods is one opportunity for yielding a more complete data-driven characterization of whole-brain resting connectivity than may be possible using one of the currently available single methods. An example of such a combination is the use of FCD, fractional-ALFF, or ReHo analysis, based on a graph theory framework, to identify ROIs for the functional connectivity analysis, as described above.
New Horizons
rs-fMRI is a rapidly evolving field with new analytic techniques introduced on a very regular basis. One such new methodology currently being proposed is the “chronnectome.”90 So far, researchers mainly focused on the temporal properties of functional connectivity between different brain regions, implicitly assuming that functional connectivity (or traffic between cities) during the scanning time is relatively static. The chronnectome approach is based on a different assumption, that of temporal evolution of spatial properties of functional connectivity (dynamic, nonstationary patterns of traffic between cities) during the scanning time. Chronnectome approaches have shown promising results for studying the spatiotemporal dynamic features of brain networks in healthy subjects91⇓⇓⇓–95 and patients.43,96⇓⇓⇓⇓–101
Conclusions
rs-fMRI is an imaging technique that plays a growing role in characterizing normal and abnormal functional brain connectivity in a variety of clinical conditions. To date, there are several different approaches and techniques to analyze rs-fMRI data, and the number of available methods is continually expanding. The different analysis methods are complementary, and applying several methods to the same dataset may yield better results compared with applying 1 method alone. A better understanding of each processing method is helpful in interpreting the common/divergent findings reported in the rs-fMRI literature.
Footnotes
Disclosures: Leanne M. Williams—UNRELATED: Board Membership: PsyberGuide, Comments: member of the Scientific Advisory Board; Grants/Grants Pending: National Institutes of Health*; Payment for Lectures Including Service on Speakers Bureaus: University of Minnesota, Comments: Grand Rounds. Greg Zaharchuk—UNRELATED: Grants/Grants Pending: National Institutes of Health, GE Healthcare. Michael Zeineh—UNRELATED: Grants/Grants Pending: National Institutes of Health, Doris Duke Charitable Foundation, Dana Foundation, Foundation of the ASNR, GE Healthcare*. Tali M. Ball—RELATED: Grant: National Institute of Mental Health, Comments: Salary support was provided by National Institute of Mental Health training grant T32MH019938; UNRELATED: Other: PsyberGuide, Comments: one-time payment to provide content for their Web site. Max Wintermark—UNRELATED: Board Membership: GE NFL Advisory Board. *Money paid to the institution.
Dr Ball is supported by grant T32MH019938 from the National Institute of Mental Health.
The content of this article is solely the responsibility of the authors and does not necessarily represent the official views of the National Institutes of Health.
Indicates open access to non-subscribers at www.ajnr.org
References
- 1.
- 2.
- 3.
- 4.
- 5.
- 6.
- 7.
- 8.
- 9.
- 10.
- 11.
- 12.
- 13.
- 14.
- 15.
- 16.
- 17.
- 18.
- 19.
- 20.
- 21.
- 22.
- 23.
- 24.
- 25.
- 26.
- 27.
- 28.
- 29.
- 30.
- 31.
- 32.
- 33.
- 34.
- 35.
- 36.
- 37.
- 38.
- 39.
- 40.
- 41.
- 42.
- 43.
- 44.
- 45.
- 46.
- 47.
- 48.
- 49.
- 50.
- 51.
- 52.
- 53.
- 54.
- 55.
- 56.
- 57.
- 58.
- 59.
- 60.
- 61.
- 62.
- 63.
- 64.
- 65.
- 66.
- 67.
- 68.
- 69.
- 70.
- 71.
- 72.
- 73.
- 74.
- 75.
- 76.
- 77.
- 78.
- 79.
- 80.
- 81.
- 82.
- 83.
- 84.
- 85.
- 86.
- 87.
- 88.
- 89.
- 90.
- 91.
- 92.
- 93.
- 94.
- 95.
- 96.
- 97.
- 98.
- 99.
- 100.
- 101.
- © 2018 by American Journal of Neuroradiology