
Abstract
BACKGROUND AND PURPOSE: Intraplaque hemorrhage in the carotid artery is related to an increased risk of cerebrovascular ischemic events. We aimed to investigate whether quantitative susceptibility mapping can characterize carotid artery plaque components and quantify the severity of intraplaque hemorrhage.
MATERIALS AND METHODS: For this ex vivo quantitative susceptibility mapping study, 9 carotid endarterectomy specimens were imaged on a 3T MR imaging scanner using a 3D multi-echo gradient-echo sequence and a microscopy coil. The samples were examined histologically using immunostains, including glycophorin A and Prussian blue. The areas of erythrocytes, iron deposits, calcification, and fibrous matrices observed on stained sections were compared with quantitative susceptibility mapping findings and their mean susceptibility values.
RESULTS: Intraplaque hemorrhage and iron deposits were observed only in areas hyperintense on quantitative susceptibility mapping; calcifications and fibrous matrices were prevalent in hypointense areas. The mean susceptibility values for necrotic cores with intraplaque hemorrhage but no iron deposits, cores with iron deposits but no intraplaque hemorrhage, cores without either intraplaque hemorrhage or iron deposits, and cores with calcification were 188 ± 51, 129 ± 49, −11 ± 17, and −158 ± 78 parts per billion, respectively. There was a significant difference in the mean susceptibility values among the 4 histologic components (P < .01). The mean susceptibility values of the whole plaque positively correlated with the percentage area positive for glycophorin A (r = 0.65, P < .001) and Prussian blue (r = 0.47, P < .001).
CONCLUSIONS: Our findings suggest that quantitative susceptibility mapping can characterize the composition of carotid plaques and quantify the degree of intraplaque hemorrhage and iron deposits.
ABBREVIATIONS:
- CR
- contrast ratio
- GYPA
- glycophorin A
- ICH
- intracranial hemorrhage
- IPH
- intraplaque hemorrhage
- QSM
- quantitative susceptibility mapping
- SV
- susceptibility value
Vulnerable atherosclerotic plaques in carotid arteries are obviously correlated with cerebrovascular ischemic events such as ischemic stroke and transient ischemic attacks.1,2 The characteristics of vulnerable plaques are intraplaque hemorrhage (IPH), lipid-rich necrotic cores, thin fibrous caps, and, to a lesser extent, plaque calcification.2 IPH in the carotid artery is related to an increased risk of plaque rupture; it plays a critical role in stratifying the risk of future events in patients with carotid atherosclerosis.3,4 In a meta-analysis, the presence of IPH increased the risk of cerebrovascular events 5- to 7-fold.5 While carotid endarterectomy or carotid artery stent placement helps prevent future stroke, it may elicit intraoperative embolic complications, especially when plaques contain many vulnerable components such as IPH or lipids.6 Therefore, a method for characterizing the intraplaque components is needed for the prediction of cerebrovascular ischemic events and perioperative complications.
Imaging modalities for the evaluation of IPH should be noninvasive and easily accessible in daily clinical practice. There are various noninvasive imaging methods to recognize carotid vulnerable plaques in vivo. However, ultrasonography including contrast-enhanced sonography, shear wave elastography, and CT including contrast-enhanced CT cannot accurately diagnose IPH.7
Multiparametric qualitative MR imaging can help visualize components that render plaques vulnerable to rupture.8⇓⇓⇓-12 T1-weighted and fat- and flow-suppressed sequences are the preferred imaging modalities to evaluate IPH because they exploit methemoglobin-induced T1-shortening.13,14 However, it can be difficult to differentiate IPH from the lipid-rich necrotic core.15 The disadvantages of these qualitative and semiquantitative approaches include their operator dependency, the need for reference tissue, and their lack of specificity for the identification of plaque components.
Quantitative susceptibility mapping (QSM) is a quantitative imaging technique that has been used to assess hemorrhage, iron, and calcification in the brain.16⇓⇓-19 To our knowledge, no earlier studies correlated histopathologic findings with QSM data on carotid plaque components, including IPH. Therefore, we investigated whether QSM can be used to characterize the composition of carotid plaques and to quantify the degree of intraplaque hemorrhage.
MATERIALS AND METHODS
The institutional review board of the University of Miyazaki Hospital approved our retrospective, observational study and waived the requirement for informed consent.
Patients and Carotid Plaque Specimens
This study included 9 carotid specimens of 9 male patients ranging in age from 63 to 83 years (mean age, 73 years) who underwent carotid endarterectomy with en bloc excision at the University of Miyazaki Hospital or affiliated hospitals between March 2015 and March 2017. Of these patients, 8 had symptomatic stenosis of 60%–95% and 1 patient had asymptomatic stenosis of 60%. The percentage diameter of stenosis was determined using the NASCET criteria on contrast-enhanced CT angiography.20 The clinical profiles of the patients included hypertension (n = 6), diabetes mellitus (n = 2), and hyperlipidemia (n = 1).
The specimens were fixed in formaldehyde immediately after carotid endarterectomy. The time from fixation to MR imaging ranged from 9 to 60 days (mean, 35.5 ± 16.1 days). Formalin-fixed samples were placed on a 5-mm-thick 2% agarose gel layer in 10-cm petri dishes. The dorsal surface was marked for proper orientation, and the samples were carefully embedded in 2% agarose gel to remove all air.
MR Imaging Protocol
Agarose-embedded samples were subjected to MR imaging on a 3T scanner (Inginia 3T CX; Philips Healthcare, Best, the Netherlands) using dStream Microscopy coil (47 mm, Philips Healthcare) (Fig 1). A 3D multiecho gradient echo sequence was acquired in the axial plane; the parameters were the following: TE = 7.2/13/20/26/32/38 ms; FOV = 100 × 100 mm; matrix = 216 × 216 mm2; voxel size = 0.2 × 0.2 × 1.0 mm3; scan time = 9 minutes 32 seconds. 3D multiecho gradient echo data were used for QSM using complex data and a morphology-enabled dipole inversion method.21

Resected carotid artery specimen from a 72-year-old man. Tissue preparation for MR imaging and histology studies. Formalin-fixed carotid endarterectomy tissue specimens (B and C) were cut into 3-mm-thick sections and matched at 3-mm intervals against the corresponding MR image (A). Blue dye was used for plaque orientation (C).
The MR imaging protocol also included 3D T1-weighted MPRAGE sequences; the parameters were the following: TR/TE = 7/2.8 ms; FOV = 100 × 100 mm; matrix = 256 × 256 mm2; voxel size = 0.2 × 0.2 × 0.6 mm3; scan time = 5 minutes 20 seconds.
Histologic and Immunohistochemical Analysis
Carotid endarterectomy tissue specimens were cut into 3-mm-thick slices to match the corresponding MR imaging scans (Fig 1); they were embedded in paraffin, cut into 3-μm-thick sections, and stained with H&E. Azan trichrome was used to visualize the fibrous collagen matrix. Prussian blue staining was performed to visualize ferric iron (Fe3+) to identify hemosiderin deposits indicative of chronic hemorrhage. To detect erythrocytes, we stained sections with an antibody against glycophorin A (GYPA) (Dako, Glostrup, Denmark), a sialoglycoprotein on the erythrocyte membrane and visualized with EnVision system (Dako). We also applied 3,3′-diaminobenzidine tetrahydrochloride and performed counterstaining with Meyer hematoxylin. The immunostaining controls included nonimmune mouse immunoglobulin G instead of the primary antibody. Erythrocytes and Fe3+ deposits were localized by a combination of immunohistochemistry for GYPA and Prussian blue staining, respectively.
Assessment of Plaque Composition with QSM
To characterize the plaque composition with QSM, 2 radiologists (M.A., T.H.) first consensually selected foci that were hyperintense or hypointense relative to the 2% agarose gel background and manually set ROIs (Figs 2A and 3A). Then 1 pathologist (K.M.) and 1 radiologist (M.A.) consensually assessed the corresponding areas on histologic sections for spatial agreement or disagreement between the histologic sections and the QSM images. The plaque configuration and areas with specific plaque components and calcification were considered for coregistration between QSM and histology sections. Sections were excluded from further analysis when the MR images failed to match the histologic sections due to gross sample deformation during histologic processing. Also excluded were segments with histologic processing errors (damaged or inappropriately-cut plane samples) and histologic sections with spatial disagreement between histologic sections and MR images. For the final selection of histologic sections, 2 pathologists (K.M., Y.A.) consensually checked for the presence or absence of IPH, iron deposits, calcification, fibrous matrix components, dense inflammatory infiltrates, and necrotic cores without intraplaque hemorrhage in hyper- and hypointense areas on QSM images.

Representative QSM (A) and MPRAGE (B) images of carotid plaques and corresponding histologic images (C–F) in a 77-year-old man. Carotid plaque with both hyper- and hypointense areas on the QSM image (A) and corresponding MPRAGE image (B). The hyperintense ROI (A, yellow outline) corresponds with histologic evidence of intraplaque hemorrhage and erythrocytes in the atherosclerotic necrotic core (C, H&E stain). The glycophorin-A-positive erythrocytes and erythrocyte fragments are abundant in the plaque (D). In the hyperintense ROI (yellow outline) on the QSM image (A), Prussian blue staining shows no iron deposition (E). Two hypointense ROIs (blue outline) on the QSM image (A) correspond with basophilic calcification in the plaque (F, H&E stain). The corresponding blue and yellow outlines are placed on the MPRAGE image (B).

Representative QSM image (A) of carotid plaques of a 79-year-old man and corresponding histologic images (B and C). Carotid plaque with a hyperintense area on the QSM image (A, red outline), which contained few GYPA-positive erythrocyte components in the corresponding histologic ROI (B, red outline). There are many intracellular hemosiderin deposits (blue) and a few erythrocytes (brown, arrow) in the ROI (C).
IPH was defined as the presence of intact and/or fragmented erythrocyte foci in atherosclerotic plaques22 detected by H&E and GYPA staining; calcification, as basophilic deposits on H&E-stained sections; and fibrous matrix components, as blue foci on Azan trichrome-stained sections. Dense inflammatory infiltrates were identified by the accumulation of mononuclear cells. When erythrocyte foci in a necrotic core were absent or undetectable, the designation was necrotic core without IPH.
To measure the susceptibility value of the main plaque components on QSM images, 1 pathologist (K.M.) first assessed all H&E-, GYPA-, and Prussian blue–stained sections and selected ROIs containing a necrotic core with IPH but no Fe3+ deposits; Fe3+ deposits (chronic hemorrhage) without IPH; calcification; and a necrotic core with neither IPH nor Fe3+ deposits. Then 2 radiologists (M.A., T.H.) consensually drew ROIs on QSM images that matched the histologic sections. The susceptibility values in the ROIs were determined using ImageJ (National Institutes of Health, Bethesda, Maryland). Exclusion criteria were the same as those in the qualitative evaluation.
On MPRAGE images, 2 radiologists (M.A., T.H.) also put ROIs in the areas corresponding to the same histologic components and adjacent background with the 2% agarose gel. The signal intensities of the ROIs on MPRAGE were determined using ImageJ. The contrast ratio (CR) of each plaque component was calculated by dividing the signal intensity of each component by the background signal intensity.
Correlation between Intraplaque Erythrocytes and Iron Deposits and the Susceptibility Value on QSM Images
The extent of erythrocyte/iron deposits on histologic sections was correlated with the mean susceptibility value (SV) of the whole plaque on QSM images. One pathologist (K.M.) first manually traced whole plaque on histologic sections. Areas positive for GYPA (erythrocyte component) or Fe3+ staining (iron deposits) were quantified using Win-ROOF Color Image Analysis Software (Mitani, Fukui, Japan) (Fig 4A, -B). To quantify the degree of hemorrhage/iron deposition in carotid plaques on histopathologic sections, the software calculated the percentage of the area with GYPA- or Fe3+-positive relative to the whole plaque in each section. Then, QSM images matching the histologic sections were selected and consensually segmented by 2 radiologists (M.A., T.H.), and the SV in the ROIs was determined using ImageJ (Fig 4C).

Correlative analysis of erythrocytes and iron deposits on histologic sections from a 73-year-old man (A–D) and the SV on the QSM image of whole plaque (E). Areas positive for GYPA staining (A) and color extraction (B) were relatively well-correlated with the distribution of hyperintensity on the QSM image (E). There are a few small areas positive for Prussian blue staining (C) and color extraction (D). Positively stained areas were extracted under specific protocols using the hue of the color and its lightness and saturation. Data are expressed as the ratio (percentage) of extracted green areas relative to the whole plaque (dashed outline in B and D). The ROI on the QSM image (yellow outline, E) is matched with the histologic ROI for measuring the mean SV of the whole plaque.
Statistical Analysis
GraphPad Prism 5 (GraphPad Software, San Diego, California) was used for drawing graphs and statistical analysis. We used the Fisher exact test for contingency table analysis to compare the incidence of identical histologic findings in hyper- and hypointense areas on QSM images. To compare the mean SV and mean CR among the pathology components, we used 1-way ANOVA and the Scheffe test. The relationship between the degree of erythrocyte/iron deposition on histologic sections and the mean susceptibility values on QSM images was analyzed with the Spearman correlation test.
RESULTS
Comparison of Histologic and QSM Findings
As shown in the Table, histology was compared with 26 hyper- and 9 hypointense areas on QSM images. Of the 26 hyperintense areas, 19 (73%) manifested IPH and 20 (77%) contained Fe3+ deposits (Figs 2A–C and 3). Of these areas, 14 featured both IPH and Fe3+ deposits; 5 showed only IPH; and 6, only Fe3+ deposits. Immunohistochemistry for GYPA highlighted the presence of intact and fragmented erythrocytes (Fig 2B). Of the 9 hypointense areas on QSM images, all exhibited a fibrous matrix, and 8 (89%) had calcifications (Fig 2A, -C). All 8 hypointense areas with calcification had large, platelike calcifications, while 6 of 7 hyperintense areas with calcification had dotlike calcifications that were smaller than the voxel size of QSM images. The incidence of calcifications and fibrous matrices was significantly higher in hypo- than in hyperintense areas (P < .05); no hypointense areas contained IPH or Fe3+ deposits. With respect to dense inflammatory infiltrates and necrotic cores without intraplaque hemorrhage, there was no significant difference in the incidence of the components between hyper- and hypointense areas.
Comparison of histologically identified plaque components in hyper- and hypointense areas on QSM imagesa
For quantitative analysis, we assessed 5 typical atherosclerotic necrotic cores with IPH but no Fe3+ deposits, 7 cores with Fe3+ deposits but no IPH, 7 cores with neither IPH nor Fe3+ deposits, and 10 cores with calcification. The mean SV in foci of the necrotic core with IPH was 188 ± 51 parts per billion (ppb), it was 129 ± 49 ppb in cores with Fe3+ deposits without IPH, −11 ± 17 ppb in cores without IPH or Fe3+ deposits, and −158 ± 78 ppb in cores with calcification (Fig 5A). The mean SV in foci of necrotic cores with IPH and in cores with Fe3+ deposits but no IPH was significantly larger than but did not overlap with the SV of necrotic cores without either IPH or Fe3+ deposits or with the SV of cores with calcifications (P < .01). There was no significant difference in the mean SV of necrotic cores with IPH and necrotic cores with Fe3+ deposits without IPH.
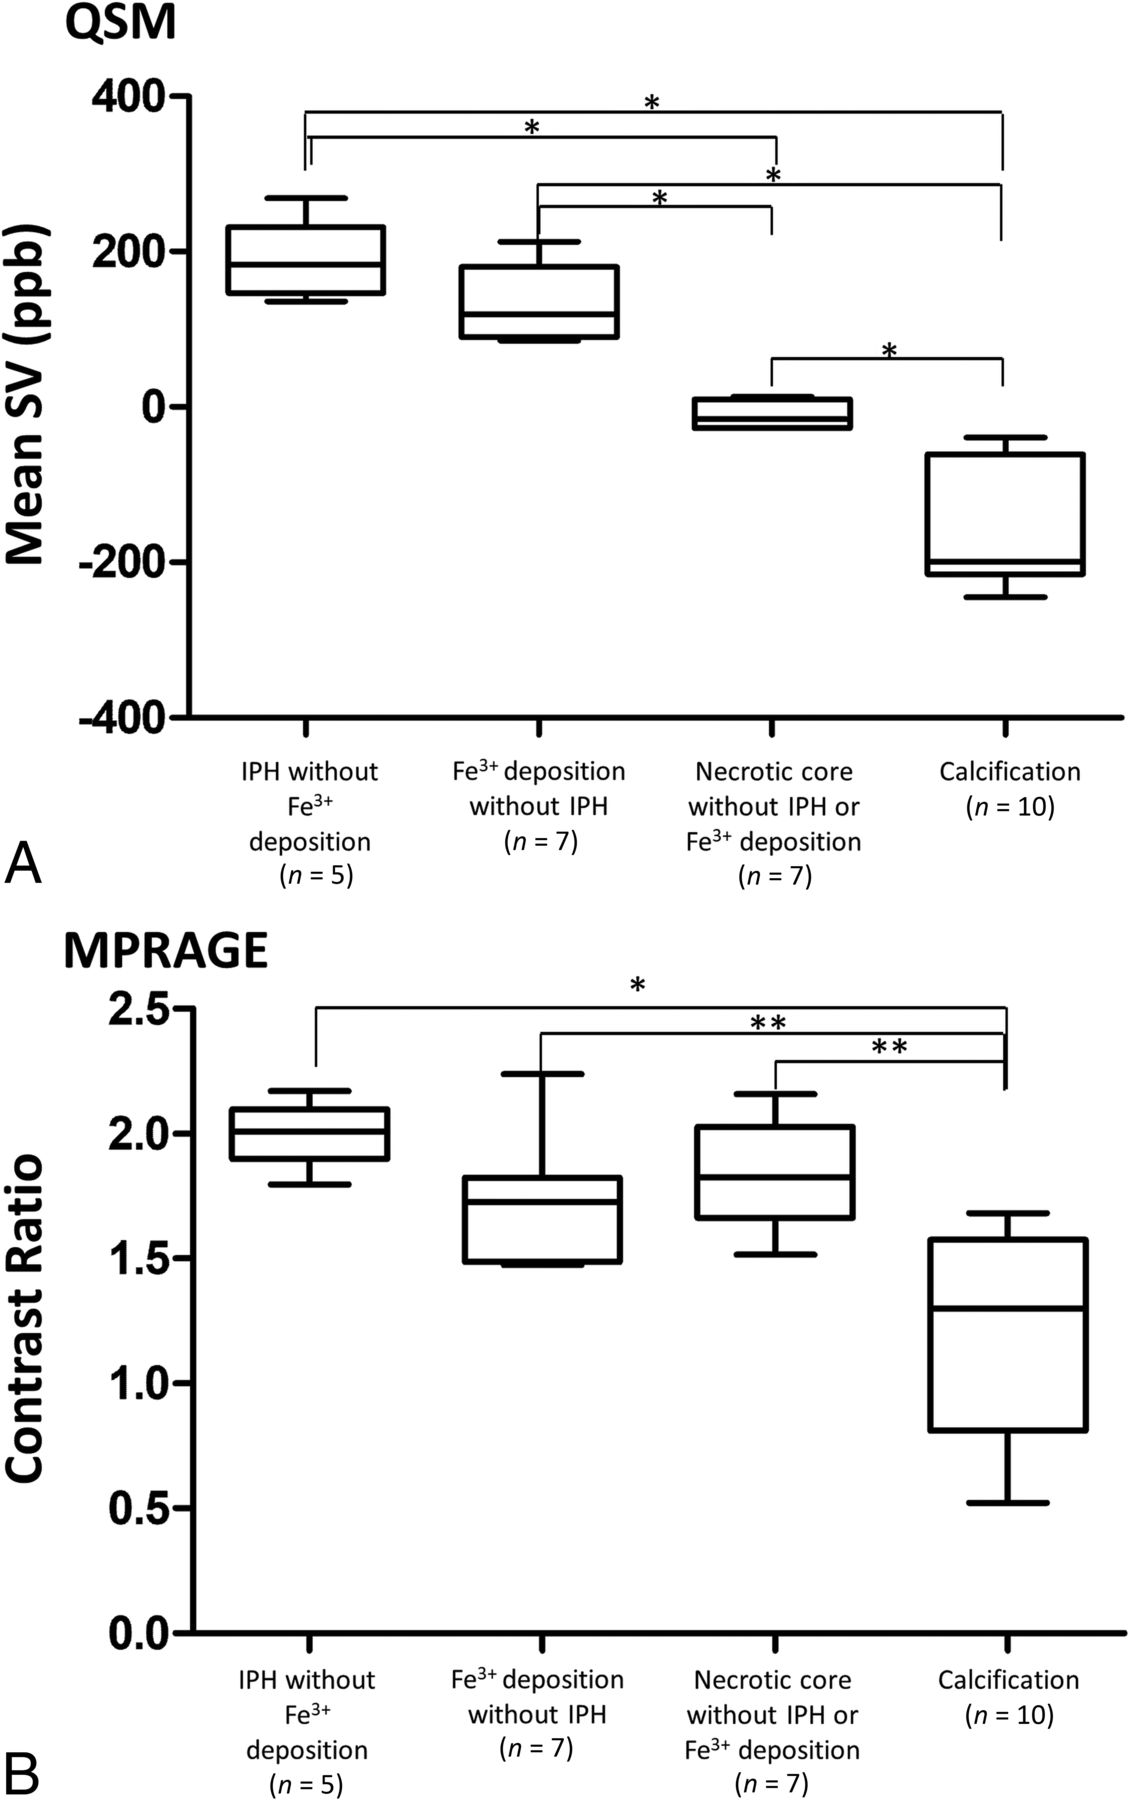
Comparison of the mean SV on QSM images (A) and the CR on MPRAGE images (B) among 4 typical atherosclerotic components. Analysis was with 1-way ANOVA with the Scheffe test (asterisk, P < .001; double asterisks, P < .01).
The summary of the mean CR of each component on MPRAGE images is shown in Fig 5B. There were no significant differences in the mean CR among necrotic cores with IPH but no Fe3+ deposits, necrotic cores with Fe3+ deposits but no IPH, and necrotic cores with neither IPH nor Fe3+ deposits. The mean CR was significantly lower for calcification than the other 3 components (P < .05).
Correlation between the Degree of Erythrocyte/Iron Deposition and Its Susceptibility on QSM Images
The relationship between erythrocytes and iron deposits observed on histologic sections and the mean SV of a whole plaque region on QSM images is shown in Fig 6. There was a moderately positive correlation in GYPA-positive areas (r = 0.65, n = 34, P < .001) (Fig 6A) and a weak positive correlation with areas positive for Fe3+ (r = 0.47, n = 34, P < .01) (Fig 6B). Fe3+-positive areas tended to be much smaller than areas positive for GYPA. Some areas with a relatively high mean SV were observed at nearly zero areas positive for Fe3+ (Fig 6B). There was no significant correlation between Prussian blue–stained areas and GYPA-positive areas (r = 0.28, n = 34, P = .1) (Fig 6C).

Relationship between the mean magnetic SV and areas positive for GYPA (A, erythrocytes) or Fe3+ (B). Relationship between Prussian blue–stained areas and GYPA-positive areas (C).
DISCUSSION
For characterization of carotid plaques, qualitative analysis showed IPH and Fe3+ deposits in hyper- but not in hypointense areas on QSM images. The incidence of calcification and fibrous matrix deposits was higher in hypo- than in hyperintense areas. All calcified foci with hypointensity on QSM had large platelike calcifications with diamagnetic properties. Although calcifications were also observed in hyperintense areas, they tended to be smaller than the voxel size of the QSM images. This finding suggests that paramagnetic hemoglobin or hemosiderin or both exert stronger effects than diamagnetic calcifications. Quantitative analysis showed that the mean SV was significantly higher for cores with IPH or Fe3+ deposits than cores without either IPH or Fe3+ deposits and cores with calcifications. The SV for necrotic cores with IPH and for cores with Fe3+ deposits did not overlap the SV of necrotic cores without either IPH or Fe3+ deposits or the SV of cores with calcifications. Our findings indicate that the qualitative and quantitative assessment of carotid plaques on QSM images may help facilitate the identification of their composition.
Although QSM and gradient echo phase imaging have been reported to be useful for the differentiation of intracranial calcifications and hemorrhage,23⇓⇓-26 QSM may be superior. We document that QSM also distinguishes between hemorrhage and calcification in carotid artery plaques. The inferiority of gradient echo phase imaging to QSM can be explained by the underlying physics: the phase is determined by the product of the TE and the magnetic field, which is a nonlocal parameter or a convolution of all surrounding tissue magnetic susceptibility sources. Imaging parameters, including TE, field strength, object orientation, and object size, can change the appearance of gradient recalled-echo phase images.27,28 The high-pass filtering that is commonly used in susceptibility-weighted imaging, makes the phase image noisy and difficult to interpret.
In the mean CR on MPRAGE images, there were no significant differences among necrotic cores with IPH but no Fe3+ deposits, cores with Fe3+ deposits without IPH, and necrotic cores with neither IPH nor Fe3+ deposits. Formalin fixation shortens the relaxation time of tissues with time.29,30 In the current ex vivo study, all plaque components except calcification could not be differentiated on MPRAGE images. The relaxation times of plaque tissues on MPRAGE images seemed to be shortened. This effect must have affected the results on MPRAGE images.
In our study, the SV of IPH in the carotid artery detected on QSM images is 201 ± 115 ppb. This value overlaps the lower end of the SV range of cerebral cavernous malformations (125–750 ppb)31 and is much lower than the SV range of intracranial hemorrhage (ICH, 570–1380 ppb) in the hyperacute-to-chronic stage.18,32 This difference may be explained by differences in the microenvironment of the brain parenchyma and the carotid artery wall.
The susceptibility for intracranial hemorrhage depends on the magnetic status of hemoglobin iron in degraded erythrocytes; it varies greatly with the hemorrhage size and stage.18,24,33 ICH occurs when a massive number of erythrocytes rapidly burst out of an artery. The fast degradation of these cells results in a high SV due to the presence of deoxyhemoglobin in hyperacute hematomas and of methemoglobin during erythrocyte lysing.18 The influx of macrophages results in iron phagocytosis and either iron clearing from degraded erythrocytes in the late subacute stage or in iron storage in hemosiderin the chronic ICH stage.18 The former event results in a susceptibility reduction, while the latter increases susceptibility due to the formation of a superparamagnetic domain. Cerebral cavernous malformations are characterized by slow, small hemorrhages at the capillary level; consequently, SV increases more slowly and remains lower than in the presence of ICH.34 Bleeding in the necrotic core of carotid plaques may be even less and slower than in cerebral cavernous malformations, and it may be recurrent due to disruption of the vasa vasorum35 and plaque fissure/rupture.36 IPH and Fe3+ deposits (ie, hemosiderin) tended to coexist in hyperintense areas on our QSM images. Because the presence of hemosiderin is indicative of chronic hemorrhage, hyperintense areas in carotid plaques may reflect different hemorrhagic stages. IPH can contribute to the progression of atheroma via the deposition of free cholesterol derived from the erythrocyte membrane,22 and it may change the macrophage phenotype in advanced atherosclerotic lesions. Hyperintense areas on QSM images may be associated with atheroma progression.
The quantification of erythrocytes and Fe3+ deposits in whole plaques showed that the mean susceptibility values were positively correlated with GYPA- and Fe3+-positive areas. However, the Fe3+-positive areas were much smaller than the GYPA-positive areas. This difference may be attributable to differences in the size and abundance of erythrocytes compared with hemosiderin, an aggregate of ferritin protein, and also may lead to a weak correlation between Fe3+-positive areas and SVs. Even small amounts of iron affected the mean SV on QSM images, probably due to the superparamagnetic susceptibility of hemosiderin, in which iron forms a magnetic domain.33 In addition, there was no significant difference in the mean SV between cores with IPH but no iron deposits and cores with iron deposits but no IPH. These results support high susceptibility on QSM images, reflecting both hemoglobin content and hemosiderin deposition. On the basis of our findings, we think that carotid plaque components with positive susceptibility on QSM images reflect erythrocyte and/or iron deposits at different hemorrhage stages (ie, deoxyhemoglobin, methemoglobin, and hemosiderin). Quantification of changes in the IPH volume in asymptomatic individuals may help to identify new risk factors for the development and progression of IPH and may yield further clues for the prevention of cerebrovascular events.37 Because the mean SV of whole plaques was correlated with the degree of IPH, quantification of the IPH volume on QSM images may be useful for assessing the initial IPH volume and subsequent changes.
Our study has some limitations. It did not include in vivo images, and our sample size was relatively small. Although imaging of in vivo QSM for the extracranial carotid artery seems to be challenging, an in vivo QSM study of carotid plaques was recently reported.38 Future studies using in vivo carotid QSM are needed to clarify the usefulness of the in vivo imaging. Evia et al39 showed the strong linear correlation in susceptibility on QSM between in vivo and ex vivo brain tissues. Therefore, our results may be valuable for translation of ex vivo QSM findings to in vivo ones.
We did not perform an in vivo comparison of MPRAGE with QSM. This is also needed to clarify whether the image quality of QSM is similar to that of MPRAGE for clinical use and to evaluate whether QSM is more useful for characterization of plaque components than MPRAGE. The time from fixation of samples to MR imaging was relatively long; the mean time was 36 days. Evia et al39 reported that susceptibility in gray and white matter measured ex vivo with QSM does not change in the first 6 weeks after death and fixation. Therefore, the effect of the time from fixation to MR imaging may have been small. Last, the sections visualized on our QSM images are not completely comparable with the histology sections because the section thickness was 1 mm on QSM and 3 μm on histologic images. Therefore, the histologic images may reflect only a part of the QSM images.
CONCLUSIONS
Our ex vivo study suggests that QSM can be used to help characterize the composition of carotid plaque (ie, IPH, Fe3+ deposition, necrotic core, and calcification). It may facilitate the quantification of erythrocytes and Fe3+ deposits in plaques and differentiate these deposits from necrotic cores and calcification.
Footnotes
M. Azuma and K. Maekawa contributed equally to this work.
This work was supported, in part, by the National Institutes of Health (R01NS105144).
Disclosures: Kazunari Maekawa—UNRELATED: Employment: university salary. Yi Wang—RELATED: Grant: National Institutes of Health, Comments: R01NS105144*; UNRELATED: Employment: Cornell University; Stock/Stock Options: Medimagemetric LLC, Comments: a Cornell spin-off company. *Money paid to the institution.
Indicates open access to non-subscribers at www.ajnr.org
References
- Received August 15, 2019.
- Accepted after revision November 14, 2019.
- © 2019 by American Journal of Neuroradiology


Jump to section
Related Articles
Cited By...
- Diagnostic Accuracy of Preoperative Quantitative Susceptibility Mapping for Detecting Histologic Intraplaque Hemorrhage in Cervical ICA Stenosis in Patients Undergoing Carotid Endarterectomy
- Microstructural and mechanical insight into atherosclerotic plaques- an ex vivo DTI study to better assess plaque vulnerability
- Quantitative susceptibility mapping of carotid arterial tissue ex vivo: assessing sensitivity to vessel microstructural composition