
Abstract
BACKGROUND AND PURPOSE: Surface anatomy scanning (SAS) is an established technique for demonstrating the brain's surface. We describe our experience in applying SAS with superposition of MR venograms to preoperative scalp incision planning.
METHODS: In 16 patients, scalp incision planning was done by placing a water-filled plastic tube at the intended incision site when we performed SAS using half-Fourier single-shot fast spin-echo sequences. Two-dimensional phase-contrast MR angiograms were obtained to demonstrate the cortical veins and then superimposed upon the SAS images. The added images were compared with surgical findings using a four-point grading scale (0 to 3, poor to excellent).
RESULTS: In each case, neurosurgeons could easily reach the lesion. Surgical findings correlated well with MR angiogram–added SAS images, with an average score of 2.56.
CONCLUSION: Our simple technique is a useful means of preoperatively determining brain surface anatomy and can be used to plan a scalp incision site.
Surface anatomy scanning (SAS) of the brain was originally introduced by Katada et al (1, 2) to reveal brain surface structures. This technique is useful for locating cortical or subcortical lesions. The original technique involved thick-section (5- to 8-cm) T2-weighted MR imaging using conventional spin-echo (SE) sequences with gray-scale reversal in postprocessing. It has been reported that half-Fourier single-shot fast SE sequences provide excellent SAS images in a very short scanning time (3). Ogura et al (4) and Tsuchiya et al (5) added an MR angiogram to an SAS image, which resulted in the depiction of gyri, sulci, and cortical veins on one image. By using a surface marker demonstrable on SAS images, we applied the MR angiogram–added SAS method using half-Fourier sequences to scalp incision planning. We hypothesized that such a technique would be useful for determining the position of a craniotomy as well as for avoiding damage to cortical veins. Although stereotactic techniques are also available, we applied this method because of its simplicity and excellent display of cortical structures. We present our experience with this technique in 16 patients and discuss its value.
Methods
Our patient group consisted of 16 patients (nine men and seven women ranging in age from 28 to 71 years) with superficially located intracranial lesions. There were seven patients with glioma, six with meningioma, two with cavernous hemangioma, and one with cerebral metastases.
We used a 0.5-T unit (Flexart, Toshiba, Tokyo, Japan; eight patients) or a 1.5-T unit (Magnetom Vision, Siemens, Erlangen, Germany; eight patients). Our procedure, which was performed preoperatively on a different occasion from conventional MR imaging, is divided into five steps, as described below.
First, we obtained SAS images with half-Fourier single-shot fast SE sequences. Scanning parameters for the SAS images were as follows: TE, 250 or 480/87 (0.5 T/1.5 T); echo spacing, 12.5 to 15/11; echo train length, 116 or 128/140; imaging matrix, 192 × 256/240 × 256; field of view, 20 × 20/20–22 × 20–22 cm; excitations, 1–4/1; section thickness, 40–55/20 mm; and scanning time, 2–40/2 seconds. When SAS was performed, we placed a circular (n = 8) or a lattice (n = 8) water-filled plastic tube at the expected site of scalp incision. The tube was attached to the patient's shaved head using an adhesive plaster. When the plastic tube did not cover a lesion, we judged that the tube was not properly positioned, corrected its position, and confirmed the new position on repeated SAS images.
Second, we obtained 2D phase-contrast (PC) MR angiograms in the same section and field of view as for the SAS images. Scanning parameters for MR angiography were as follows: TR, 30 or 50/93 or 104 (0.5 T/1.5 T); TE, 16/11 or 14; flip angle, 20°/10° or 12°; excitations, 5 or 8/4 or 5; imaging matrix, 192 × 256/192 × 256; and scanning time, 3 minutes 5 seconds to 5 minutes 8 seconds/1 minute 13 seconds to 1 minute 42 seconds. On both imagers, velocity encoding (VENC) was set at 5 cm/s in three directions aimed at demonstrating the cortical veins and dural sinuses. The imaging plane, which was selected according to the location of the lesion, was sagittal in eight patients and axial in the other eight.
Third, we added the SAS images and MR venograms using manufacturer's standard system software incorporated in the imagers (Fig 1). The total time required to obtain an added image was less than 10 minutes on both units.

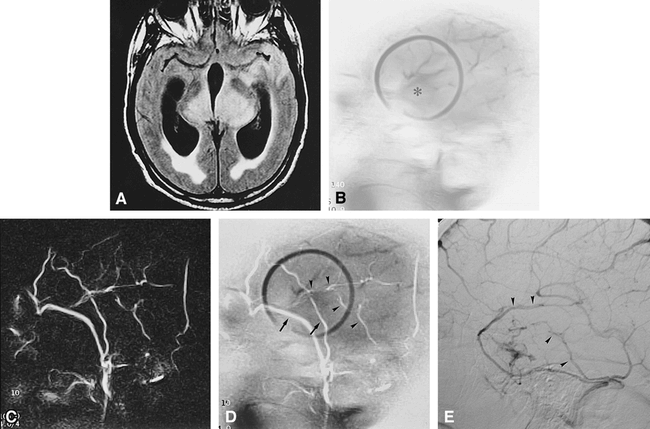
52-year-old man with gliomatosis cerebri (anaplastic astrocytoma at biopsy).
A, Fluid-attenuated inversion-recovery MR image (6000/119/1 [TR/TE/excitations]; inversion time, 2060) shows hyperintense masses in both thalami and the left temporal lobe.
B, SAS image by half-Fourier single-shot fast SE sequence (87/1, TE/excitations) shows a hypointense mass in the left temporal lobe (asterisk) within a surface marker (circle).
C, Two-dimensional phase-contrast MR angiogram (104/14/1; VENC, 5 cm/s) obtained in the same section as B shows cortical veins.
D, MR angiogram–added SAS image clearly shows the lesion, sulci, gyri, and veins (arrows indicate scalp vessels; arrowheads, sylvian and inferior temporal veins).
E, Left internal carotid angiogram (venous phase) shows corresponding veins, including sylvian and inferior temporal veins (arrowheads).
Fourth, we marked the position of the plastic tube on the scalp using methylrosaniline chloride, Lugol's solution, or oily ink.
Fifth, scalp incision and craniotomy were then performed accordingly.
As an initial evaluation of our technique, neurosurgeons were requested to report whether a lesion was easily found in the surgical field. Next, for the assessment of correlation of MR angiogram–added SAS and surgical findings, results were graded as follows: 3 = excellent, 2 = good, 1 = fair, and 0 = poor. Grade 3 was scored when operative brain surface structures, including cortical veins, coincided with SAS images and the lesion was found in the expected position. Grade 2 was scored when, although the relationship between the brain surface and the lesion correlated, depiction of brain surface structures on SAS images was incomplete. Grade 1 was scored when neurosurgeons did not find complete concordance between an SAS image and surgical findings with regard to lesion location. Grade 0 was used when findings on SAS images and at surgery did not coincide at all.
Results
Neurosurgeons reported that the lesion was found and reached easily in each patient. Regarding the correspondence of MR angiogram–added SAS findings with surgical findings, the results for 10 lesions were scored grade 3 (Fig 2), five were grade 2, and one was grade 1. No results were scored grade 0. Accordingly, the average score for the 16 lesions was 2.56. No complications ensued from damage to cortical veins or dural sinuses.
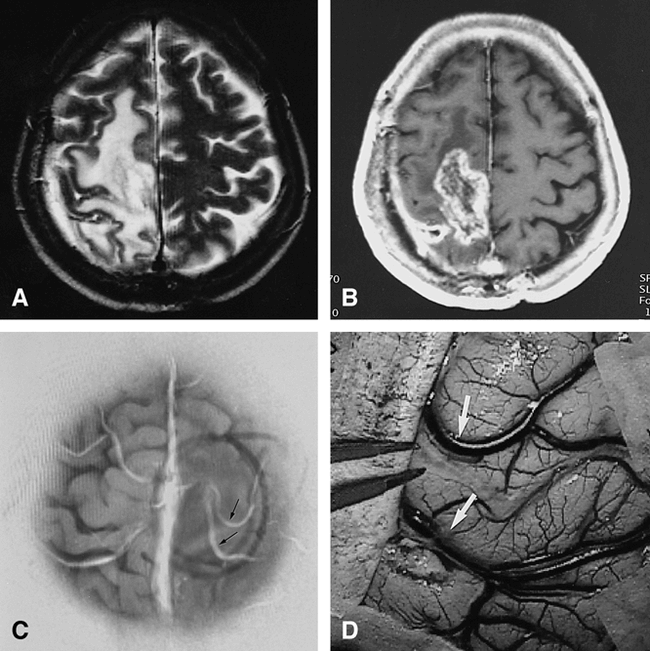
59-year-old woman with postoperative recurrence of right frontoparietal anaplastic astrocytoma.
A, T2-weighted MR image (4000/90/1) shows a hyperintense mass.
B, Postcontrast T1-weighted image (500/14/2) shows moderate enhancement of the mass.
C, MR angiogram–added SAS image shows the lesion, sulci, gyri, and cortical veins (arrows). This image is displayed as viewed from above.
D, Photograph obtained at craniotomy shows the corresponding veins (arrows).
Discussion
The clinical usefulness of the original SAS technique has been discussed in detail by Katada et al (1, 2) and Sumida et al (6). SAS is useful for demonstrating the relationship of cortical and subcortical lesions to neighboring gyri and sulci, and it effectively depicts abnormal gyral patterns. In the present study, we used this technique not only for visualization of lesions but also for direct surgical support. At craniotomy and especially corticotomy, cortical veins are important landmarks. Therefore, it is of great help for neurosurgeons to preoperatively obtain images on which lesions, gyri/sulci, and cortical veins are visible so that they can approach a lesion accurately and avoid damaging cortical veins. Cortical veins are generally depicted as flow voids on SAS images obtained by either conventional T2-weighted sequences or half-Fourier single-shot fast SE sequences, but, in our experience, their contrast with CSF or brain surface is inadequate for direct visualization. Previous reports have shown that this problem can be overcome by superimposing MR angiograms on SAS images (4, 5, 7). A technique similar to ours has been proposed by Imai et al (8). In common with their technique, our method involves placing a water-filled plastic tube on the patient's scalp. However, the techniques differ in two ways. First, for SAS, we used half-Fourier single-shot fast SE sequences instead of steady-state free precession sequences. Second, for MR angiography, we used 2D-PC techniques instead of postcontrast 2D time-of-flight sequences. As a result, our procedure took less than 7 minutes, whereas the total scanning time reported by Imai et al (8) was 7 to 14 minutes. It is noteworthy that we could confirm or correct the position of a surface marker promptly, because we obtained SAS images within 1 minute. Additionally, our choice of 2D-PC MR angiography obviated contrast material injection. Furthermore, 2D-PC techniques made it possible to acquire MR angiograms of any section setting, which was not addressed by Imai et al (8).
Our technique has several limitations. We believe that PC MR angiography with a low VENC setting is effective for depicting large cortical veins; however, in our experience, small veins could not be seen clearly. This may in part be due to an improper VENC setting, which could be adjusted, but there is room for improvement in MR angiography of veins. It may be appropriate to use a longer scanning time or contrast material in order to obtain MR angiograms of sufficient quality to illustrate fine cortical veins. One should be aware that whichever technique of SAS or MR angiography is applied, contrast between sulci and gyri could be poor if mass effect is strong and there is little CSF within the sulci. This is the main reason for five lesions receiving a grade 2 score. Similarly, in such cases, cortical veins might also be insufficiently depicted because of decreased flow. In addition, if imaging is performed at a different angle from that of the surgical view, discrepancies with regard to the anatomic relationship of the lesion to gyri/sulci and cortical veins could result between the MR image and intraoperative findings. This discrepancy was the reason for the one grade 1 score in our study. Therefore, care should be taken to perform imaging at an angle close to the surgical view. It is also important not to mistake scalp veins for cortical veins, which are frequently depicted similarly (Fig 1).
The volume-rendering method is another approach for obtaining surface images of the brain with or without delineation of the venous system (9). In comparison with such a technique, we believe that our method is more practical for two reasons. One is its simplicity. Because it does not require a workstation or software to generate 3D images, our method can be carried out by using sequences and postprocessing functions that are available on most scanners. Second, although images obtained by volume rendering may be superior in depicting cortical structures three-dimensionally, they are not necessarily suited for preoperative scalp incision planning.
Conclusion
We have applied MR angiogram–added SAS imaging to preoperative scalp incision planning. We found the use of 2D-PC MR angiography and half-Fourier single-shot fast SE sequences to be effective in performing this procedure. Our experience in 16 patients revealed that the technique can be useful in preoperatively demonstrating brain surface anatomy and in planning a scalp incision site.
Footnotes
- Received August 7, 1998.
- Copyright © American Society of Neuroradiology


