
Abstract
BACKGROUND AND PURPOSE: Significant advances have been made in understanding the origin of brain manifestations associated with tuberous sclerosis complex (TSC), most recently the idea that cortical tubers and subependymal nodules are a disorder of neocortical formation. The present study was designed to test the hypothesis that MR proton spectra of cortical tubers are abnormal because of the developmental immaturity of the tubers' neurons and glia.
METHODS: Twenty-six adults with TSC were studied. Proton spectroscopy was performed with a single-voxel point-resolved spectroscopy technique in two 8-mL regions: one over a cortical tuber and the other over a corresponding anatomic area of normal-appearing brain in the contralateral cerebral hemisphere. The results were expressed in terms of the ratio of the area under the three prominent resonances of choline (Cho), creatine + phosphocreatine (Cr), and N-acetyl groups (NA).
RESULTS: Cortical tubers showed statistically significantly lower NA/Cr (1.54 ± 0.24 vs. 1.72 ± 0.23), NA/(Cho+Cr) (0.80 ± 0.14 vs. 0.91 ± 0.12), and NA/Cho (1.69 ± 0.36 vs. 1.97 ± 0.38) than did normal-appearing brain. No statistically significant difference was found in the Cho/Cr ratios between the tubers and the contralateral brain (0.93 ± 0.15 vs. 0.90 ± 0.12). No lactate was identified in any cortical tubers.
CONCLUSION: Proton spectroscopy can show differences between cortical tubers and normal-appearing white matter in patients with TSC. The reduced NA/Cr ratio is probably due to reduced levels of NA, most likely caused by the presence of immature neurons and glia in tubers that do not express NA, or by the presence of gliosis, a known histologic component of tubers.
Cortical tubers are one of the standard intracranial hallmarks of tuberous sclerosis complex (TSC) along with subependymal nodules and giant cell astrocytoma (1). It is likely that cortical tubers and subependymal nodules are the result of abnormal neocortical formation, and they have recently been classified as such by Barkovich et al (2). The primary abnormality appears to be in the formation of neurons and glia within the germinal matrix, which results in abnormal migration and organization of the neocortex. Transformation to giant cell astrocytoma has been reported in 33% of subependymal nodules situated at the foramen of Monro; however, malignant change has rarely been demonstrated in cortical tubers (3).
Cortical tubers are detected at MR imaging in 95% to 100% of patients with TSC, and their radiologic appearance on MR studies has been well described (4–8). Proton MR spectroscopy has been used to study the pathophysiological mechanisms involved in a wide range of brain disorders. Three prominent, normal spectral resonances can be detected by long-TE methods: choline (Cho), creatine + phosphocreatine (Cr), and N-acetyl groups (NA). The latter are regarded as putative markers of neuronal integrity or function. In this context, proton spectroscopy provides evidence of neuronal involvement in cortical tubers. In contrast, Cho-containing compounds are usually elevated in brain neoplasms, and proton spectroscopy may be a valuable tool in the few atypical pediatric cases in which distinction between tuber and neoplasm is difficult on imaging studies.
The purpose of this study was to determine the spectroscopic features of tubers and normal-appearing white matter in patients with TSC. We predicted the presence of spectroscopic differences between tubers and white matter, manifested as reduced NA ratios, because of neuronal and glia immaturity and normal Cho levels in the absence of a malignant process.
Methods
Twenty-six adults with mild indications of TSC were recruited prospectively into this study with the help of the Tuberous Sclerosis Association of Great Britain, of which they were all members. All subjects had TSC diagnosed by standard clinical means, and all had well-controlled or no seizures, no symptoms or signs of raised intracranial pressure, and no signs of neurologic or intellectual impairment. All the subjects were imaged on a superconducting 1.5-T MR system after giving informed consent under the guidance of our local ethics committee.
Proton spectroscopy was performed with a single-voxel point-resolved spectroscopy technique with a TR of 1600, a TE of 135, and 256 averages (total acquisition time, 7 minutes 40 seconds). Standard T1- and T2-weighted MR sequences were performed in multiple planes. Two spectra were obtained from each subject by using an 8-mL cubic volume of interest. The placing of the regions of interest were determined by a neuroradiologist, who was present at the time of imaging. To minimize the percentage of the spectroscopic volume occupied by normal tissue, we selected the largest supratentorial tuber that did not involve the skull or large volumes of CSF. Note that, owing to the nature of the disease under study, complete filling of the spectroscopic volume by tuber (defined on imaging) was not possible in the majority of cases and, as with a large number of spectroscopic studies, partial volume effects were present. In the context of the present study, spectroscopic differences between tuber and normal-appearing contralateral parenchyma will have been underestimated as a result of this confounding variable.
The normal white matter voxel was placed in the opposite hemisphere, as close as possible to the same anatomic region as the tuber voxel that did not show any signal intensity abnormalities on MR images.
Automated shimming was performed on the voxel of interest before water suppression to minimize spectral linewidth. After shimming, the amplitude of the water suppression pulse was determined manually in an iterative fashion. A total of 1024 data points were sampled and averaged 256 times. A reference water spectrum (suppression pulse set to zero) was obtained automatically after the water-suppressed data were acquired.
MR spectra were analyzed and reviewed by an MR physicist with extensive experience using proton spectroscopy in neurologic diseases. All postacquisition processing was performed using fully integrated proprietary software from the manufacturer of the MR system. All spectra were deemed to be of good quality. An automated procure interpolated the time-domain signal to 16,384 points, averaged the data, filtered by a 4-Hz gaussian function, transformed the data from the Fourier domain, and applied a constant linear phase offset to yield a spectrum. A Lorenz-gaussian function (weighted to 15%/85%) was fitted to the spectrum and centered at three chemical shifts, representing Cho (at 3.22 ppm), Cr (at 3.02 ppm), and NA (at 2.02 ppm). Spectroscopic results are expressed as the ratios under the three primary peaks: NA/Cho, NA/Cr, Cho/Cr, and NA/(Cho+Cr). Statistical analysis was performed with a paired, two-tailed Student's t test.
Spectroscopic data were analyzed with the manufacturer's spectroscopy software package. The three prominent resonances representing NA, Cho, and Cr were identified using an automated peak recognition algorithm. Lorenz-gaussian curve fitting was performed, and the areas under the curves were calculated.
The NA/Cr, NA/(Cho+Cr), NA/Cho, and Cho/Cr ratios were calculated. Statistical analysis with a paired, two-tailed Student's t test was performed.
Results
The group consisted of nine men and 17 women with a mean age of 37 years (interquartile range, 32 to 42 years). All subjects with TSC had cortical tubers on MR images; therefore, a total of 26 cortical tubers and 26 regions of normal-appearing brain were investigated by spectroscopy. Ten (38%) of the tubers studied were situated in the frontal lobes, nine (35%) in the parietal lobes, five (19%) in the occipital lobes, and two (8%) in the temporal lobes. None of these had MR evidence of calcification, as established by the absence of susceptibility signal intensity change on the gradient-echo T2*-weighted images. All spectroscopic examinations were of good quality.
Analysis of the pooled data revealed a significantly lower mean NA/Cr ratio in cortical tubers as compared with normal-appearing brain (NA/Cr ratio, 1.54 ± 0.24 vs. 1.72 ± 0.23; P < .01) (Fig 1A). A statistically significant reduction in the mean cortical tuber NA/(Cho+Cr) ratio relative to normal-appearing brain was also observed (0.80 ± 0.14 vs. 0.91 ± 0.12; P < .01) (Fig 1B).

A–D, Comparisons of mean NA/Cr (A), NA/(Cho+Cr) (B), NA/Cho (C), and Cho/Cr (D) ratios in cortical tubers and contralateral normal-appearing brain. The inferior and superior margins of each box represent the first and third quartiles, the central line is the mean, and the bars at either end represent the standard deviations
The mean NA/Cho ratio was significantly lower in cortical tubers than in normal-appearing brain (1.69 ± 0.36 vs. 1.97 ± 0.38; P < .01) (Fig 1C). No significant difference was noted in the mean Cho/Cr ratios in the cortical tubers and normal-appearing brain (0.93 ± 0.15 vs. 0.90 ± 0.12; P > .10) (Fig 1D).
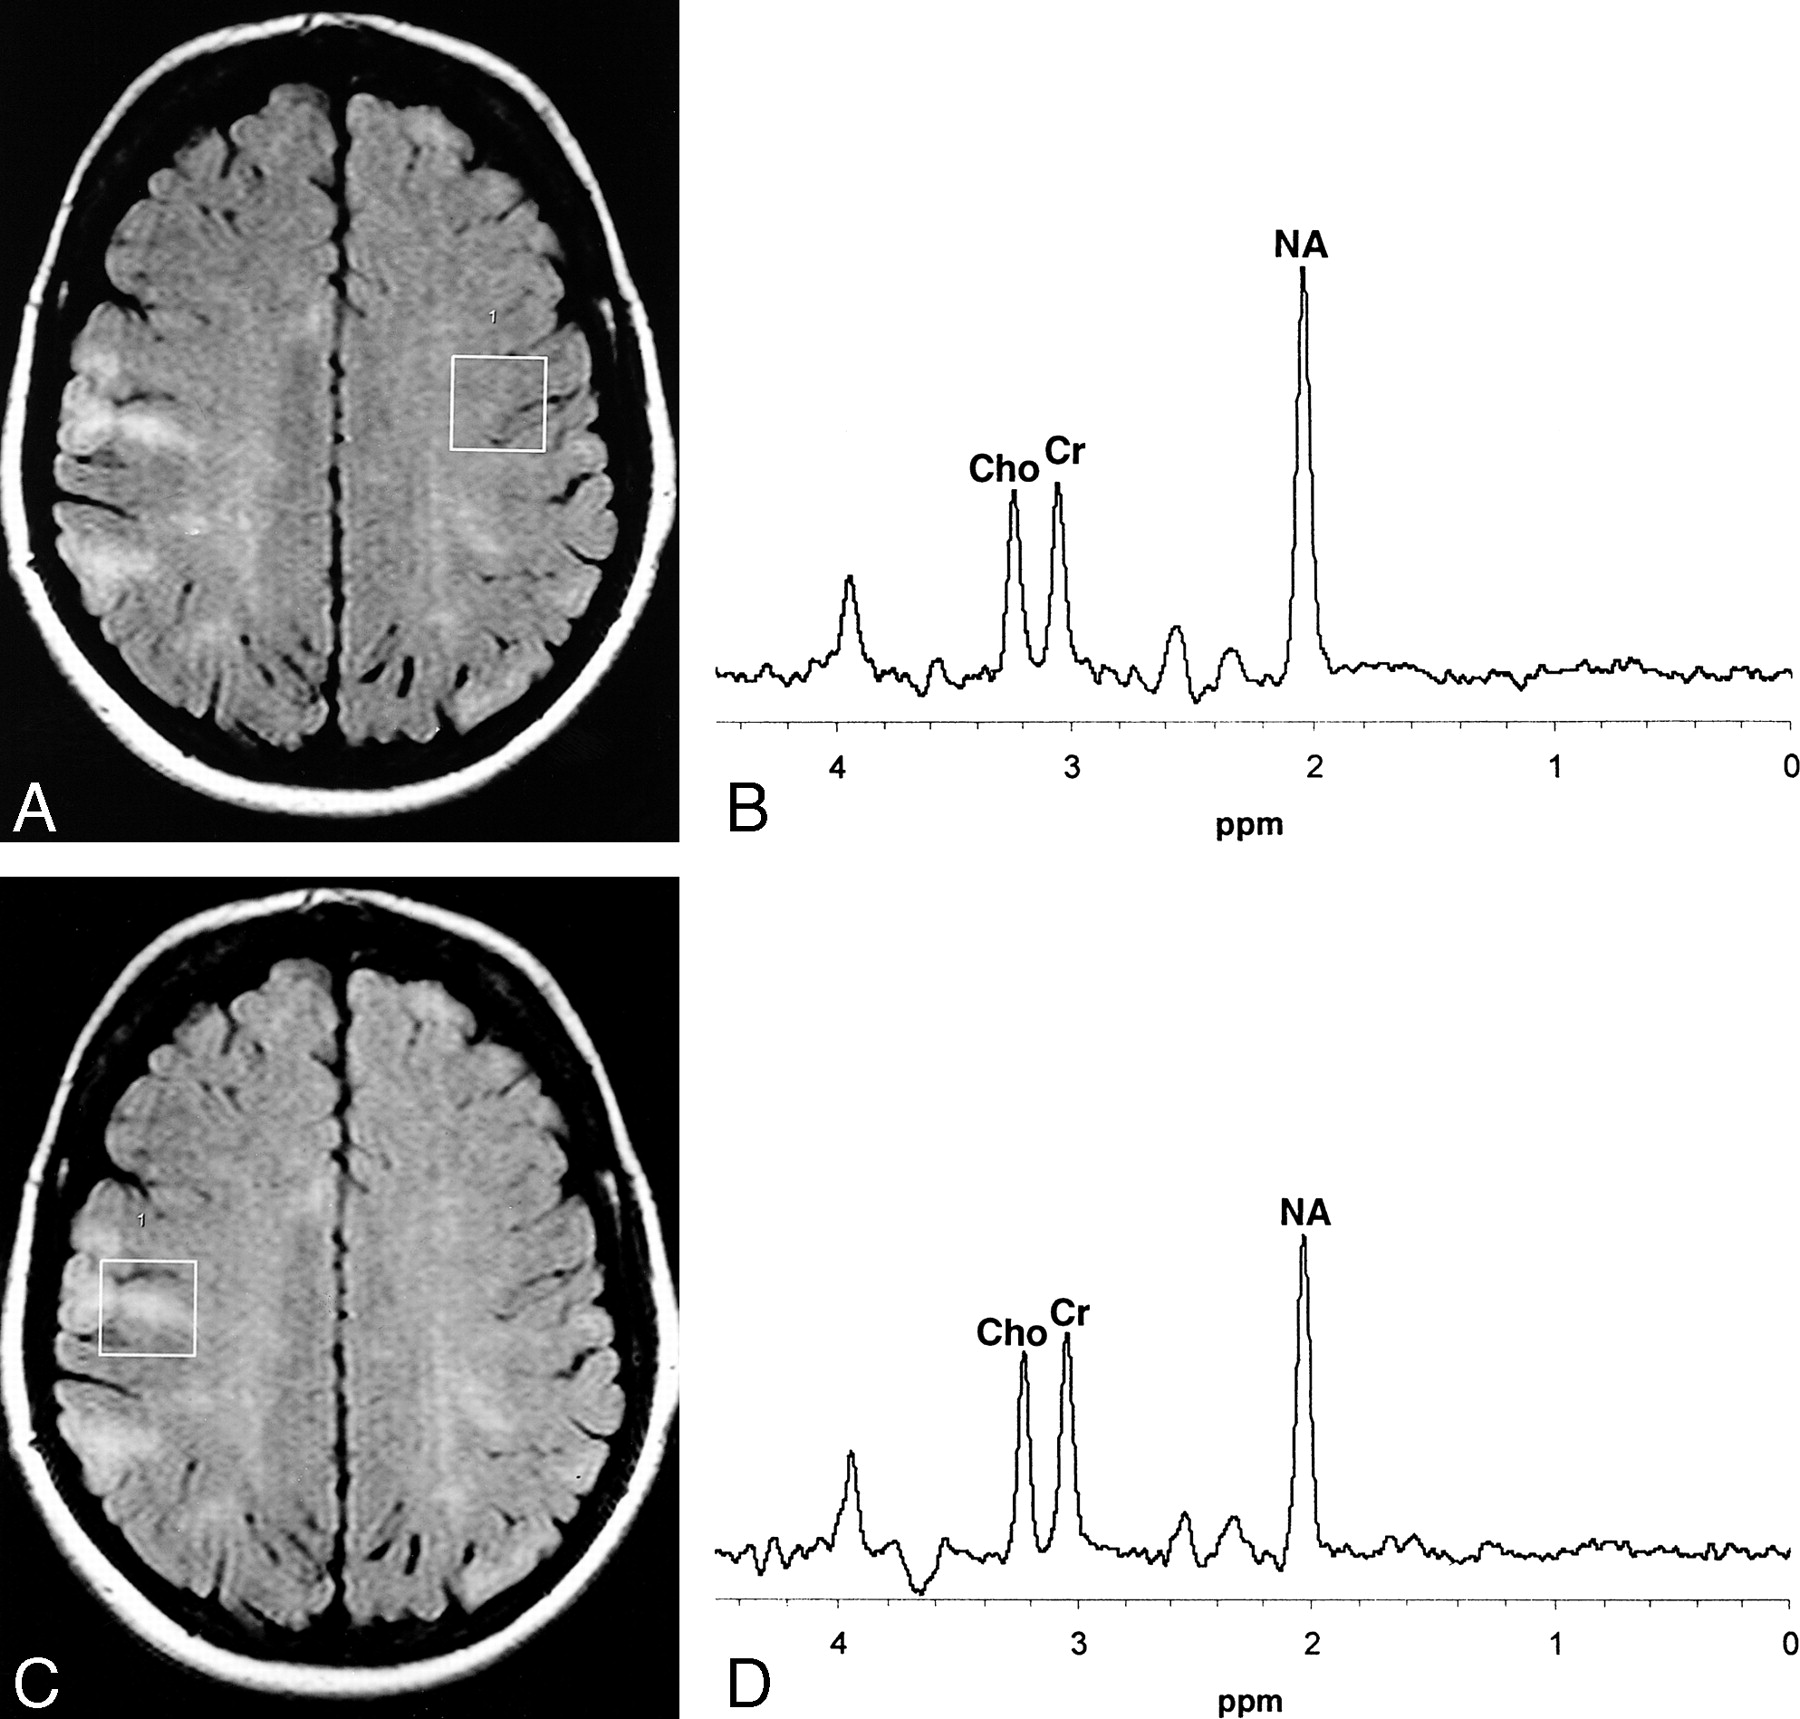
Lactate was not detected in any of the cortical tubers or the normal-appearing brain. Figure 2 shows two examples of typical spectra obtained from our subjects with TSC.

Typical normal spectrum from patient with TSC.
A, Axial fluid-attenuated inversion recovery (FLAIR) image shows the sampled region of interest over an area of normal-appearing brain in the cerebral hemisphere contralateral to the cortical tuber.
B, MR spectrum shows that the Cho and Cr peaks are approximately equal in height while the NA peak is approximately double the height of the Cr peak.
C, Axial FLAIR image shows a region of interest for spectroscopic analysis centered over a typical cortical tuber.
D, MR spectrum from the cortical tuber shows that the Cho and Cr peaks are identical in height to those of normal-appearing brain. There is, however, a marked reduction in the height of the NA peak.
Discussion
TSC is an autosomal dominant condition with variable penetrance. Two TSC gene loci have been identified, on chromosomes 9q34 (TSC1) and 16p13.3 (TSC2). There is a high spontaneous mutation rate, with 60% to 70% of cases occurring sporadically (8–10). The diagnosis of TSC is largely based on clinical criteria, although the finding of cortical tubers on imaging studies satisfies a major criterion for diagnosis (1, 11). Sporadic cases may, however, present with atypical clinical and imaging features, and occasionally there will be uncertainty as to the nature of cortical or subcortical brain lesions, as exemplified in Figure 3. MR spectroscopic features show promise in increasing diagnostic confidence in such cases.

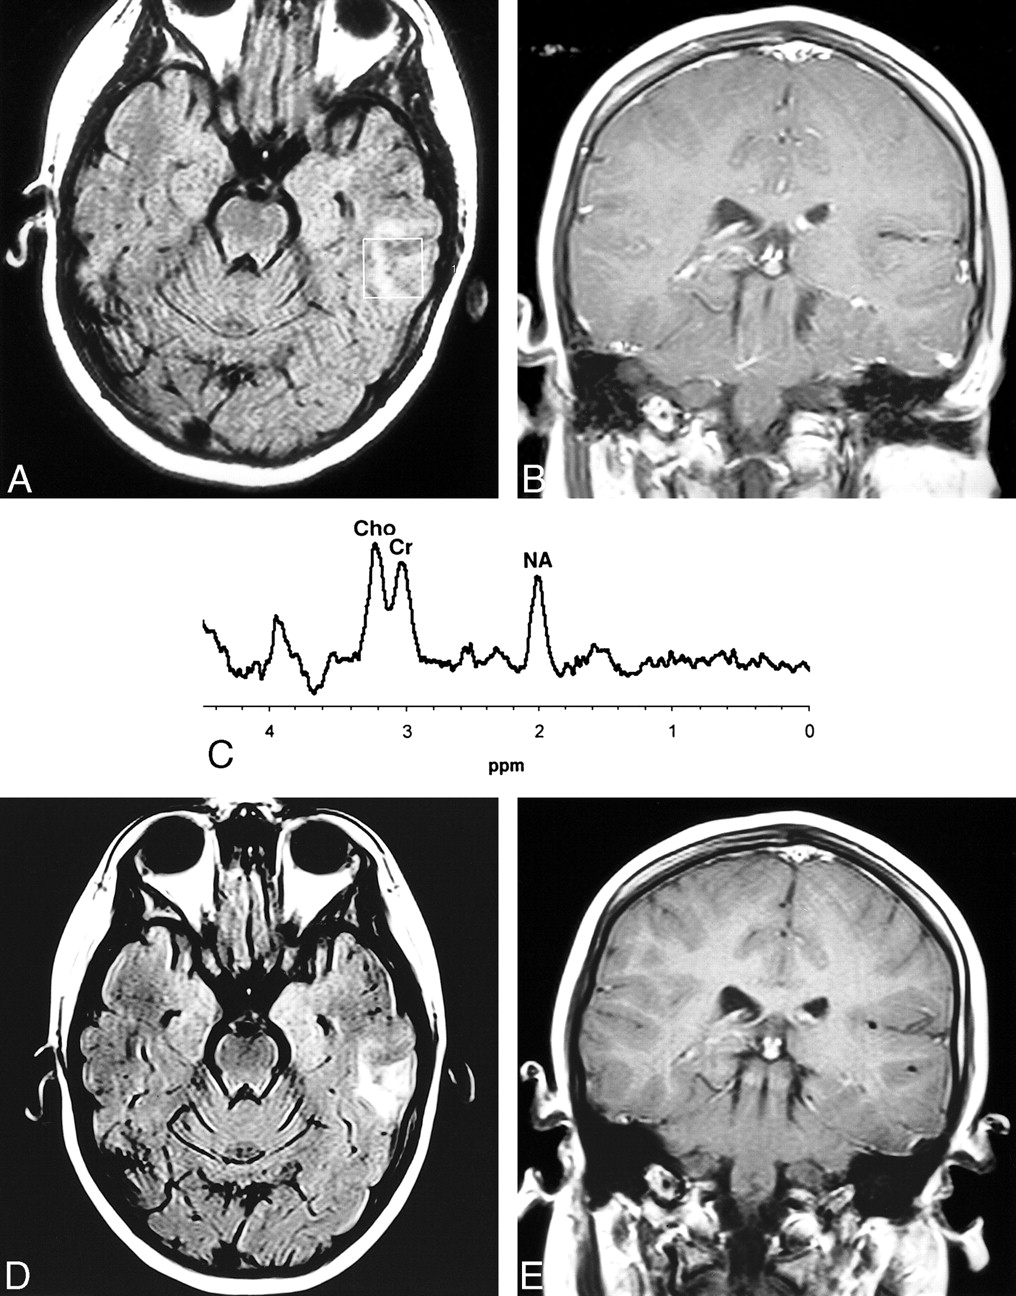
9-year-old girl thought to have TSC by the referring pediatrician. A calcified lesion was found in the anterior left temporal lobe on CT (not shown).
A, Axial FLAIR MR image shows a high-signal-intensity abnormality in the left temporal lobe that corresponds to the area of calcification on CT scan.
B, Coronal contrast-enhanced T1-weighted image shows no enhancement.
C, Proton MR spectrum of this lesion shows an increase in Cho and a marked reduction in the NA peak, in keeping with a neoplasm rather than a cortical tuber. Review by pediatric neurologists and dermatologists confirmed that TSC was not present clinically.
D and E, Follow-up MR study 6 months later shows the lesion has increased in size on FLAIR image (D), but still does not enhance after contrast administration (E). A diagnosis of low-grade astrocytoma was made on the basis of biopsy findings.
The prominent resonances detected on proton MR spectroscopy in normal brains include NA, Cho, and Cr. The NA groups (mainly N-acetylaspartate) are largely confined to neurons and neuronal processes, and depletion of NA is generally considered a marker of neuronal disease. Creatine is more concentrated in glia than in neurons and Cr levels tend to remain relatively unchanged in a number of disease conditions. Creatine is therefore often used as a putative internal standard against which the other metabolites can be compared (12). Cho is a component of phosphoglyceride and is therefore a major component of cell membranes. The signal from Cho detected on spectroscopy therefore increases in conditions associated with increased cell membrane turnover, such as tumors (12, 13). Lactate is not shown normally but may be found in tumors or areas of acute ischemia or infarction.
The lower NA/Cho and NA/Cr ratios in cortical tubers found in this study relative to normal brain may have been due to changes in the concentration of the metabolites, changes in the T1 or T2 signal of the metabolites, or a combination of these.
Only a few published studies have examined the MR spectroscopic features of cortical tubers. Li et al (14) found a reduction in the NA/Cr ratio within a cortical tuber as compared with an area of brain remote from the tuber in a single case of a 43-year-old man with TSC. Sener (13) reported a reduced NA/Cr ratio and an increased Cho/Cr ratio, consistent with neoplasia, in a cortical tuber in a 3-month-old boy with TSC. A repeat study at the age of 10 months, however, produced results similar to ours, with a reduced NA/Cr ratio and a slightly increased Cho/Cr ratio in the tuber as compared with surrounding normal-appearing brain. Aasly et al (15) performed in vitro proton MR spectroscopy on brain biopsy samples from three adults with TSC who had surgery for intractable epilepsy and found a marked reduction in NA relative to that in biopsy specimens from a group of nonepileptic control subjects.
The number of patients who have undergone spectroscopy in the studies cited is small. Moreover, few of the studies conducted to date have compared the spectroscopic findings in tubers against normal brain in the same patient. Maturational and regional variations in the levels of spectroscopically detected metabolites have been described (16, 17). It is therefore imperative that any investigation of the spectroscopic appearance of cortical tubers should compare the tuber against normal brain in the corresponding anatomic area of the contralateral cerebral hemisphere if intrasubject comparisons are to be made.
Histologically, cortical tubers comprise a heterogeneous population of giant cells, with features of neurons and astrocytes, cells with intermediate characteristics, and cells with extremely primitive attributes. Affected gyri have depleted myelin, and there is often an intense associated gliotic reaction, particularly in the subcortical white matter adjacent to cortical tubers (6). The most obvious explanation for any inferred reduction in NA within tubers is either inadequate expression of NA by the primitive neurons known to be present in cortical tubers or neuronal/glial depletion associated with gliotic change in areas affected by cortical tubers. Indeed, reduced NA has been described in a variety of conditions associated with neuronal depletion, such as leukodystrophies, demyelinating diseases, HIV-related conditions, and Alzheimer disease (13, 18, 19). Alternatively, the reduction in NA could be due to changes in the T1 or T2 signal of NA. Changes in T2 relaxation of NA have been documented in HIV encephalopathy by Wilkinson et al (20), who suggested that these changes could be due to alterations in cellular density or spatial arrangement.
Although the overall data show a reduced NA/Cr ratio within tubers as compared with the contralateral normal-appearing brain, four patients had an increased NA/Cr ratio within the tubers. In one of these patients, the sampled tuber was located in the left parietal cortex but the only normal-appearing brain suitable for spectroscopic sampling was in the right frontal lobe, introducing any possible regional variation as a confounding factor in the results.
Our pooled results show a significantly lower NA/Cr ratio with no significant difference in the Cho/Cr ratio in cortical tubers relative to contralateral normal-appearing brain. None of the tubers showed spectroscopic patterns of a neoplasm. Spectroscopy therefore shows promise as a tool for differentiating cortical tubers from neoplasms in cases in which standard imaging techniques are inconclusive. A child investigated recently in our department (presented in Figure 3 but not included in this study) highlights this potentiality. This child was referred to our institution with a diagnosis of TSC on the basis of seizures, facial rash, and a calcified abnormality in the temporal lobe. It was difficult to see any abnormality on routine MR studies, but gradient-echo T2*-weighted images depicted an area of calcification. Proton MR spectra showed increased Cho, reduced NA, and lactate typical of tumor. A detailed clinical examination did not show any cutaneous features, and the diagnosis of TSC was dismissed. A diagnosis of low-grade astrocytoma was subsequently made.
Some cortical tubers undergo central degeneration and dystrophic calcification. Consequently, one might expect some cortical tubers to express lactate at proton MR spectroscopy. We did not detect lactate in any cortical tubers in this study; however, none of the cortical tubers we examined showed any evidence of calcification on T2*-weighted images. Lactate may, however, not be increased in chronic ischemic conditions. The dystrophic calcification of cortical tubers most likely results from chronic ischemia; therefore, calcified cortical tubers may not express lactate. Further studies to evaluate the spectroscopic appearance of calcified cortical tubers would be instructive in further defining their natural evolution and development.
Conclusion
This study has revealed significantly lower NA/Cr and NA/(Cho+Cr) ratios in cortical tubers than in contralateral normal-appearing brain. None of the cortical tubers showed spectroscopic evidence of neoplasia. While these findings in an adult population are instructive, it is envisaged that this technique will be of greatest use in the investigation of atypical presentations of TSC in the pediatric age group.
Acknowledgments
We are grateful to all the volunteers who participated in the study and to the Tuberous Sclerosis Association of Great Britain, which supported the study financially and practically. We also appreciate the expertise of the MR radiographers from the University of Sheffield, and would also like to thank Dr. J. Murdoch, research scientist (Marconi Medical Systems, Milwaukee) for his help with setting up the spectroscopy service.
Footnotes
1 Address reprint requests to Paul D. Griffiths, Schering Professor of Radiology, Section of Academic Radiology, C Floor, Royal Hallamshire Hospital, Glossop Rd, Sheffield S10 1SJ, United Kingdom.
References
- Received February 16, 2001.
- Copyright © American Society of Neuroradiology


