
Abstract
BACKGROUND AND PURPOSE: Brain biopsy remains an integral and necessary component in the diagnosis of brain lesions. We assessed the ability of turbo spectroscopic imaging (TSI) to provide a physiologically based target for tissue sampling.
METHODS: TSI was performed in 26 anesthetized patients immediately before MR-guided brain biopsy. In 10 patients, single-voxel spectroscopy was performed on the TSI-indicated target and correlated with the TSI findings. Biopsy samples were taken from the imaging and spectroscopically defined target(s) under MR guidance, and pathologic findings were compared with preoperative spectra.
RESULTS: TSI alone provided a definitive target based on a region of elevated choline in 17 of 21 patients in whom a neoplasm was confirmed. The remaining four neoplasms exhibited relatively low metabolic levels and were difficult to distinguish from the five cases of radiation necrosis seen in this study. TSI findings were in qualitative agreement with those obtained at single-voxel spectroscopy, although TSI spectra exhibited more contamination. Quantitative spectral analysis of TSI data is limited by low spectral resolution.
CONCLUSION: TSI is helpful for determining an appropriate biopsy target in heterogeneous lesions. Coupling TSI targeting with conventional imaging and intraoperative confirmation of needle positioning resulted in a 100% diagnostic success rate and increased the clinician's confidence in the histologic findings.
Biopsies of brain tumors are usually performed using frame-based or frameless stereotactic techniques that apply anatomic data obtained preoperatively by CT or MR imaging (1). The actual selection of the biopsy target is usually based on the lesion's anatomic appearance and/or its enhancement properties. In patients with heterogeneous lesions, or in those who have received radiation therapy, these imaging findings may be insufficient for defining an optimal target for pathologic assessment (2). Proton MR spectroscopy is increasingly being used to classify brain lesions on the basis of relative levels of visible brain metabolites. The relative levels of N-acetylaspartate (NAA) and choline (Cho), in particular, have been helpful in classifying and differentiating brain neoplasms (3–6). It seems desirable, therefore, to use this spectroscopic information to help define an optimal site from which to obtain a biopsy specimen.
Chemical shift imaging (CSI) is a technique whereby spectra are spatially resolved. CSI acquisitions tend to be rather slow (>30 minutes), and faster acquisitions typically require the sacrifice of spatial resolution to achieve clinically feasible durations (7, 8). Turbo spectroscopic imaging (TSI) is a technique analogous to the turbo or fast spin-echo imaging technique that allows the acquisition of CSI data without loss of resolution and in more clinically acceptable periods (9). In this study we investigated the benefits of adding TSI to conventional MR techniques for target selection in brain biopsy. It was our hypothesis that the additional information afforded by spectroscopic imaging would aid in determining an appropriate biopsy site. Intraoperative imaging was used to assure that the intended target was sampled. Wherever possible, the spectral information obtained from TSI acquisitions was compared with findings obtained at single-voxel spectroscopy (SVS).
Methods
All imaging and spectroscopy were performed in an interventional MR suite containing a 1.5-T magnet equipped with high-performance gradients (23 mT/m amplitude and 105 mT/m per millisecond slew rate). The suite was also set up to provide MR-compatible anesthesia (Ohmeda, Liberty Corner, NJ), patient monitoring (In Vivo, Orlando, FL), a surgical microscope (Leica, Heerbrugg, Switzerland), a craniotome (Midas Rex, Fort Worth, TX), a fiberoptic headlight (Cogent Light Technologies, Santa Clarita, CA), bipolar cautery (Codman, Randolph, MA), and numerous surgical instruments. The suite has been described in detail elsewhere (10). A titanium, blunt-tipped, side-cutting, prototype biopsy needle (Elekta, Decatur, GA) was used to harvest tissue samples.
Patients
TSI-guided brain biopsy was performed in 26 patients, including 19 males and seven females with an average age of 46 years (range, 16–70 years). Sixteen patients had previously received radiation therapy for their lesions. Nine of the remaining lesions were being assessed for the first time, and one patient had undergone a hemispherectomy 11 years earlier. Informed consent was received from all patients in compliance with our institutional review board requirements. All patients were placed under general anaesthesia immediately before spectroscopic imaging, and this was maintained for the duration of the procedure.
Spectroscopic Imaging
Conventional imaging was used to place a 20-mm-thick slab from which the TSI data were acquired. TSI (32 × 32 grid of spectra in a single plane; spatial resolution, 0.66 × 0.66 × 2.0 cm3; spectral resolution, 4.4 Hz; TR/TE/excitations, 2000/272/3; acquisition time, 11 minutes) was performed immediately before burrhole preparation. For TSI acquisitions, k-space was divided into three concentric circles of increasing area such that the area of the inner circle matched that of the outer two annuli. The first echo was always used in the innermost region of k-space, with the second and third echoes being placed in the first and second outer annuli, respectively (Fig 1). The corners of k-space were not acquired in this scheme. An outer volume suppression technique was used to suppress extracranial lipid signal. This consisted of 12 saturation bands that were oriented perpendicular to the acquisition plane and were placed in an elliptical fashion around the volume of interest. Shimming was performed with first-order linear shims.

A, Diagram shows the TSI pulse sequence. The initial 90° excitation pulse is followed by two 180° refocusing pulses, and each of these pulses is slice-selective in orthogonal directions. The signal from this selected volume is then phase-encoded and acquired (echo1). The phase encoding is rewound and the signal is then refocused, phase-encoded, and acquired again (echo2).
B, The third echo is acquired in an analogous way. K-space is filled in such that the first echoes fill in the inner third of k-space while the second echoes fill out the middle third, and the third echo fills out the outer third. Phase-encoding must be performed in two orthogonal directions (Kx, Ky), and thus a full signal acquisition occurs at each point on this Kx-Ky grid. Kx-Ky points lying outside the largest circle are not acquired to reduce imaging time

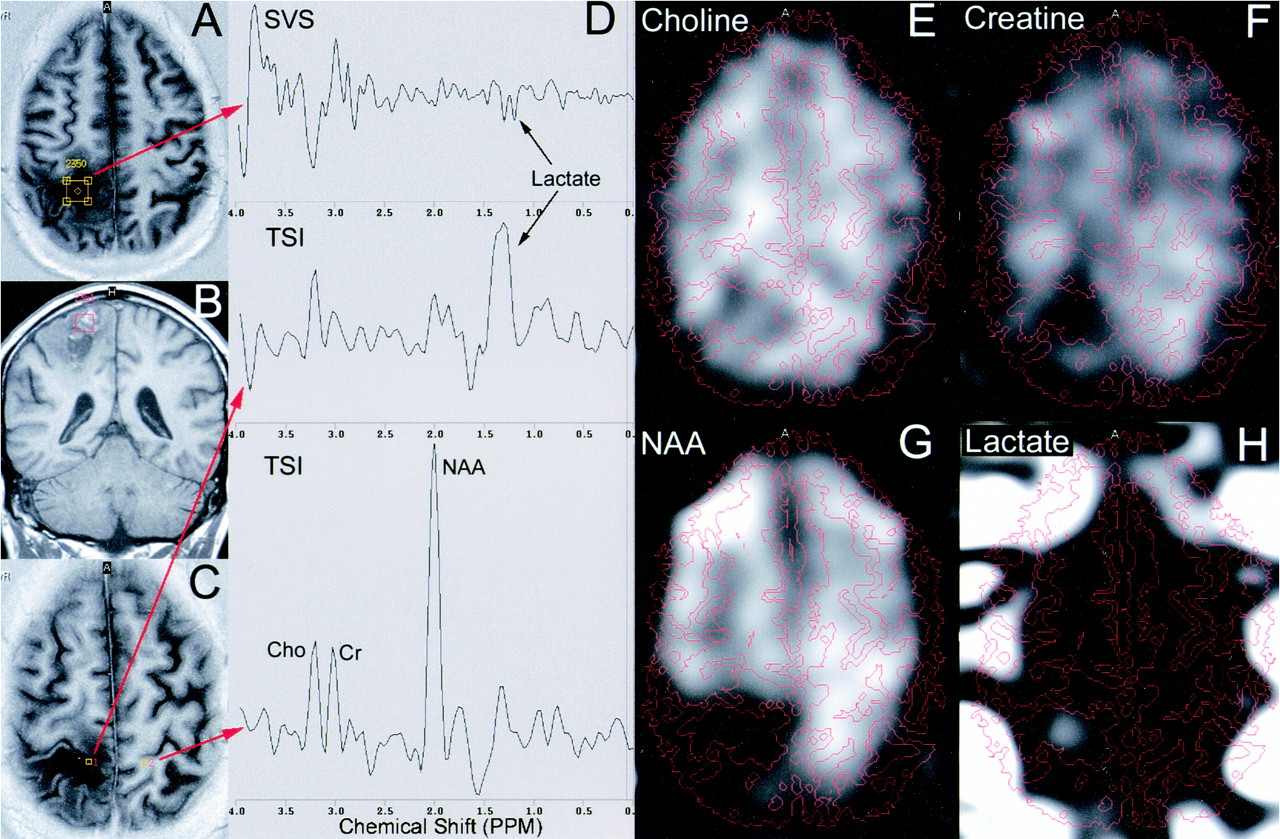
TSI findings in a 64-year-old man with a previously treated right parietal glioblastoma multiforme who presented with a rim-enhancing lesion.
A, Three representative spectra are shown from the locations indicated by the yellow stars on the corresponding images.
B and C, The spectroscopic volume is indicated (green line) on a coronal turbo-FLAIR image (B) and in-plane anatomic features are shown on an axial inversion-recovery scan (C).
D–G, Images reconstructed by integrating the area under the Cho (D), Cr (E), NAA (F), and lipid (G) peaks are shown with anatomic overlay contours extracted from the inversion-recovery image. The rim of the lesion exhibits enhanced Cho with corresponding reductions in Cr and NAA as compared with the reference spectrum (A). This is indicative of active tumor growth. The core of this lesion, however, reveals only a pronounced lipid peak, consistent with necrosis
An inversion-recovery acquisition (4869/14/9; TI, 170; field of view [FOV], 210 mm; slice thickness, 4.0 mm with a 0.8-mm gap; number of slices, 21; matrix, 256 × 256; scan time, 1:48) was performed with the same angulations, offsets, and FOV as used for the TSI data to provide an anatomic contour overlay for the CSI maps. In 10 of 26 patients, SVS (2000/136; voxel size, 1.5 × 1.5 × 1.5 cm3; spectral resolution, 1 Hz; acquisition time, 4.5 minutes) was also performed on the TSI-indicated target.
Spectral Processing
In this process, an inherent apodization of the data is introduced by the method in which k-space is filled in. The central region of k-space has the shortest echo time and therefore the highest signal. There is a stepwise reduction of the signal into the outer two annuli of k-space that in essence filters the data. An additional gaussian filter is applied in both the spatial and chemical-shift directions before the Fourier transform. An exponential filter is then also applied to sharpen the lines. Since only a magnitude reconstruction of the spectroscopic data was performed, there is no phase correction applied at this time. A stage of the prescan does, however, maximize the alignment of resonance frequencies across all voxels. A 3D Fourier transform is then applied to the data, and chemical-shift images are reconstructed. These images are created by integrating the spectral area of the Cho (3.06–3.25 ppm), creatine (Cr) (2.87–3.06 ppm), NAA (1.92–2.10 ppm), and lactate (1.10–1.42 ppm) peaks.
MR-Guided Brain Biopsy
On the basis of the appearance of the CSI images, selected full spectra were interrogated at specific points of interest. The CSI maps, in conjunction with conventional images and selected spectra, were then used to determine the most appropriate target for pathologic evaluation. In instances in which a region of pronounced Cho elevation was visible, this was selected as the target. In cases in which a focal region of Cho elevation was not detected, the surgeon and radiologist came to a mutual agreement on the target, primarily on the basis of conventional imaging results. Once the target was determined, an appropriately positioned burrhole was prepared and a trajectory guide (11) (Navigus, Image-Guided Neurologics, Melborne, FL) was inserted. The spatial coordinates of the region of elevated Cho (if any) were extracted and conventional anatomic scans intersecting this point were prescribed. Two orthogonal scan planes whose line of intersection defined the linear path between the burrhole and target lesion were typically acquired. The trajectory guide was aligned to be collinear with the desired path using prospective stereotaxy (12). After locking the trajectory guide along the specified path, the biopsy needle was slowly inserted and snapshot images of its location were acquired. Once the target was reached, biopsy samples were harvested and sent for histologic analysis. Immediately after the removal of the biopsy needle, a set of turbo fluid-attenuated inversion-recovery (FLAIR) images (6000/100/27; TI, 2000; FOV, 220 mm; slice thickness, 4.0 mm with a 0.8-mm gap; number of slices, 15; matrix, 256 × 256; scan time, 1:24); single-shot T2-weighted spin-echo images (7000/84/92; FOV, 220 mm; slice thickness, 4.0 mm with a 0.8-mm gap; number of slices, 15; matrix, 256 × 256; scan time, 0:14); and T2*-weighted gradient-echo images (525/30; FOV, 220 mm; slice thickness, 4.0 mm with a 0.8-mm gap; number of slices, 15, flip angle, 25°; matrix, 256 × 256; scan time, 1:26) were acquired to exclude the presence of hemorrhage.
Spectral Processing and Analysis
In all patients, spectra were extracted from the TSI data sets from the portion of the lesion that appeared most abnormal. In lesions with a pronounced region of elevated Cho, the spectrum corresponding to this location was selected. In heterogeneous or multifocal lesions, multiple spectra were extracted corresponding to distinct regions within the lesion. In addition, a reference spectrum was selected from tissue contralateral to the lesion. In cases in which the contralateral tissue was also diseased or had previously been resected, the reference spectrum was selected from a portion of the brain that appeared normal. For each spectrum, the area under the Cho, Cr, and NAA peaks was quantified and tabulated. Ratios of metabolic concentration, including the relative amount of Cho and NAA in the lesion as compared with the reference tissue, were also calculated.
Results
In all cases, a TSI scan plane was selected that was approximately axial in orientation but with various degrees of obliquity. In no instances was contrast material administered before the acquisition of spectroscopic data. MR spectroscopy was then successfully performed and resulted in acceptable spectra in all patients. In 10 of 26 patients an additional SVS acquisition was obtained at this time at a spatial location of interest based on the TSI data. The spectroscopic and imaging data were then used to determine an appropriate target site (Fig 2) while a burrhole was prepared. The Cho image was used extensively to determine focal regions of relatively high levels of this metabolite. The Cr, NAA, and lactate maps were also used to help further categorize lesions. The ability to overlay anatomic contours directly on the spectroscopic maps was extremely useful for coupling the metabolic information with brain and lesion morphology. Subsequent to visual inspection of the metabolic images, individual spectra were extracted from the portion of the lesion exhibiting high Cho (if present) and selected other regions of the brain for reference. With multifocal or large heterogeneous lesions, spectra were selected from several different aspects of the lesion that were considered to be highly abnormal (Fig 3). We considered it necessary to view selected actual spectra rather than to rely solely on the reconstructed spectral images in order to assure the integrity of the source data. In all cases, however, we thought that the reconstructed metabolic maps appropriately reflected the spectra from which they were derived.
After selection of the target and creation of a burrhole, patients were moved to the MR scanner and real-time imaging was used to appropriately align the trajectory guide. The introduction of the biopsy needle was monitored in a stepwise fashion, with snapshot images were acquired at several discrete time points (Fig 3). After it was confirmed that the biopsy needle was at the desired target, the patient was moved out the back of the magnet and tissue samples were harvested (Fig 4). This methodology proved effective for positioning the needle and allowed confirmation that the pathologic sample was obtained from the desired tissue in all 26 patients. The resulting biopsy samples were diagnostic in all cases and the pathologic findings included glioblastoma multiforme (n = 9), oligodendroglioma (n = 4), anaplastic oligodendroglioma (n = 5), astrocytoma (n = 1), lymphoma (n = 1), germinoma (n = 1), and radiation necrosis (n = 5). MR imaging to screen for complications was performed immediately after tissue harvesting or at the conclusion of the procedure, but did not reveal a clinically significant hemorrhage in any of these patients.

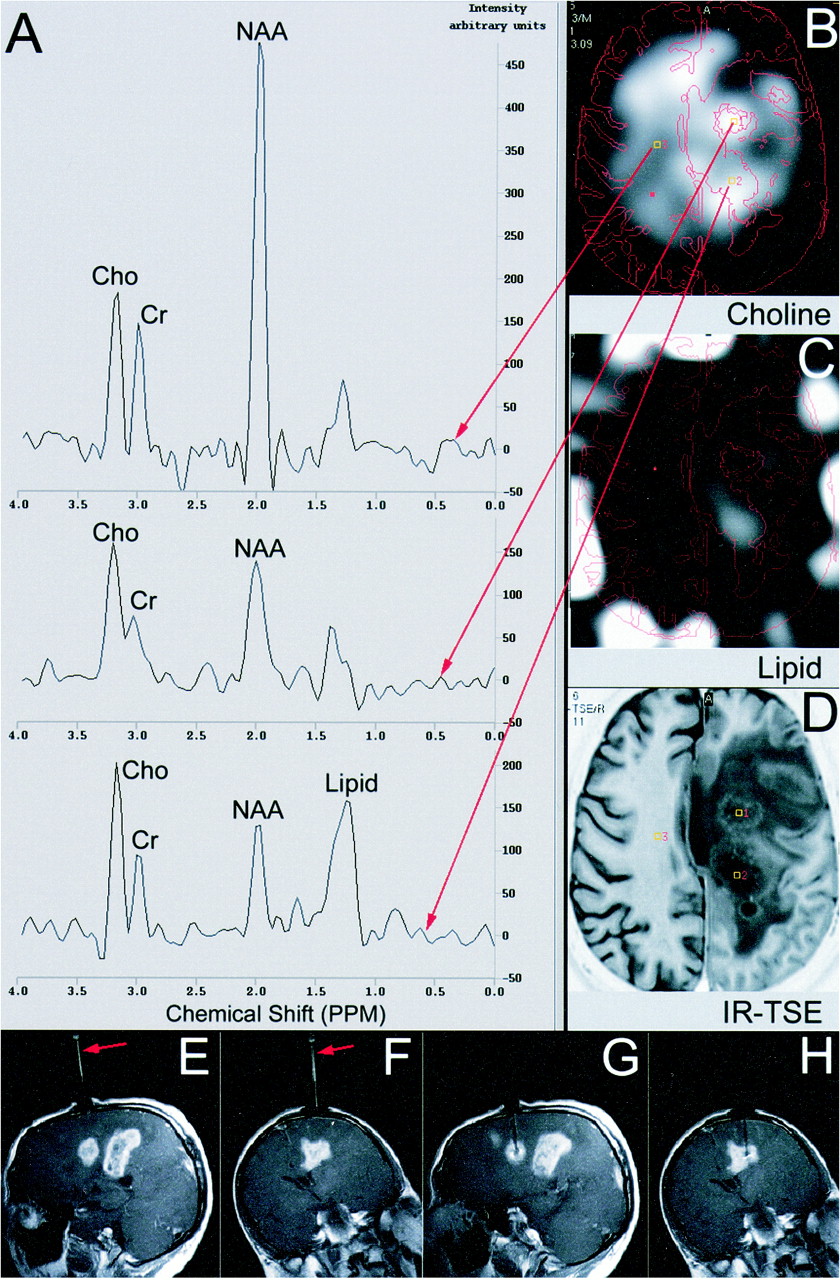
37-year-old-man with a history of oligodendroglioma who had previously had a resection and received radiation therapy. He presented with three separate enhancing lesions and extensive surrounding edema.
A, Spectra were extracted that corresponded to the most posterior lesion (bottom spectrum), the middle lesion (middle spectrum), and the relatively normal contralateral hemisphere (top spectrum).
B–D, The reconstructed Cho (B) and lipid (C) maps are shown with anatomic contours extracted from an inversion-recovery image (D). Both lesions showed elevated Cho with reduced Cr and NAA. The most posterior lesion is likely more necrotic, as evidenced by lipid both on its spectra and in the corresponding region of the lipid image.
E–H, Immediately after preoperative imaging, a burrhole was created and trajectory alignment was accomplished. A contrast agent was administered, and T1-weighted imaging was performed during the alignment and biopsy processes. The central region of enhancement was selected for biopsy and an appropriately aligned trajectory guide was visible in oblique sagittal (E) and coronal (F) planes. These image planes were then monitored during the insertion of the biopsy needle to assure it reached the intended target (G and H)
Target Effectiveness
The relative area under the Cho and NAA peaks was tabulated for all patients (Table 1). A ratio of the area under the metabolic peak between the lesion and reference tissue was selected, as it best reflected the visual information evident in the spectroscopic images. Additionally, the very low signal-to-noise ratio of the Cr and NAA peaks in many lesions made conventional intralesional measures, such as Cho/Cr and Cho/NAA, less practical. This is evident in the Table, in which the average NAA level in the lesion as compared with that in the reference tissue was 0.45 (range, 0.06–1.03; median, 0.46). The signal-to-noise ratio of the NAA peak in normal tissue was in the range of 8 to 12 for all patients, and thus spectral noise can play an appreciable role.
Relative choline and NAA content of brain lesions
TSI alone was thought to have provided a definitive target based primarily on a focal region of Cho elevation in 17 of 26 patients. The five patients with radiation necrosis, however, were among the nine patients in whom TSI did not provide a definitive target. These five patients all had lesional metabolic levels at or well below those seen on the reference spectra. An absence of a focal region of increased Cho, with overall reduced metabolic levels, is consistent with radiation necrosis (Fig 5), and thus this must be considered a positive finding. These spectra frequently showed the presence of lipid or lactate. Also, it was noted that the degree to which the Cho peak was reduced with respect to reference spectra was generally less than either the Cr or NAA peaks.
A definitive target based on TSI characteristics was identified in 17 of 21 patients in whom some form of neoplasm was confirmed on histologic assays. Neoplasms in which TSI provided a definite target included glioblastoma multiforme (n = 7), oligodendroglioma (n = 4), anaplastic oligodendroglioma (n = 5), and astrocytoma (n = 1). Six of these neoplasms were discovered at initial presentation; another patient with a prior hemispherectomy presented with a new contralateral lesion. All these patients had a region of relatively homogeneous Cho elevation demarcating the majority of the lesion, as indicated on conventional images (Fig 6). NAA was reduced within the lesion and Cr tended to remain isointense with respect to the remainder of the brain.
Ten of the patients in whom TSI indicated a definitive target had previously received radiation therapy. Complex heterogeneous and/or multifocal lesions were common in this group. The imaging appearance and enhancement properties of these lesions are known to produce inconclusive findings. TSI, however, proved to be extremely helpful for identifying the specific portion of lesions in which active tumor growth was present (eg, Figs 2 and 3). While the appearance of these lesions was relatively diverse, it was common to see a portion of the lesion in which lipid/lactate was present. This was often in concert with low Cho, Cr, and NAA levels and, if so, was considered to be necrotic. These regions were specifically excluded from consideration as the possible biopsy site. Other portions of the lesion(s) showed the elevated Cho signature that is a marker for tumor activity. NAA, in general, was extremely low throughout these lesions.
TSI failed to show a focal region of increased Cho in the remaining four cases, with pathologic findings that included glioblastoma multiforme (n = 2), lymphoma (n = 1), and germinoma (n = 1). Both glioblastoma multiforme lesions had a region of apparent necrosis, and NAA was very low throughout the lesion. In one case, both Cho and Cr levels stayed at a level similar to that found in other parts of the brain, making it impossible to infer the presence of neoplasm. In the other case (Fig 7), while Cho remained essentially isointense in the most diseased portion of the lesion, it was noted to be slightly elevated with respect to Cr. These findings were not sufficiently distinct from that of radiation necrosis to make a compelling argument for the presence of tumor. It was, however, helpful to know what portion of the lesion was clearly necrotic, allowing for target selection at some other location within the lesion. The cases of lymphoma and germinoma were anatomically similar thalamic lesions measuring 2 to 3 cm across. Neither had previously received radiation therapy, and in both instances, the Cho, Cr, and NAA maps did not reveal any appreciable change within the lesion.
SVS Correspondence with TSI
Among the 10 patients in whom SVS was also acquired, four had glioblastoma multiforme, three had anaplastic oligodendroglioma, two had radiation necrosis, and one had an astrocytoma. TSI and SVS differ fundamentally in their echo time, spectral resolution, and method of spatial localization. However, the qualitative agreement between SVS spectra and TSI spectra extracted from the same spatial location as the SVS volume was generally very good. In only one glioblastoma multiforme of these 10 patients did the neoplasm fall into the category in which TSI did not provide a definitive target (Fig 7). SVS was performed in this particular case because of a lack of specificity of the TSI findings and because of the strong presence of a lactate/lipid peak. The SVS obtained from this lesion contained the same basic features found on the TSI spectrum, including the strong lipid component. This lipid signal was not consistent with lactate, as it did not appear as an inverted doublet on the SVS spectra. It was clear from both these spectra that while an elevation of the Cho peak with respect to Cr was evident, the metabolic levels were very low and therefore it was difficult to infer the presence of tumor with confidence. The SVS spectra, which exhibited higher signal-to-noise ratio and had inherently higher spectral resolution, offered a better opportunity to classify these marginal lesions. The correspondence between TSI and SVS data sets in the case of radiation necrosis was illustrated previously (Fig 5). In the remainder of the cases in which both TSI and SVS were acquired, the same general features were illustrated on both spectra. Differences in relative peak heights were noted but also expected, owing to the different echo times of the techniques. The TSI spectra appeared to consistently show greater spectral contamination, frequently indicating lipid signals that were either not evident or much lower in amplitude on the SVS spectrum. Also, in instances in which the Cho peak was substantially greater than the adjacent Cr peak, it was possible for the latter peak to not be resolved at all with TSI. The higher signal-to-noise ratio and spectral resolution of the SVS data in combination with its low spectral contamination made it vastly superior to TSI for categorizing tissue based on quantified metabolic concentrations.

After appropriate positioning of the biopsy needle within the specified target, the patient was moved out the back end of the scanner and tissue samples were obtained. In this case, the biopsy needle was inserted through one of the two circular coils that constitute the interventional head coil (visible under the sterile drape). The in-room LCD displays used for aligning the trajectory guide and monitoring the needle insertion are visible in the background
TSI findings in a 38-year-old man in whom radiation injury was established on biopsy samples.
A–C, The location of an SVS volume is indicated on an axial inversion-recovery image (A) and a coronal T1-weighted image (B). The locations from which spectra were extracted from the TSI data are also shown on an inversion-recovery image (C).
D, The spectra (top, SVS results; middle, TSI of lesion; bottom, TSI from contralateral hemisphere for reference) show very low levels of Cho, Cr, and NAA, and indicate the presence of lactate within the lesion. Correspondence between the SVS and TSI data was considered to be very good. The lactate peak on TSI was substantially larger than on SVS, which was a common finding. The lactate peak appears as an inverted doublet on SVS and an unresolved positive peak on TSI as a result of differences in echo time and limitations in the TSI spectral resolution.
E–H, The spectral images obtained by integrating the area under the Cho (E), Cr (F), NAA (G), and lactate (H) peaks are also shown. Anatomic contours obtained from the inversion-recovery image (C) are overlaid

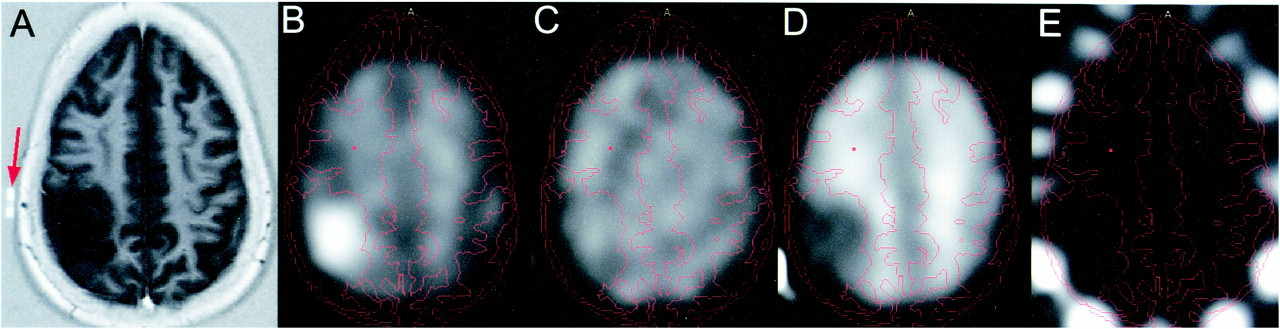
TSI findings in a 46-year-old woman with a large right parietal mass later confirmed to be an oligodendroglioma.
A–E, An inversion-recovery anatomic reference scan (A) shows the extent of the lesion. The intended site of the burrhole is indicated by an MR-visible surface marker (arrow, A). The Cho (B), Cr (C), NAA (D), and lipid (E) images are shown with anatomic contours extracted from the inversion-recovery image superimposed on them. Cho is enhanced and NAA is reduced throughout the lesion. Cr remains largely isointense throughout the brain and no appreciable levels or lipid are evident

A–E, SVS (A) and TSI (B) findings in a patient with a pathologically determined diagnosis of recurrent glioblastoma multiforme. An axial turbo-FLAIR image (C) shows the location from which the SVS data were acquired. The location from which the TSI data were extracted is shown on the reconstructed Cho image (D). Overlaid on the Cho image are contours extracted from an inversion-recovery image (E) acquired at the same spatial location. The patient had prominent lipid resonance and otherwise reduced metabolic levels on both SVS and TSI. While a modest degree of Cho elevation is evident on both spectra, it is difficult to definitively infer the presence of tumor
Discussion
In this study we investigated the benefits of adding spectroscopic imaging to conventional MR techniques for target selection in brain biopsy. Earlier investigators, in a study reviewing the results of 7471 stereotactic brain biopsies, found an overall average diagnostic yield of 91% (1). Most brain biopsies are performed with framed or frameless stereotaxy and use targeting coordinates based on the location of the lesion before the surgery is performed. Unfortunately, it is known that penetration of the skull and dura mater, with possible loss of CSF, can result in brain deformation that can potentially alter the location of the target (13). Other factors that are thought to be important in failed biopsies include small sample and/or target size, inaccurate tissue targeting, and nonideal target selection based on imaging data. By using intraoperative MR imaging, we were able to visualize the biopsy needle within the lesion, effectively eliminating concerns about targeting inaccuracies (14, 15). The potential for flawed target selection resulting from fundamental limitations in image contrast, however, remains even with intraoperative imaging.
The ability of proton MR spectroscopy to detect NAA, a marker of neuronal integrity, and Cho, a marker for active cellular turnover, has proved valuable for detecting the presence of tumor (16, 17). Unfortunately, determining the grade and specific pathologic characteristics of a lesion solely on the basis of MR data has proved much more difficult (18–20). Thus, biopsy remains a necessary and integral component for accurately categorizing brain disorders. CSI allows for the creation of images whose contrast is directly indicative of the relative abundance of MR-visible metabolic compounds. The ability to spatially map this information permits an intelligent choice for the selection of a biopsy site based on local physiological activity. For small and/or homogeneous lesions, conventional imaging techniques are most likely sufficient for specifying biopsy sites. However, when a patient has previously received radiation therapy and subsequently presents with a complex heterogeneous lesion, conventional imaging alone may be insufficient. These lesions commonly have necrotic components and may or may not include regions of residual or recurrent tumor. Unfortunately, distinguishing these processes on the basis of either their appearance on conventional images or their enhancement properties is problematic (2). Accordingly, it is desirable to add the specific physiological information that is provided by MR spectroscopy. This information should significantly improve the clinician's ability to select an appropriate target and allow greater confidence that the disease process is properly categorized by the resulting tissue sample.
The acquisition of spatial spectroscopic information is hindered by low metabolic concentrations and long acquisition times. High-field systems are necessary to obtain sufficient spectral separation and signal-to-noise ratio, but achieving desirable spatial resolutions still results in unacceptably long acquisition times. TSI, which speeds up the acquisition by acquiring multiple echoes per excitation, results in an extended effective echo time and reduced spectral resolution. However, for the general categorization of brain neoplasms, it may not be crucial to be sensitive to rapidly decaying species, such as myo-inositol and glucose. Cho, Cr, NAA, and lactate are all easily detected at an echo time of 272 milliseconds. Additionally, this long echo time results in a flatter baseline, making peak detection easier. The inferior spectral resolution of TSI, however, does pose a greater concern. The 4.4-Hz spectral resolution used in this study is insufficient for resolving the lactate doublet, which has a separation of about 7 Hz at 1.5 T. Moreover, partial voluming effects resulting from this relatively coarse sampling of spectra result in inaccuracies in peak height and area measurements. Thus, while the appearance of the TSI spectra seen in this study was qualitatively in agreement with SVS, the spectra extracted from TSI are insufficient if accurate quantitation of metabolites is desired. Using the spatial information from TSI data to position an SVS voxel provides the full benefits of both techniques, but with increased overall imaging time.
It is appealing to hypothesize that in situations in which recurrent tumor must be distinguished from radiation necrosis, MR spectroscopy may obviate biopsy. However, in approximately 20% of the lesions confirmed histologically to contain tumor, the TSI data failed to identify a definitive target. In some of these instances, TSI did indicate tissue that appeared to be physiologically inactive, and therefore still contributed, via exclusion, to the determination of the biopsy site. Unfortunately, the appearance of this subpopulation of tumors did not differ substantially from that of cases of radiation necrosis. Lesions such as glioblastoma multiforme, which accounted for half the false-negative findings, inherently possess regions of necrosis as well as physiologically active tumor. Accordingly, spectroscopic imaging voxels may contain a mixture of these two pathologic entities. The necrotic component is generally devoid of Cho, Cr, and NAA, and therefore an overall reduction of metabolic peak heights is to be expected. This makes detection of metabolic peaks against the spectral noise more difficult and may obscure the presence of even elevated Cho within the physiologically active portion of the voxel. In such instances, spectroscopic techniques with maximal signal-to-noise ratio and spectral resolution offer the best opportunity to accurately classify the lesion. Thus, techniques other than TSI may be necessary in this subpopulation of patients.
For practical reasons it was not possible to compare the biopsy results that would have been obtained had conventional imaging and enhancement properties alone been used to determine the target. Thus, the additional benefit TSI is perceived to have provided is highly subjective. Additionally, the patient population, lesion type, and treatment history was relatively diverse and thus definitive statements about TSI's sensitivity and specificity for identifying an appropriate target cannot yet be ascertained. It is apparent, however, that TSI does provide additional data that can be beneficial for selecting an appropriate biopsy site in a relatively high percentage of cases. Moreover, the spectroscopic limitations of TSI do not substantially distort the general spectroscopic information that is contained in high-quality SVS data.
Conclusion
TSI is a practical and effective method for obtaining relatively high spatial resolution spectroscopic data in a clinically acceptable period of time. When compared with SVS findings, TSI proved to reliably reflect the general spectral characteristics of lesions but tended to overestimate lipid levels. TSI alone provided a definitive target based on a focal region of elevated Cho in 81% of lesions confirmed histologically to be a neoplasm. This spectroscopic information was particularly helpful with lesions that had previously received radiation therapy and therefore exhibited inconclusive imaging and enhancement properties. In approximately 20% of lesions confirmed to be a neoplasm, it was not possible to identify a definitive biopsy target on the basis of a focal region of elevated Cho. The spectral characteristics of these lesions were difficult to distinguish from radiation necrosis. In inconclusive cases, or in those in which spectral quantification is desired, we recommend a methodology whereby the TSI data are used to optimally localize a subsequent SVS volume.
Footnotes
↵1 Address reprint requests to Haiying Liu, PhD, Department of Radiology, University of Minnesota, 420 Delaware St SE, Box 292, Suite J2-447, Minneapolis, MN.
References
- Received August 8, 2000.
- Copyright © American Society of Neuroradiology


